

Worldwide, the elderly population is expanding faster than any other age group and has been seen to double since 1980 (WHO). While a growing ageing population is indicative of advances in global health, this population is a vulnerable group in terms of disorder. This has both medical and economic impacts. Therefore, strategies to promote healthy ageing are desirable. During the ageing process, certain changes in the immune system have been observed. The process often referred to as immunosenescence has been characterised by deterioration of both the adaptive and innate immune responses( Reference Toward, Walton and Gibson 1 ).
Changes to the ageing immune system often include reduced thymic T-cells, resulting in a substantial decrease in antigen-specific immunity( Reference Linton and Dorshkind 2 ). There are fewer bone marrow early progenitor B cells( Reference Allman and Miller 3 ) and an accumulation of functionally incompetent memory cells( Reference Wertheimer, Bennett and Park 4 ). Thus, a reduction in antigen recognition may be observed with ageing. More recently, attention has turned to so-called ‘inflammaging’, the development of a low-grade chronic proinflammatory state. Such changes are characterised by raised levels of IL-6 and TNF, with reduced IL-10( Reference Bartlett, Firth and Phillips 5 ). A similar inflammatory status has been observed in diabetes, some vascular diseases and oesteoporosis. As such, reducing these inflammatory changes may positively have an impact on a range of conditions associated with ageing( Reference Licastro, Candore and Lio 6 , Reference Kinzenbaw, Chu and Peña Silva 7 ).
The colonic microbial community has also been seen to change with ageing. The most consistent observation is a decline in the beneficial genus Bifidobacterium spp.( Reference Hopkins, Sharp and Macfarlane 8 – Reference Zwielehner, Liszt and Handschur 10 ). Other reports have suggested lower levels of known butyrate producers, Clostridium cluster XIVa and Faecalibacterium prausnitzii( Reference Mueller, Saunier and Hanisch 11 , Reference Rajilic-Stojanovic, Heilig and Molenaar 12 ). The human intestinal tract, particularly the colon, is home to a vast array of diverse bacteria that interact and develop along with the host. Recent studies have provided evidence that the microbiota and associated metabolites may modulate certain immunological signalling pathways( Reference Chen and Kasper 13 ). One strategy for modulating immune system changes is, therefore, through specific targeting of gut microbial changes.
Prebiotics have been used to alter the gut microbiota through the selective stimulation of bacteria in the intestinal tract that are deemed positive to human health( Reference Gibson, Scott and Rastall 14 ). Prebiotics, such as inulin and GOS (galacto-oligosaccharides), often target the Bifidobacterium genus. This is related to the size and structure of these prebiotics. We have previously researched a GOS product manufactured by reverse β-galactosidase synthesis from enzymes in Bifidobacterium bifidum NCIMB 41 171( Reference Tzortzis, Goulas and Gibson 15 ). This B-GOS (Bimuno–GOS mixture) has been observed to support the growth of bifidobacteria in young, older, overweight humans and in patients with irritable bowel syndrome( Reference Depeint, Tzortzis and Vulevic 16 – Reference Silk, Davis and Vulevic 19 ). Furthermore, animal models have shown B-GOS to exhibit anti-infection mechanisms against Salmonella enterica Typhimurium( Reference Searle, Cooley and Jones 20 ), and positive effects on the immune response in older and overweight individuals have also been observed( Reference Vulevic, Drakoularakou and Yaqoob 17 , Reference Vulevic, Juric and Tzortzis 18 ). While interaction of the gut microbiota with the immune system is becoming more recognised, there is a need to further elucidate whether altering the microbiome by dietary intervention can influence immunosenescence. As such, the present study tested B-GOS as a prebiotic in elderly persons, while also investigating immunological parameters and metabonomic profiles.
Materials and methods
Unless otherwise stated, all chemicals and reagents were obtained from Sigma-Aldrich Company Limited. Fluorescent probes, the K562 cell line and cell culture media, and supplements were also obtained from Sigma-Aldrich Company Limited.
Subjects and study design
A total of forty elderly volunteers (25 women and 15 men; average age 70·4 (sd 3·8) years; range 65–80 years) were enrolled into this randomised, double-blind, placebo-controlled, cross-over study. Using MGH Biostatistics Software, thirty-four volunteers were estimated to provide 90 % statistical power based on a cross-over design and an average change of 13·5 (sd 26) for natural killer (NK) cell activity, and forty volunteers were estimated to provide 90 % statistical power based on a cross-over design and an average log change of 0·26 (sd 0·55) for Bifidobacterium spp. using data from a previous trial with B-GOS in elderly( Reference Searle, Cooley and Jones 20 ). Thus, to cover for both variables, forty volunteers were enrolled into the trial. Trial exclusion criteria included use of antibiotics 3 months before commencing the study; regular use of prebiotic, probiotic or synbiotic supplements 2 weeks before the study; use of immunosuppressive or anti-inflammatory drugs or any drugs affecting intestinal mobility; former participation in another study involving prebiotic, probiotic or synbiotic preparations or other investigational drugs 6 months before the study; and history or evidence of any intestinal disorders. The present study was conducted according to the guidelines laid down in the Declaration of Helsinki, and all procedures involving human subjects were approved by the University of Reading Ethics and Research Committee. Written informed consent was obtained from all volunteers, and they were assessed before the beginning of the trial for good general health. The study was registered at clinicaltrials.gov (identifier no. NCT01303484).
Volunteers were randomly assigned using an allocation ratio of 1:1 to one of two groups: one started the trial with the placebo (maltodextrin) and the other with B-GOS, with both compounds provided in powder form (5·5 g) and supplied by Clasado Limited. Doses of both products have been previously used in human subjects( Reference Depeint, Tzortzis and Vulevic 16 – Reference Silk, Davis and Vulevic 19 ). Composition of the B-GOS mixture is presented in Table 1. Subjects were asked to reconstitute the contents of the sachets immediately before consumption by mixing the powder with water and to consume the product every day at approximately the same time. They consumed the products for 10 weeks, followed by a 4-week washout period, before switching to the other intervention for the final 10 weeks. Volunteers were required to visit the University of Reading on eight separate occasions during this period. Their blood pressure and weight were recorded and faeces collected at each visit (4 weeks before the beginning; on day 0; and after 5, 10, 14, 19, 24 and 28 weeks). During all visits (except 4 weeks before the beginning), blood was sampled and the use of any medication (including vitamin–mineral supplements) and adverse events were recorded. In addition, subjects were asked to confirm their compliance with, or deviation from, the study protocol and to keep daily diaries recording bowel movements, stool consistency and incidences of abdominal pain, flatulence and bloating.
Composition of galacto-oligosaccharide mixture (B-GOS) including degree of polymerisation (DP) and saccharide linkages, as percentage of the galacto-oligosaccharide content* ( Reference Gibson, Scott and Rastall 14 )
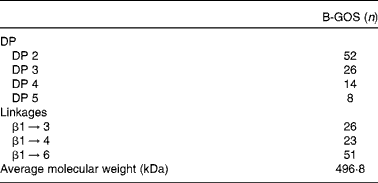
* The galacto-oligosaccharide content of B-GOS was 48 % (w:w).
Diet diary analysis
Habitual diet of volunteers was assessed by pre-validated, 4-d food diaries (two weekends and two weekdays) before the beginning of the study and once during each intervention period. Information collected in the food diaries was analysed using a nutritional software package (Dietplan 6; Forestfield Software Limited).
Preparation and collection of faecal samples
Faecal samples were collected, diluted, homogenised and used to enumerate gut bacteria by fluorescent in situ hybridisation, as described previously( Reference Vulevic, Juric and Tzortzis 18 ). A portion of each faecal sample was removed before dilution and freeze-dried to determine dry weight and for NMR-based metabolite analyses.
Bacterial enumeration using fluorescent in situ hybridisation
Differences in bacterial populations were assessed using fluorescent in situ hybridisation analysis with oligonucleotide probes designed to target specific diagnostic regions of 16S rRNA, as previously described( Reference Vulevic, Juric and Tzortzis 18 ). The probes used were Bif164( Reference Langendijk, Schut and Jansen 21 ), Bac303( Reference Manz, Amann and Ludwig 22 ), Chis150( Reference Franks, Harmsen and Raangs 23 ), Lab158( Reference Harmsen, Elfferich and Schut 24 ), Erec482( Reference Franks, Harmsen and Raangs 23 ), Ato291( Reference Harmsen, Wildeboer-Veloo and Grijpstra 25 ), Eco1531( Reference Poulsen, Lan and Kristensen 26 ), Fprau 645( Reference Suau, Rochet and Sghir 27 ), Rrec 584( Reference Walker, Duncan and Leitch 28 ), Dsv 687( Reference Devereux, Kane and Winfrey 29 ), specific for Bifidobacterium spp., Bacteroides–Prevotella group, Clostridium histolyticum–Clostridium perfringens group, Lactobacillus–Enterococcus group, Eubacterium rectale–Clostridium coccoides group, Atopobium–Coriobacterium group, Escherichia coli, F. prausnitzii spp., Roseburia–E. rectale group and Desulfovibrio spp., respectively. Total bacterial counts were determined using the Eub338 probe mix( Reference Daims, Bruhl and Amann 30 ), targeting all organisms in the domain bacteria. The number of cells obtained is expressed as per gram of dry weight faeces.
Peripheral blood mononuclear cell preparation
Blood (30 ml) was collected into sodium heparin-coated tubes and layered over lymphocyte separation medium at a ratio of 1:1 (Lympholyte®-H; Cedarlane Laboratories). The layered blood was centrifuged for 15 min (640 g, 20°C, brake-off) and plasma collected for cytokine analysis. Peripheral blood mononuclear cells (PBMC) were removed, washed with sterile PBS and centrifuged for 10 min at 360 g, 20°C, low brake. The supernatant was then discarded and cells centrifuged for 10 min at 360 g, 20°C, low brake and washed once again, to minimise erythrocyte contamination, before final resuspension for analysis of either cytokine or NK cell activities.
Natural killer cell activity
NK cell activity, against cell line K562 target cells, was determined by an lactate dehydrogenase (LDH) cytotoxicity detection kit (Clontech), assessing the release of cellular LDH following target cell lysis. PBMC were resuspended in Roswell Park Memorial Institute (RPMI) medium supplemented with glutamine (2 mmol/l) and penicillin–streptomycin (1 % by vol.). K562 cells were washed three times and resuspended in RPMI medium supplemented with bovine serum albumin (1 % by vol.) and penicillin–streptomycin (1 % by vol.). PBMC (1 × 10⁷ cells/ml) and K562 cells (2 × 10⁵ cells/ml) were added to each well of a ninety-six-well microtitre plate to give ratios of PBMC to K562 cells of 100:1 or 50:1. Spontaneous release of LDH by PBMC was assessed by incubating PBMC in the absence of K562 target cells. Release of LDH by K562 cells was determined by incubating the target cells in the absence of effector cells (i.e. PBMC). Maximal target cell lysis was determined by incubating K562 target cells with lysing reagent (Triton X-100). The plates were centrifuged (3 min, 100 g) and then incubated at 37°C in an atmosphere of air to CO2 (19:1) for 4 h. Following this incubation, 50 μl of ice-cold RPMI-supplemented medium was added to each well, and the plate centrifuged at 400 g for 5 min. Supernatant fluid (100 μl) from each well was removed and transferred onto the wells of a flat-bottomed ninety-six-well plate. The activity of LDH in these supernatant fluids was calorimetrically assayed according to instructions provided by Clontech. The following equation was used to calculate the percentage of cytolysis:
 $$\begin{eqnarray} \%\,Cytolysis = (LDH\,release - PBMC\,spontaneous\,LDH\,release - K562\hairsp cell\,spontaneous\,LDH\,release)/(maximum - K562\hairsp cell\,LDH\,release - K562\hairsp cell\,spontaneous\,LDH\,release)\times 100. \end{eqnarray}$$
Cytokine production
PBMC (2 × 10⁶ cells/ml), prepared as described above, were resuspended in RPMI-supplemented medium supplemented with autologous plasma (5 % by vol.). Cells were then dispensed onto a twenty-four-well plate in the presence of lipopolysaccharide (10 × μg/ml) and concanavalin A (50 × μg/ml) stimulating cytokine production and RPMI-supplemented medium (acting as a control). The plated cells were incubated at 37°C in an atmosphere of air to CO2 (19:1) for 24 h. Following incubation, the plate was centrifuged at 400 g for 5–6 min, supernatant fluids were collected and frozen in aliquots (200 μl) at − 20°C. Concentrations of cytokines (IL-6, IL-10, IL-1β, TNF-α and IL-8) were measured by a commercially available multi-analyte profiling kit (R&D Systems, Inc.) according to manufacturer's instructions. The limit of detection for these assays were as follows: IL-6, 0·36 pg/ml; IL-10, 0·13 pg/ml; IL-1β, 0·27 pg/ml; TNF-α, 0·60 pg/ml; and IL-8, 0·39 pg/ml (data supplied by the manufacturer of the kits).
Analysis of calprotectin, C-reactive protein and secretory IgA
Faecal calprotectin, a marker of intestinal inflammation (PhiCal Calprotectin ELISA kit, K 6930; BioSupply UK), plasma C-reactive protein (CRP) (AssayMax Human CRP ELISA kit, EC 1001–1; Universal Biologicals Cambridge) and faecal secretory IgA (sIgA) (sIgA ELISA Kit, K 8870; Oxford Biosystems) were all measured by ELISA using commercially available kits and instructions provided by the manufacturers. The limit of detection for these assays were as follows: calprotectin, 2·915 mg/l; CRP, < 100 ng/l; insulin, 3 pmol/l; and sIgA, 13·4 mg/l (data were supplied by manufacturers of the kits).
Metabolic profiling using 1H-NMR spectroscopy
Faecal samples were prepared by placing 100 mg of sample into 1·5 ml buffer (0·2 mol/l pH 7·4 sodium phosphate Na2HPO4, NaH2PO4), 3 mmol/l sodium azide (NaN3), 0·1 % (w/v) 3-(trimethylsilyl) propionic acid–d 4 all prepared in deuterium oxide 99·9 %/distilled water (D2O/H2O) 90:10). Samples were vortexed and homogenised for 10 min at 4°C. They were then centrifuged for 10 min (12 000 g) and 550 μl aliquots of supernatant collected to fill 5 mm NMR tubes. 1H-NMR spectroscopy was used to analyse low-molecular-weight metabolite profiles in faecal water at baseline and week 10 time points.
Statistical analysis
The impact of treatment, time, age, sex and those bacterial numbers that changed significantly with treatment type from baseline to week 10 (Bifidobacterium spp.) on metabolites was assessed. Bifidobacterium spp. data at week 10 were split into pentiles and the upper two and lower two pentiles tested against each other to compare both ends of the population and identify metabolic markers associated with high and low bifidobacterial containing patients. By using tail ends of the data distribution, the model tested differences between individuals with high and low bifidobacterial counts. Statistical tests were performed with the use of MATLAB version 8.0 (MathWorks, Inc.).
1H-NMR profiles were analysed using Orthogonal Projection on Latent Structures, where 1H-NMR data were used as independent variables (X matrix) and linearly regressed against bacterial colonisation values (Y matrix).
Identification of metabolites was achieved through two-dimensional NMR experiments (Correlation Spectroscopy; COSY), statistical analysis (statistical total correlation spectroscopy; STOCSY) and spectral databases( Reference Pence and Williams 31 , Reference Wishart, Tzur and Knox 32 ). Validity of each model was first evaluated based on three parameters: R 2 Y (goodness of fit), Q 2 Y (goodness of prediction estimated from cross-validation) and R 2 X (the percentage of data in X (i.e. NMR) necessary to build the model). The higher the R 2 Y and Q 2 Y values, the stronger the model; furthermore, if the difference between R 2 Y and Q 2 Y is too large, this indicates over-fitting of the model and poor predictive performance. Strong models are then validated against randomness by permutation tests (permutation tests were used to validate the models). These tests use random shuffles of the Y vector (1000 times) to generate the distribution of a test statistic under a null hypothesis. Ranking of the real test statistic among shuffled test statistics gives a P-value. The lower the P-value, the greater the statistical confidence of the model being unique and not randomly produced.
Statistical analysis
Using the statistical SAS 9.3, all outcomes (except metabolite profile analysis) were modelled on logarithmic base 10 scale using a linear mixed model for a cross-over with the addition of an extra random term for the subject effect (volunteer), as described previously( Reference Brown and Prescott 33 ). The fixed terms assessed in this model were baseline mean, baseline difference, age, sex, age × sex, interaction, period and treatment. The effect of visit and visit × treatment interaction was also assessed for those variables with more than one measure post-treatment, and the repeated nature of these outcomes was considered with unstructured covariance pattern. When the variance component attributable to subjects (volunteers) was negative, the hierarchical model was interpreted as a marginal model as described by Verbeke & Molenberghs( Reference Verbeke and Molenberghs 34 ). The pre-treatment measurement of each outcome was used as a baseline covariate( Reference Kenward and Roger 35 ). Individual P-values for treatment comparisons were adjusted using a step-down Bonferroni method, as described in Westfall et al. ( Reference Westfall, Tobias and Wolfinger 36 ). The reported P values in Tables 2–4 were those corrected for multiplicity, but the means are unadjusted. Carry-over effect was not assessed by statistical analysis as it was eliminated by the design( Reference Senn 37 ).
Bacterial populations of the monitored faecal microbiota throughout a placebo-controlled, double-blind, cross-over intervention study with galacto-oligosaccharide mixture (B-GOS) in elderly volunteers determined by fluorescent in situ hybridisation† (Unadjusted mean values with their pooled standard errors; n 40)

* Mean value was significantly different from placebo at the same time point (P< 0·05).
† Outcomes were analysed using a linear mixed model for a cross-over design, taking into the account repeated measures and controlling for the effect of baseline level, age, sex, age × sex interaction, period, treatment, visit and visit × treatment interaction. A step-down Bonferroni method was used for adjustments.
Effect of intervention with placebo and galacto-oligosaccharide mixture (B-GOS) on natural killer cell activity of peripheral blood mononuclear cells in elderly volunteers† (Unadjusted mean values with their pooled standard errors; n 40)
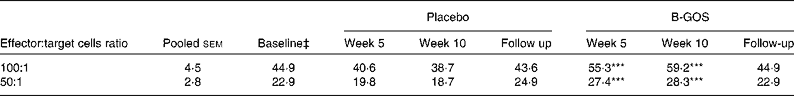
*** Mean value was significantly different from placebo at the same time point (P< 0·001).
† Outcomes were analysed using a linear mixed model for a cross-over design, taking into the account repeated measures and controlling for the effect of baseline level, age, sex, age × sex interaction, period, treatment, visit and visit × treatment interaction. A step-down Bonferroni method was used for adjustments.
‡ Mean of all volunteers at the beginning of the intervention period.
Effect of intervention with placebo and galacto-oligosaccharide mixture (B-GOS) on production of cytokines by peripheral blood mononuclear cells in elderly volunteers† (Unadjusted mean values with their pooled standard errors; n 10)
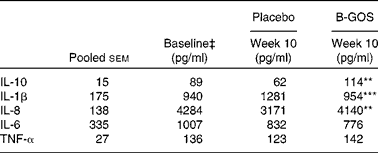
Mean value was significantly different from placebo at the same time point: ** P< 0·01, *** P< 0·001.
† Outcomes were analysed using a linear mixed model for a cross-over design and controlling for the effect of baseline level, age, sex, age × sex interaction, period and treatment. A step-down Bonferroni method was used for adjustments.
‡ Mean of all volunteers at the beginning of the intervention period.
Results
Effect of Bimuno–galacto-oligosaccharide mixture on bacterial populations
The faecal microbiota composition of the elderly volunteers who participated in the present study was determined by the use of fluorescent in situ hybridisation. We applied probes to enumerate principal groups of interest in the colonic microbiota.
There were no differences in populations of faecal bacteria in the two groups at the beginning of each intervention period (Table 2). The two dietary interventions had no significant effects on counts of Lactobacillus/Enterococcus spp., F. prausnitzii cluster, Roseburia/E. rectale group, C. coccoides/E. rectale group, C. histolyticum group, E. coli, Desulfovibrio spp. and total bacteria during the study. However, differences between interventions were observed with respect to numbers of bifidobacteria and bacteroides (P< 0·05) after 5 and 10 weeks of the study period and at the end of the follow-up (4 weeks after the end of interventions). That is, B-GOS increased the numbers of these bacteria in faeces (Table 2). The number of Atopobium cluster found in faecal samples was higher (P< 0·05) with B-GOS intervention than with placebo at follow-up.
Dietary intake and bowel habit following Bimuno–galacto-oligosaccharide mixture intervention
There were no significant effects of time or intervention on the bowel function, mood or dietary intakes (online Supplementary Tables S1 and S2).
Effect of Bimuno–galacto-oligosaccharide mixture on natural killer cell activity
NK cell activity measured at effector-to-target cell ratios of 100:1 and 50:1 did not differ significantly at baseline between the two dietary interventions (Table 3). After 5 and 10 weeks, B-GOS intervention resulted in significantly higher (P< 0·001) NK cell activity than placebo. Differences between interventions were not observed at follow-up (Table 3).
Effect of Bimuno–galacto-oligosaccharide mixture on cytokine production by peripheral blood mononuclear cells
Effects of treatments on the production of cytokines (IL-10, IL-1β, IL-8, IL-6 and TNF-α) are summarised in Table 4. There were no differences in the two groups at the beginning of each intervention period, and no differences were observed in the production of IL-6 and TNF-α during the study period. However, differences were observed in the production of other measured cytokines at the end of the intervention periods (10 weeks). The production of IL-10 (P< 0·01) and IL-8 (P< 0·01) was higher, while the production of IL-1β (P< 0·001) was lower, during the B-GOS period than during the placebo period (Table 4).
Faecal calprotectin, plasma C-reactive protein and faecal secretory IgA
There were no significant effects (data not shown) of time or intervention on the concentrations of faecal calprotectin and sIgA. However, the concentration of plasma CRP at the end of the intervention period (10 weeks) was significantly higher during the B-GOS period (59·4 (6·7) ng/ml) than during the placebo period (48·0 (sem 5·9) ng/ml) (P< 0·01). CRP values did not differ between the two groups at the beginning of each intervention period (57·3 (sem 6·5) ng/ml).
Effect of Bimuno–galacto-oligosaccharide mixture on the metabolic profile of faecal water
Elevated levels of Bifidobacterium spp. after 10 weeks of B-GOS treatment were associated with modulations in the faecal metabolic profile and enabled a robust model to be produced with good separation between high and low levels of Bifidobacterium spp. (Fig. 1; online Supplementary Fig. S1). The low P-value (0·013) obtained after random permutation indicated that the quality of the model was not due to randomness. Metabolic variations in this model associated with higher levels of Bifidobacterium spp. ( ≥ 10·12 log10 cells/g × dry weight factor) were characterised by a rise in lactate, glutamate, ornithine and caproic acid concentrations (Fig. 2).
Plot of the calculated scores (x-axis) against the cross-validated scores (y-axis) from the Orthogonal Projection on Latent Structures regression of faecal water metabolites on Bifidobacterium spp. in individuals after 10 weeks of B-GOS (Bimuno–galacto-oligosaccharides mixture) treatment. Model parameters: R
2
Y= 0·27. ![]() , Bifidobacterium spp. ≥ 10·12 (log10 cells/g × dry weight factor);
, Bifidobacterium spp. ≥ 10·12 (log10 cells/g × dry weight factor); ![]() , Bifidobacterium spp. ≤ 9·99 (log10 cells/g × dry weight factor). A colour version of this figure can be found online at http://www.journals.cambridge.org/bjn
, Bifidobacterium spp. ≤ 9·99 (log10 cells/g × dry weight factor). A colour version of this figure can be found online at http://www.journals.cambridge.org/bjn

Coefficient plot related to the discrimination between individuals with Bifidobacterium spp. ≤ 9·99 (log10 cells/g faeces (dry weight)) (bottom) and individuals with Bifidobacterium spp. ≥ 10·12 (log10 cells/g faeces (dry weight)) (top) after 10 weeks of B-GOS (Bimuno–galacto-oligosaccharides mixture) dietary intervention. Metabolites are colour coded according to their correlation coefficient, red indicating a strong positive correlation. The direction of the metabolite indicates the group with which it is positively associated. ppm, Parts per million. A colour version of this figure can be found online at http://www.journals.cambridge.org/bjn

Discussion
The effects of B-GOS intervention in an elderly cohort on the faecal microbiota, immune markers and metabolic profiles were investigated. A bifidogenic effect was observed, which was metabonomically linked to increased lactic acid levels. The immunomodulatory effect of B-GOS was also observed with differences in the activity of NK cells and production of some cytokines. These confirmed both the prebiotic nature of B-GOS and its positive potential in modulating the immune function of older individuals( Reference Vulevic, Drakoularakou and Yaqoob 17 ).
The exact mechanisms by which bifidobacteria exert their positive effects on the host are not fully understood. However, they are known to improve barrier function and thus reduce inflammatory compounds such as intestinal lipopolysaccharide (exposure to which can lead to metabolic endotoxaemia)( Reference Ohland and Macnaughton 38 ). They can also regulate the immune response because of their impact on T-cell regulation and subsequently the inflammatory response( Reference Claesson, Jeffery and Conde 39 , Reference Groeger, O'Mahony and Murphy 40 ). B-GOS was shown previously in ex vivo experiments to selectively promote the growth of B. bifidum and B. longum)( Reference Depeint, Tzortzis and Vulevic 16 ), two species reported to have good immunomodulatory properties( Reference de Vrese, Winkler and Rautenberg 41 , Reference de Vrese, Winkler and Rautenberg 42 ). Bifidobacteria also produce the SCFA acetate( Reference Palframan, Gibson and Rastall 43 ). Acetate has previously been seen to activate NK cells via GPR43 receptor sites( Reference Le Poul, Loison and Struyf 44 – Reference Ishizaka, Kikuchi and Tsujii 46 ) and to enhance the defence capability of gut epithelial cells( Reference Fukuda, Toh and Hase 47 ). While acetate levels were not observed to increase following intervention in the present study, it is possible that metabolic cross-feeding occurred; thus, the increased acetic acid levels were not reflected within the faeces. Faecal lactate, however, was observed to correlate with bifidogenic response following B-GOS intake, and its anti-pathogenic capability may offer some explanation for the general improvement in immune function( Reference Tejero-Sarinena, Barlow and Costabile 48 ). Potentially, the immune system may have been enhanced indirectly through other bifidobacterial end products of fermentation, which are readily absorbed by the body( Reference Cummings 49 , Reference Vogt and Wolever 50 ) and not detected in faecal water. Another possibility is a direct interaction and binding between the fractions of B-GOS and specific receptors on cells of the immune system. For example, low-molecular-weight fractions of B-GOS have been shown to have direct immune-modulating effect on murine macrophages and thus reduce colonisation and pathology of S. enterica serovar Typhimurium( Reference Searle, Jones and Tzortzis 51 ). Therefore, there are a number of different explanations and possibilities for the positive effects observed with B-GOS intervention in the present study.
The immune system undergoes profound age-related changes, including a gradual increase in production and circulation of inflammatory markers (e.g. IL-1β, IL-6 and TNF-α)( Reference O'Mahony, Holland and Jackson 52 , Reference Kiecolt-Glaser, Preacher and MacCallum 53 ). Previously, B-GOS was shown to reduce the production of these inflammatory cytokines while increasing the production of IL-10 (anti-inflammatory cytokine) and NK cell activity( Reference Vulevic, Drakoularakou and Yaqoob 17 ). Although, we did not observe significant effects on the production of IL-6 and TNF-α in the present study, production of IL-1β was lower and production of IL-10 was higher with B-GOS treatment than with the placebo. IL-8 is a neutrophil chemo-attractant and its spontaneous production in elderly is known to be lower than in younger adults( Reference Clark and Peterson 54 ). One of the suggested reasons for this is the defective functional activity of NK cells from older individuals, because NK cells spontaneously produce IL-8( Reference Mariani, Pulsatelli and Meneghetti 55 ). Since the activity of NK cells was increased with B-GOS treatment, this might be the reason for a higher production of IL-8 observed in the present study. Therefore, positive interaction with the immune system previously reported with administration of B-GOS to elderly persons was further corroborated here.
Further differences attributable to the B-GOS intervention included a significant increase in Bacteroides–Prevotella, a group that is not a typical prebiotic target, and increased CRP. Bacteroides are known to produce some end products (e.g. propionate) that are able to reduce pro-inflammatory responses, and their increases in faecal samples have been suggested as beneficial by some authors( Reference Vinolo, Rodrigues and Nachbar 56 ). However, since their numbers were maintained higher even at the follow-up, 4 weeks after the end of intervention period, it is possible that B-GOS intervention was not related to the observed effects. CRP is a known inflammatory marker associated with various infections, cancers and higher risks of developing cardiovascular or chronic inflammatory diseases, and thus its increase would not necessarily be seen as beneficial. However, values that are generally associated with negative effects in the host are above 10 mg/l( Reference Evrin, Nilsson and Oberg 57 ). In the present study, the mean values of all volunteers were more than 100 × lower than this, as such the apparent increase can be regarded as biologically insignificant.
Increased glutamate (precursor of ornithine) and ornithine levels were observed through metabonomic analysis. As B-GOS is not a source of protein, it is likely that these changes are associated with fluctuations in the volunteer's diets. When looking at the dietary data, there were no significant differences in protein consumption during any intervention periods. However, when correlating Bifidobacterium spp. levels with protein intake (from diet diary data), levels of protein consumption were higher in those with higher Bifidobacterium spp. levels (Fig. 3). This, therefore, indicates that metabonomic analysis enabled dietary changes to be picked up through metabolite changes. The use of metabonomics in the present study enabled links of prebiotic B-GOS immune function to be sought. While currently the main observations attributable to the intervention were increases in lactic acid, metabolic profiling has also offered useful insights into the confounding effect of diet on metabolites in such intervention studies.
Coefficient scatter plot related to Bifidobacterium spp. levels and protein intake (g) after 10 weeks of B-GOS (Bimuno–galacto-oligosaccharides mixture) treatment. A colour version of this figure can be found online at http://www.journals.cambridge.org/bjn

The present study has further strengthened the evidence for the beneficial modulation of the microbiota and immune function in older volunteers following the administration of B-GOS. A recent study of Maneerat et al. ( Reference Maneerat, Lehtinen and Childs 58 ) has shown that population aged over 60 years consuming a GOS supplementation did not experience any microbial or immunological changes. The GOS used was manufactured using an enzyme from Aspergillus oryzae. Another study has compared the effects on microbiota populations in younger adults between a GOS produced using enzymes from Bacillus circulans and B-GOS, a significantly greater bifidogenic effect was seen with the latter( Reference Depeint, Tzortzis and Vulevic 16 ). These studies have highlighted the importance of the source from which the enzyme used in GOS manufacture is extracted, because its origin determines the chemical structures of the GOS mixture and thus its level of selectivity and functionality. The key to B-GOS superiority v. other GOS products is the use of a specific probiotic (bifidobacterial) enzyme in its manufacture, rather than a generic enzyme, resulting in a unique oligosaccharide mixture. These structures make it highly selective towards bifidobacteria. The results also suggest that the effects of prebiotics cannot be generalised even within the same group (e.g. GOS) because, as these studies show, their functionality can be variable.
In conclusion, the present study showed that B-GOS administration to healthy elderly volunteers led to a significant increase in beneficial bifidobacteria. We also found significant positive effects on the immune response, evidenced by an improvement in NK cell activity, higher production of the anti-inflammatory cytokine IL-10, and lower production of IL-1β by stimulated PBMC. Therefore, dietary intervention that uses B-GOS as a prebiotic could be of importance in elderly as an attractive option for enhancement of both the microbial and immune systems.
Supplementary material
To view supplementary material for this article, please visit http://dx.doi.org/10.1017/S0007114515001889
Acknowledgements
The authors would like to thank the Statistical Services at the University of Reading for their work.
The present study was supported by Clasado Research Services. The funder was involved in the design of the study and in the writing of the article.
J. V. and G. T. are employed by Clasado Research Services. No other authors had personal or financial conflict of interest.
The authors' contributions are as follows: J. V., S. P. C., G. T. and G. R. G. designed the research; A. J., G. E. W., S. P. C. and R. E. T. conducted the research; J. V., G. E. W., S. P. C. and G. R. G. wrote the article.


