





Despite global public health guidelines and health promotion campaigns, diet remains the key modifiable risk factor for chronic diseases including obesity, type 2 diabetes, CVD and cancer(Reference Afshin, Sur and Fay1,2) . Public health recommendations to increase intake of plant-based foods that have documented benefits for human health(Reference Papadimitriou, Markozannes and Kanellopoulou3,Reference Schoeneck and Iggman4) remain unmet(5). Additionally, individuals consuming Western diets do not consume enough fibre, with 96 % in the UK(5) and 92 % in the USA(Reference Miketinas, Tucker and Patterson6) failing to meet national recommended intakes. Further, there is a lack of guidance around increased diversity of plant-based food consumption for the benefit of health, despite strong mechanistic rationale and promising evidence from observational studies(Reference Cooper, Sharp and Lentjes7–Reference Bhupathiraju, Wedick and Pan9). However, modifying dietary behaviour is challenging, particularly as a result of modern lifestyles and an obesogenic/unhealthy food environment, in which people typically have less time to prepare fresh foods(Reference Mc Morrow, Ludbrook and Macdiarmid10) and lack nutritional education(Reference Thiele, Mensink and Beitz11); therefore, there is a greater demand for convenient choices that are typically less healthy(Reference Seguin, Connor and Nelson12). There is an urgent need for simple dietary strategies aimed at improving health in the current food environment.
Global public health guidelines and research efforts to date have mainly focused on the health impact of the quantity of fruits, vegetables and wholegrains(2,13) . Increasingly, dietary patterns shown to improve health outcomes are reported to do so in part by modulating intestinal microbial communities(Reference Ghosh, Rampelli and Jeffery14,Reference Wastyk, Fragiadakis and Perelman15) . These diets are rich in prebiotic compounds (fermentable fibre, (poly)phenols) and foods containing probiotic bacteria and live micro-organisms such as yeasts (fermented foods) with both primarily derived from plant-based food ingredients. Prebiotics are defined as any substrate that is selectively utilised by host micro-organisms conferring a health benefit(Reference Gibson, Hutkins and Sanders16), while probiotics are defined as live micro-organisms which when administered in adequate amounts confer a health benefit on the host(Reference Hill, Guarner and Reid17). Both prebiotics and probiotics can be administered in supplement form; however, their introduction into the diet in foods in which they are naturally present has the combined benefit of provision of additional plant-based micronutrients, proteins and bio-actives (e.g. (poly)phenols and other phytochemicals) while preserving the food matrix and micronutrient synergies that exist in whole foods(Reference Miller, Ragalie-Carr and Torres-Gonzalez18).
The relationship between diet, the gut microbiome and human health is well documented in observational cohort studies(Reference Wang, Nguyen and Li19,Reference Asnicar, Berry and Valdes20) . Dietary intake influences both the composition and diversity of the human gut microbial communities(Reference David, Maurice and Carmody21), and in turn these communities and their metabolites contribute towards physiological processes involved in both health and disease states(Reference Zheng, Liwinski and Elinav22–Reference Koh, De Vadder and Kovatcheva-Datchary25). Extensive research in this area has led to the establishment of the gut bacteria as a key mediator in the impact of diet on health and disease processes(Reference Vijay and Valdes26). Plant-based diets and increased intakes of plant food groups, such as wholegrains, have been shown to modulate gut microbiome composition resulting in positive health outcomes in both healthy adults(Reference Foerster, Maskarinec and Reichardt27) and those at increased risk of adverse cardiometabolic health(Reference Haro, Montes-Borrego and Rangel-Zúñiga28,Reference Meslier, Laiola and Roager29) . While causal links between the gut microbiome and diet-related disease continue to be investigated, it is clear that dietary interventions targeting the microbiome have potential to influence the development and treatment of diet-related disease and the maintenance of health throughout the life course(Reference Thriene and Michels30).
Advances in our knowledge and understanding of the gut microbiome has highlighted plant-based diversity as an additional mechanism behind the biological impact of plants on human health(Reference Asnicar, Berry and Valdes20,Reference McDonald, Hyde and Debelius31) . Edible plants and the health benefits they provide extend beyond fruits and vegetables to include legumes, wholegrains, nuts and seeds, herbs and spices. Consuming a diverse range of plant foods has a strong mechanistic rationale for improving health. Greater plant diversity ensures consumption of a wide distribution of micronutrients and exposure to a greater range of diverse fibres and (poly)phenols that impact gastrointestinal and cardiometabolic health in different ways(Reference Gill, Rossi and Bajka32). A growing body of observational evidence indicates a link between diversity of plant food consumption and the gut microbial community(Reference Asnicar, Berry and Valdes20,Reference McDonald, Hyde and Debelius31) . Mechanisms by which diet-related changes in gut microbiota diversity and composition contribute to metabolic health and chronic cardiometabolic disease processes indicate plant diversity as a promising target for diet-related health improvement(Reference Fan and Pedersen33,Reference Wang and Zhao34) .
While a growing number of food products are enriched with fibre, or additional nutrients targeting gut microbiome composition and health, few do so using a wide diversity of whole plant foods. Therefore, to address the lack of simple fibre-rich and plant diverse dietary strategies, that are minimally processed and target gut microbiome and associated health outcomes, we designed a diverse whole-food plant blend (30+ plant blend) intended for consumption by the general population. The blend combines more than thirty whole plant ingredients chosen based on their content of diverse fibres and prebiotic substrates (online Supplementary Table 1; ingredients include fruits/vegetables (n 6), mushrooms (n 8), herbs (n 3), nuts (n 3), seeds (n 6), spices (n 2), wholegrains (n 2)), providing a range of micronutrients, unsaturated fats and (poly)phenols.
The ZOE BIOME (Biotics Influence On Microbiome Ecosystem) study investigated the effect of this diverse whole-food plant blend on both chronic and postprandial health outcomes in healthy adults. In a 6-week, parallel design randomised controlled trial (RCT; Figure 1(a)), we tested the hypothesis that the 30+ plant blend will improve gut microbiome composition (primary) and metabolic health (secondary) in comparison to a functional control. To further investigate the efficacy of the intervention on microbiome and health outcomes, we included an active control arm (single-strain probiotic containing Lacticaseibacillus rhamnosus GG) to test the hypothesis that the 30+ plant blend will improve microbiome composition and metabolic health in comparison to a probiotic supplement. Finally, we conducted a sub-study in a subset of participants to elucidate the postprandial health effects of the 30+ plant blend on glycaemia and subjective hunger and satiety responses (Figure 1(b)).
ZOE BIOME study design. (a) In the ZOE BIOME study, participants were randomly assigned to consume a 30+ plant blend (n 116; 30 g/d), a single-strain probiotic capsule (L.rhamnosus 15 billion CFU) (n 113; 1 capsule/d) or bread croutons (n 120; 28 g/d, isoenergetic functional control) for 6 weeks. Study outcomes were assessed using health questionnaires, 24-h dietary recalls, blood and stool samples collected at baseline and 6 weeks. (b) In the postprandial sub-study, a subset of participants who completed the control arm of the ZOE BIOME study were invited to take part in a randomised crossover design postprandial test meal challenge (n 34) in which they consumed a breakfast consisting of white bread and low fat spread (57 g carbohydrate) with or without the blend (30 g) in duplicate, separated by a 2-d washout period. Study outcomes were assessed using continuous glucose monitors (CGM), visual analogue scales and food records completed on each test day.

Figure 1. Long description
Panel A: The diagram shows the design of the ZOE BIOME study. It includes baseline measures taken at week 0, which involve collecting blood samples, stool samples, 24-hour diet recalls, and health questionnaires. Participants start treatment in week 1 and are divided into three groups: control (n = 120), 30+ plant blend (n = 116), and probiotic (n = 113). The intervention period lasts for weeks 1 to 6. Endpoint measures, similar to baseline measures, are taken at the end of the intervention period. Panel B: The diagram illustrates the design of the postprandial sub-study. It involves continuous glucose monitoring and measures hunger, satiety, mood, energy, and alertness at 0 minutes, 15 minutes, 1 hour, 2 hours, and 3 hours after consuming a test meal. The time of the next meal and food diary entries are also recorded.
Methods
Study design
The ZOE BIOME study was a 6-week parallel-group, RCT conducted exclusively remotely in the UK. In this free-living dietary intervention trial, participants were randomly assigned to receive one of three treatments: (i) a diverse whole-food plant blend, consisting of thirty primarily whole-food ingredients (vegetables, fruits, nuts, seeds herbs, spices, mushrooms and fungi) high in plant (poly)phenolic compounds, fibre and micronutrients known to exert prebiotic effects on the gut microbiome (online Supplementary Table 2); (ii) a single-strain probiotic containing Lacticaseibacillus rhamnosus GG, provided in capsule form (active control); or (iii) bread croutons, an energy-matched functional equivalent to the 30+ plant blend (functional control) (Figure 1(a)).
Participant selection and randomisation
Participants were healthy male and female adults reflective of the average UK population (aged 35–65 years; BMI 18·5–40 kg/m2; fibre intake < 20 g/d). Sex was determined using self-reported questionnaires with the following question, ‘Please enter your sex as it was assigned at birth’. Volunteers were excluded from the study if any of the following criteria applied: unable to provide written informed consent through an electronic consent form; unable or unwilling to comply to the study protocol; unwilling to complete study tasks on specified dates; did not complete the FFQ(Reference Bermingham, Linenberg and Francis35) at screening; had previously completed the ZOE personalised nutrition programme(Reference Bermingham, Linenberg and Polidori36); unwilling to consume study treatments; not based in the UK for the duration of the study; unable to eat the study treatments safely and comfortably (e.g. suffering from inflammatory bowel disease, coeliac disease, Crohn’s disease, irritable bowel syndrome, allergies or intolerances, chronic constipation or chronic diarrhoea); BMI of < 18·5 kg/m2 or > 40 kg/m2; following a non-omnivore diet (i.e. vegan and vegetarian); high fermented food intake in the previous month (≥ 7 servings per week); fibre intake ≥ 20 g/d in the previous month (estimated from FFQ); treatment with medication or products that may impact study outcome measures in the previous 3 months (e.g. antibiotics, non-topical steroids or other immunosuppressive medicines, biologics, probiotics/prebiotics, metformin, chronic use of non-steroidal anti-inflammatory drugs); use of opiate pain medicine for 8 or more days during the previous 3 months; use of proton pump inhibitors for 8 or more days during the previous 3 months; current smoker; suffered from a heart attack, stroke or major surgery in previous 2 months; received treatment for cancer in the previous 3 months; were pregnant, breast-feeding or planning pregnancy; were suffering from an eating disorder and type 1 or type 2 diabetes mellitus. Participants were recruited to the trial between 12 January and 16 February 2024 by electronic advertisement via emails to the ZOE health studies mailing list and ZOE product waitlist. Interested volunteers were screened to assess eligibility against the trial inclusion and exclusion criteria in a two-part process. First, volunteers who responded to recruitment emails were invited to complete an online screening questionnaire and FFQ. If eligible according to the initial online screening, participants were enrolled in the study and provided electronic informed consent via email with study coordinators. Participants were randomly allocated (ratio 1:1:1) to one of the three treatment groups using a variance minimisation procedure(Reference Sella, Raz and Cohen Kadosh37), with sex (male; female), BMI (18·5–24·9 kg/m2; 25–40 kg/m2) and diet quality (Healthy Eating Index (HEI); 0–59; 60–100) as stratification variables. The probability of random assignment (pRand) was set to 0·1(Reference Sella, Raz and Cohen Kadosh37). Study coordinators performed randomisation and informed participants of their allocation to treatment via email. The second part of the screening process was conducted as a video welcome call, during which eligibility criteria from the first screening were verified and if participants were identified as not meeting eligibility at this second screening, they were excluded prior to baseline tasks. In addition, study coordinators explained trial procedures. Complete blinding of participants to the intervention was not possible due to the nature of the test meals (whole foods, for which a placebo that is void of nutrients/properties of interest, but physically similar, is not possible to create). On participant facing materials, we did not indicate which treatment was the intervention of interest, in an attempt to blind participants to the intent of the trial(Reference Tien, Hockey and So38). Study coordinators were unblinded to the participant’s randomised group due to the nature of the study (a remote dietary intervention trial). Analysts were blinded to the treatment group for the duration of statistical analysis, by re-coding the treatment groups as groups 1–3.
Treatments
The nutrient composition of the 30+ plant blend and control food is included in online Supplementary Table 3, with full details of the (poly)phenol and micronutrient content of the 30+ plant blend presented in online Supplementary Tables 4 and 5, respectively. The intervention group received the 30+ plant blend (Daily30+; made for ZOE Ltd, UK by Indi Supplements, UK; 30 g/d, equivalent to 2 scoops) for 6 weeks (online Supplementary Figure 1). The ingredients composition of the 30+ plant blend is provided in online Supplementary Table 2, along with manufacturing details. When the blend is manufactured, ingredients (wet, dry and powdered) are combined in a stepwise manner to ensure a consistent distribution of ingredient presence between scoops. Quality control of the product was independently assessed (Campden BRI) by testing consistency of a nutrient (copper) between batches (CV = 7·3 %). To ensure ingredients between scoops were adequately distributed, variability within a bag was also assessed, that is, three scoops from one bag were tested (CV = 7·5 %). The 30+ plant blend was provided in generic, unbranded packaging with a label listing major allergens. The intervention is a commercially available product with a proprietary formulation for which quantitative ingredient-level composition is not publicly disclosed; however, study replication is not limited, as the product can be obtained commercially and the ingredients, functional form, dose and mode of administration are fully specified. Participants were instructed to consume the treatment by adding it to meals as part of their usual diet. The active control group received a single-strain probiotic containing Lacticaseibacillus rhamnosus GG (Culturelle®, Connecticut USA; 15bn CFU/d), provided in capsule form and were instructed to consume one capsule daily for 6 weeks. L. rhamnosus was selected as an active control due to its established safety, suitability for remote trial designs and consistent evidence of gut microbiota modulation in healthy adults, including demonstrated taxonomic shifts following supplementation in an RCT(Reference Gai, Dong and Xu39–Reference Vázquez-Castellanos, Maciel and Wauters41). The probiotic was provided in its original packaging with a label listing major allergens covering the front of the package. The functional control group received bread croutons (Tesco Olive Oil and Sea Salt Croutons), an energy-matched functional equivalent to the 30+ plant blend. The croutons were provided in original packaging with a label listing major allergens covering the ingredient and nutrition information on the back of the packaging. Participants were instructed to consume croutons (28 g/d) for 6 weeks by adding them to meals throughout the day.
Procedures
The study design is summarised in Figure 1(a). Participants received a study kit via postal delivery containing materials necessary for completing study measurements prior to baseline (week 0) and endpoint (beginning of week 7). All procedures were conducted by participants in their homes. The ZOE BIOME chronic intervention was conducted between 26 February and 22 April 2024.
Baseline week (week 0)
Health questionnaires
Participants completed health questionnaires administered through an online survey (www.typeform.com; www.surveymonkey.com) for collection of baseline and covariate data including subjective ratings of hunger, energy and mood, gastrointestinal symptoms, anthropometric measurements (waist circumference, body weight and height), stool frequency and consistency, sleep (quality and quantity) and physical activity. Unless otherwise specified, all questionnaires were completed on a single occasion at the specified time point (i.e. baseline, endpoint).
Dietary intake
To capture habitual dietary intake, participants completed an online 24-h dietary recall (24-h recall; Intake24(Reference Foster, Lee and Imamura42)) on three specified days during the baseline week (2 weekdays and 1 weekend day). Participants were instructed not to report consumption of their assigned treatment via the 24-h recall to enable assessment of habitual intake only. Adherence to treatment was assessed as described below. The Intake24 tool prompts participants to list all food and drinks consumed the previous day (from midnight to midnight) using free text entry. Foods were then matched to equivalent items using food composition codes in the Intake24 database, the UK Nutrient Databank. Portion size was reported by participants by selection of a single portion size from a range of options accompanied by food photographs within the online questionnaire. Participants were asked to review their entered items and given the option to enter any further intake before submitting their recall.
Physical activity
To capture habitual physical activity, participants completed a single-item measure for the assessment of daily physical activity adapted from previous research(Reference Milton, Clemes and Bull43,Reference Craig, Marshall and Sjöström44) . Participants were asked ‘During the last week, what’s the total time you spent performing moderate-vigorous activities?’ with descriptive text ‘Moderate activities refer to activities that take moderate physical effort and make you breathe somewhat harder than normal. Think only about those physical activities that you did for at least 10 min at a time.’ and asked to provide a response in ‘hours per week’ which was then converted into minutes for the purpose of analysis.
Stool sample collection
Stool samples for microbiome analysis were collected by participants at home using the Zymo Research Corporation’s DNA/RNA ShieldTM Fecal Collection Tube (catalogue no. R1101; Zymo Research). The kit contained all the necessary materials for sample collection, along with detailed instructions for use. Immediately following collection, samples were stored by participants at room temperature until direct shipment to the analysing laboratory (Prebiomics s.r.l). Participants were instructed to ship the samples within 24 h of collection. The use of the preservation buffer maintains stability of DNA/RNA in faecal samples stored at ambient temperature (4–25°C) for up to 1 month. The DNA/RNA shield buffer is widely validated in independent studies for its efficacy in preserving microbial DNA/RNA in stool samples across multiple conditions(Reference Kazantseva, Malv and Kaleda45). Upon arrival at the Prebiomics laboratory, samples were stored at 4°C until analysis.
Blood sample collection
Blood samples for metabolomic analysis were collected by participants using the Nightingale Kit® for remote blood collection (Nightingale Health plc). Participants were instructed to fast overnight before completing the sample collection in line with kit instructions. Participants were provided with a nightingale dried blood spot (DBS) collection device, lancets, sterile alcohol wipe, gauze and bandages. First, participants cleaned their fingertip with the alcohol wipe provided; next, blood was drawn via finger prick on the fleshiest part of the fingertip. Participants were instructed to wipe away the first drop of blood to avoid contamination of the sample with residual alcohol from fingertip cleaning. Blood was collected into the red funnel of the Nightingale DBS collection device. A visual indicator on the device indicated to participants when sufficient blood had been collected. Upon completion, sample collection devices were stored in return pouches with desiccant (for sample preservation) and returned via prepaid postal envelope to a receiving laboratory in the UK within 12 h of collection. The samples were stored at –80°C upon receipt until shipping to the Nightingale Health laboratory for analysis (Nightingale Health Plc).
Participant monitoring and adherence
Participants confirmed completion of primary baseline study tasks via a survey administered at the end of week 0 and again following completion of endpoint tasks. Participants who did not report completion of tasks were contacted via telephone or email. Participants in all three arms were asked to self-report adherence to their allocated treatment by completing a questionnaire administered weekly throughout the study period with the following matrix question, ‘Please fill out the table below to tell us how much of your treatment you consumed each day over the past week’. For the 30+ plant blend group, participants were able to select one of the following answer options for each day of the week, ‘0 scoops, 1 scoop, 2 scoops, > 2 scoops for each day of the week’ (1 scoop = 15 g; full treatment dose was 2 scoops = 30 g/d). For the capsule group, participants were able to select one of the following answer options for each day of the week, ‘0 capsules, 1 capsule, > 1 capsule for each day of the week’ (full treatment dose was 1 capsule = 15 bn CFU/d). For the control group, participants were first asked if they weighed or counted their croutons before being able to select one of the following answer options for each day of the week, ‘0 croutons, 1 crouton, 2 croutons, …22 croutons, > 22 croutons’ or ‘0 grams, 1 gram, 2 grams,…, 28 grams, > 28 grams’ (full treatment dose was 28 g/d). Participants were instructed to maintain their habitual diet during the study; adherence to this instruction was evaluated through 24-h recalls completed at baseline and endpoint.
Endpoint measures (week 7)
Endpoint data collection was completed in the 7th week of the study, at which point both groups had consumed their allocated treatments for 6 weeks. All participants completed endpoint measures, including health questionnaires, 24-h recall, blood sample and stool sample collection as outlined in the baseline week section above. An additional question was asked at the endpoint only to assess skin improvement.
Primary outcome measure
The primary outcome of the study was the change in microbiome composition from baseline to the 6-week endpoint, derived from metagenomic analysis of stool samples. The primary outcome measure was based on the bacterial species previously identified in the ‘ZOE Microbiome Health Ranking 2025’ (ZOE MB health rank)(Reference Asnicar, Manghi and Fackelmann46). In brief, the ZOE MB health rank is a ranking for 661 microbial species that were previously identified in > 34 000 healthy participants (USA/UK) and associated significantly with different health risk factors. The lowest ranking (closer to 0) species are the most positively associated with health markers and the highest ranking (closer to 1) species are most negatively associated. This ranking is publicly maintained and available to researchers to evaluate whether a given human gut microbiome sample is characterised by more favourable or unfavourable health-associated species. Independent validation and generalisation of the ranking has been reported using publicly available datasets and demonstrated the relevance of the species rankings towards additional conditions and diseases not evaluated in the original populations(Reference Asnicar, Manghi and Fackelmann46).
Secondary outcome measures
Secondary outcome measures were assessed at baseline and following 6 weeks of treatment (i.e. during week 7). Fasted dried blood samples were provided for metabolomic analysis of markers of lipid profile, fatty acids, glucose control and inflammation (full list of metabolites included in the analysis in online Supplementary Table 12 ) via high-throughput NMR metabolomics (Nightingale Health). Participants were asked to self-report anthropometric measures including body weight (kg; assessed using participants’ own scales) and waist circumference (cm) which was measured by participants using a measuring tape provided in their study kit. Gut symptoms were assessed using the gastrointestinal symptoms rating scale(Reference Kulich, Madisch and Pacini47). Frequency of bowel movements was assessed via a single question ‘On average, how often do you have a bowel movement?’ with the following response options: Once a week or less; Twice a week; Three or four times a week; Five or six times a week; Once a day; Twice a day; Three times a day; Four times a day; Five or more times a day. Stool consistency was assessed via the question ‘Among the seven choices shown in the image, which stool form is the most common/typical that you experience?’ and participants responded by indicating their most common stool consistency on the Bristol Stool Form Scale(Reference Lewis and Heaton48). Subjective feelings (hunger, energy, happiness and anxiety) were assessed via visual analogue scales (VAS) administered online (digital VAS) with a scale of 0–10(Reference Machado, Thompson and Brett49). Sleep quality was assessed via the question ‘During the last 7 days, how would you rate your sleep quality overall?’, adapted from a previously validated question(Reference Snyder, Cai and DeMuro50), while sleep quantity data were gathered via the question ‘During the last 7 days, how many hours of actual sleep did you get at night?’, with response options (h): Less than 5; 5–6; 6–7; 7–8; 8–9; 9–10; 10–11; 11–12; More than 12. Skin quality was determined using the question ‘If you experience acne, has it improved since starting the BIOME study?’ with the following response options: Yes; No; Unsure; Not applicable (endpoint only). Validated methods for the collection of subjective data were prioritised and used where feasible (gut symptoms(Reference Kulich, Madisch and Pacini47), stool consistency(Reference Lewis and Heaton48), subject ratings of hunger, energy, happiness and anxiety(Reference Stubbs, Hughes and Johnstone51–Reference Flint, Raben and Blundell54)). Due to the remote design of the trial, technical limitations with administering questionnaires via digital app and high user burden of outcome data collection, in some cases validated methods were used as a basis for data collection but may have been modified to facilitate the remote design of the trial (sleep quality(Reference Snyder, Cai and DeMuro50), sleep quantity and stool frequency).
Blood processing and metabolomic analysis
Samples not meeting quality requirements (device not closed, return pouch not closed or sample not sufficient for analysis) were not included in analysis. A total of 106 metabolites were quantified from blood samples; concentrations for 105 biomarkers were quantified as previously described for venous samples(Reference Soininen, Kangas and Würtz55,Reference Würtz, Kangas and Soininen56) . Briefly, approx. 375 mm^2 was taken from the membrane, placed into sodium phosphate buffer (38 mM, pH 7, 10% D2O, 0·04 % sodium 3-(trimethylsilyl) propionate-2,2,3,3-d4 and 0·02 % sodium azide) and shaken gently for 1 h. For each sample, 520 µl of the extract was transferred into a 5 mm NMR tube for the NMR analysis. For the 106th metabolite (HbA1c) concentration was determined using a Roche cobas c513 analyser with Tina-quant Haemoglobin A1c Third Generation assay. For the analysis, one 6 mm punch was taken from the membrane, placed into a haemolysing reagent (Roche Diagnostics GmbH) and incubated 30 min at room temperature. For each sample, 1 ml of haemolysate was processed in the analyser as per the standard protocol for haemolysate.
Faecal sampling and microbiome testing
DNA extraction and sequencing
DNA was isolated by using the DNeasy 96 PowerSoil Pro QIAcube HT Kit (Qiagen, #47021). The DNA was quantified by using the Quant-iT™ 1X dsDNA Assay Kits, BR (Life Technologies, #Q33267) in combination with the Varioskan LUX Microplate Reader (Thermo Fisher Scientific, #VL0000D0). The DNA was diluted in water for the following library preparation.
Library preparation and sequencing
The sequencing libraries were prepared with the Illumina DNA Prep, (M) Tagmentation (96 Samples, IPB) kit (Illumina, #20060059) in combination with the Illumina® DNA/RNA UD Indexes Set A, B, C, D, Tagmentation (96 Indexes, 96 Samples) (Cat. #20091654, #20091656, #20091658, #20091660), and the amplified libraries were purified with the double-sided bead purification procedure, as described by the Illumina protocol. Then, libraries’ concentration (ng/µl) were quantified with the Quant-iT™ 1X dsDNA Assay Kits, HS (Life Technologies, #Q33232) in combination with the Varioskan LUX Microplate Reader (Thermo Fisher Scientific, #VL0000D0). In addition, the bp length was evaluated by using the D5000 ScreenTape Assay (Agilent, #5067-5588/9) in combination with the TapeStation 4150 (Agilent Technologies, #G2992AA). By knowing both library concentration and bp length, it is possible to obtain the correct library volume to pool in the same tube in order to achieve optimal cluster density. The library pool was then quantified with the Qubit 1x dsDNA HS kit (Life Technologies, #Q33231) through the Qubit® 3.0 Fluorometer (Life Technologies, #Q33216) and the bp length was evaluated as described before. Finally, the library pools were sequenced using the NovaSeq X Plus platform (Illumina) at an average depth of 3·75 Gb per sample.
Metagenome quality control and preprocessing
All sequenced metagenomes were preprocessed using the pipeline implemented at https://github.com/SegataLab/preprocessing. Briefly, the pipeline consists of three steps: the first step involves read-level quality control and removes low-quality reads (Q < 20), too short reads (length < 75 bp) and reads with > 2 ambiguous nucleotides. The second step screens for contaminant DNA using Bowtie2 with the ‘--sensitive-local’ parameter, allowing confident removal of the phi X 174 Illumina spike-in and human-associated reads (hg19 reference human genome release). The last step consists in splitting and sorting the cleaned reads to create standard forward, reverse and unpaired reads output files for each metagenome (average: 35 ± 13 million reads per sample).
Microbiome taxonomic profiling
Species-level taxonomic profiling of microbiome samples was performed with MetaPhlAn 4(Reference Blanco-Míguez, Beghini and Cumbo57) using default parameters (‘--stat_q 0·2 --stat tavg_g -t rel_ab -x mpa_vJan21_CHOCOPhlAnSGB_202103’). MetaPhlAn 4 allows for the confident and robust identification of microbial species, leveraging a curated collection of 1·01 M prokaryotic reference and metagenome-assembled genomes, from which species-specific marker genes were defined. MetaPhlAn 4 taxonomic profiles were analysed to compare microbial compositions among participants and to compute α diversity indices, the number of detected species (‘observed richness’) and the number of detected species taking into account their relative abundance (‘Shannon’s Diversity Index’). Microbiome taxonomic profiles were also analysed to compare between microbiome samples dissimilarity (β-diversity) using the weighted-UniFrac measure.
Nutrient intake and diet quality
Daily habitual energy and macronutrient intakes were assessed by averaging the energy and macronutrient intakes from three consecutive 24-h dietary recalls at baseline and 6 weeks. Diet quality was assessed by applying the HEI(Reference Shams-White, Pannucci and Lerman58).
Sample size calculation
The chronic study was powered to detect changes in the primary outcome, which was based on the difference in relative abundances of selected microbiome species (sum of ‘favourable’ species, n 50; minus the sum of ‘unfavourable’ species, n 50) previously identified for their associations with health markers(Reference Asnicar, Manghi and Fackelmann46). The effect size (0·42) was calculated using proprietary data collected within the ZOE commercial product. Based on a two-sided significance level (α) of 0·05, with 85 % power, a sample size of 102 participants per group (306 participants in total) was calculated. An anticipated attrition rate of 20–25 % was applied based on rates in previous studies conducted by the research group, resulting in a total of 133 participants per group (399 participants in total).
Statistical analysis
Analysis was conducted using R Studio v2023.12.0 and Python v3.9.16 (package SciPy v1.11.4). Figures were created on GraphPad Prism Version 10.2.2. The statistical analysis plan was pre-registered on the Open Science Framework (https://osf.io/2nq58) prior to commencement of hypothesis testing.
Analysis of 6-week changes in primary and secondary outcomes were conducted on a modified intention-to-treat (ITT) cohort (n 349) and sub-groups for selected metabolomic markers and gastrointestinal symptoms. Briefly, the modified ITT cohort included participants according to their initially assigned groups at baseline, regardless of adherence to study protocol. Participants who withdrew consent, those with missing baseline information for the primary outcome or those with a protocol deviation concerning eligibility were excluded from the modified ITT cohort. Missing data were assumed to be completely missing at random, and no imputation was performed. Given the study population of healthy adults and the low likelihood that missingness was related to the intervention, this approach is considered appropriate in the absence of a universally accepted method for handling missing data(Reference Singhal and Rana59).
For the primary outcome (ZOE MB health rank), we assessed gut microbiome composition using species-level taxonomic profiles of participants with samples available at baseline and 6 weeks (n 321). Microbiome analyses were restricted to participants with complete baseline and endpoint samples, as the primary outcome was defined based on within-individual change in species abundance, which cannot be robustly estimated using imputation or mixed models given the compositional, zero-inflated and non-normal nature of microbiome data. Within each group, we identified the prevalent species (at least 10 % at both time points, classified using species-level genome bins (SGB)) at baseline and 6 weeks post-interventions and then tested if the relative abundance values between the two time points were significantly different (paired Wilcoxon signed-rank test; false discovery rate (FDR)-adjusted q-values < 0·01). We then compared the number of species significantly changing (increasing or decreasing) from baseline to endpoint between groups (χ 2 test).
We then tested whether the ZOE MB health ranks of (a) significantly increasing species and (b) significantly decreasing species were significantly different between groups using Mann–Whitney U test with FDR correction (significant when q < 0·01). To further examine whether the species found to significantly change from baseline to 6 weeks were non-random across treatment groups, we selected species with a minimum prevalence of 10 % in each group and then retained only those with a q-value < 0·01 (FDR-adjusted). The species were then sorted by their log2-fold change, and individual-specific variations in the three treatment groups were presented. To compare the impact of the intervention and control treatments on species ranks across groups, a subject-specific ‘score’ based on ZOE MB health ranks was calculated at baseline and endpoint. Briefly, for each subject at each time point, the species-relative abundances were arcsin square-root transformed and multiplied by their respective health or diet ranks, scaled in the (–1; 1) range (with –1 for the most favourable and 1 for the most unfavourable species) and then summed up into one single value. To assess the microbiome enrichment in each subject, we computed the difference between the endpoint and baseline values, to produce a single change score.
Due to the highly personalised nature of the gut microbiome, and the presence of substantial inter-individual variability in composition(Reference Voigt, Costea and Kultima60,Reference Falony, Joossens and Vieira-Silva61) , which can reduce the sensitivity of between-group comparisons, we also conducted within-group analyses. We tested whether the median ranks of the significantly increasing species were significantly lower on the ZOE MB health rank (indicative of species associated with favourable health markers) compared with the ranks of the significantly decreasing species, within each group (Mann–Whitney U test). Ranks are presented in box plots as median and interquartile ranges (IQR). We repeated the analyses outlined above to determine the effect of the intervention on species previously identified for their association with favourable or unfavourable indices of diet quality, on the ‘ZOE Microbiome Diet Ranking 2025 (ZOE MB diet rank)(Reference Asnicar, Manghi and Fackelmann46).
As basic gut microbiome information, we calculated α-diversity (observed richness, Shannon’s diversity index) and β-diversity (weighted-UniFrac) metrics. For α-diversity measures, we assessed between- and within-group differences between baseline and 6 weeks using the Mann–Whitney U test and the paired Wilcoxon signed-rank test, respectively. For β-diversity, differences between groups at baseline and 6 weeks were assessed using PERMANOVA.
Secondary outcome data were assessed for normality by visual inspection of histograms and the Shapiro–Wilk statistic. If outcome data were not normally distributed, it was log10-transformed prior to analysis. To compare the effect of treatments on continuous outcomes (metabolites), a linear mixed-effects model was applied, with participant ID as a random effect, and time and the interaction between time (within-subject factor) and treatment (between-subject factor) as fixed effects(Reference Twisk, Bosman and Hoekstra62). Descriptive statistics are presented as mean and standard deviation for normally distributed variables, or geometric mean (95 % CI) for transformed variables. Changes in outcomes from baseline to 6 weeks are presented as mean (95 % CI). For ordinal variables (gut symptoms and stool consistency), or data that could not be normalised by transformation (anthropometric measures and subjective emotions), change between baseline and 6 weeks was assessed using the Mann–Whitney test and presented as median and IQR. Differences between groups in categorical outcomes (stool frequency, sleep quality and quantity and skin health) at 6 weeks were assessed using a χ 2 test and are presented as the number (n) and %. For sub-group analyses, methods were used as described above. Adherence to study instructions to maintain habitual background diet (energy and macronutrient intake) was assessed at baseline and endpoint via 24-h recall and compared between groups via an ANCOVA with baseline values as a covariate.
During primary outcome analysis, P-values were corrected for multiple hypotheses testing using the Benjamini–Hochberg FDR (q) where appropriate, considered significant when q < 0·01. Secondary outcomes were considered exploratory in nature; therefore, no adjustment for multiple comparisons was applied. For all tests, the significance level was set at P < 0·05 (two-tailed) or q < 0·01.
Postprandial sub-study
To test the acute health effects of the 30+ plant blend, we conducted a postprandial sub-study in a sub-group of participants (Figure 1(b)). Briefly, an exploratory, single-blinded, randomised two-phase crossover sub-study was conducted to assess the acute impact of the 30+ plant blend on postprandial glycaemia, appetite, mood, energy and subsequent food intake. Participants who completed the control arm of the 6-week ZOE BIOME trial were invited to take part, providing electronic informed consent prior to enrolment. Test meals consisted of a standardised high-carbohydrate breakfast consumed alone (control) or with the 30+ plant blend (intervention; online Supplementary Table 6). Participants consumed each test meal in duplicate over a 10-d period, with 2-d washout periods between test days. Continuous glucose monitoring was used to assess postprandial glucose responses, while subjective appetite, energy and mood were measured using VAS, and intake at the next meal was recorded via food diaries.
The primary outcome was the difference in peak postprandial glucose concentration (C-max) between the intervention and control test meals, with secondary outcomes including 2-h incremental AUC, time to peak glucose, glucose dips and time-course responses. Data were analysed using linear mixed-effects models accounting for meal type, sequence and participant-specific effects; non-parametric tests were applied where model assumptions were not met. The sub-study was powered to detect a clinically meaningful difference in C-max (n 40 participants, allowing for anticipated 15 % dropout). Due to its exploratory nature, detailed methodology, including randomisation, test meal composition, continuous glucose monitor procedures and full statistical approaches, are provided in online Supplementary Methods.
Results
Study participant characteristics
Between 26 February and 22 April 2024, 8017 volunteers were screened for initial eligibility, of which 399 participants were randomly assigned to the primary intervention (30+ plant blend; n 133), active control (probiotic capsule; n 133) or functional control (bread croutons; n 133) groups. Fifty participants did not meet the second eligibility screening following randomisation, resulting in 349 participants included in the modified ITT analysis set; summarised in the Consolidated Standards of Reporting Trials (CONSORT) diagram (Figure 2).
CONSORT diagram. CONSORT, Consolidated Standards of Reporting Trials.

At baseline, there were no significant differences in participant characteristics between groups (Table 1). Participants had a median age of 51·4 years (IQR 12·35), a median BMI of 25·9 kg/m2 (IQR 5·9) and 75 % (n 263) were female. Diet quality was within population ranges (mean HEI 69·0, sd 8·6), and participants reported 135 min (IQR 180) of moderate-to-vigorous physical activity per week. Participants fell within the inclusion criteria for daily intake of fibre (median 16·4 g/d (IQR 5·3)) and fermented foods (median 0·3 servings (IQR 0·4)). There were no significant differences between groups (30+ plant blend v. control; 30+ plant blend v. probiotic) for age, sex, physical activity or HEI calculated from the FFQ at screening (P > 0·05 for all).
ZOE BIOME study participant disposition

IQR, interquartile range; HEI, Healthy Eating Index.
Data are n, % unless otherwise stated.
*Data are mean (sd); †Data are median (IQR).
No significant difference between the 30+ plant blend v. control, or 30+ plant blend v. probiotic. Physical activity is self-reported minutes of moderate-to-vigorous intensity activity per week. Habitual diet quality was assessed by HEI (calculated from FFQ (36) completed by participants at screening).
Adherence to treatment and habitual diet
Self-reported adherence to assigned treatments in the modified ITT cohort (n 341; n 8 missing data from all weekly questionnaires) was high overall (98·8 %) and across groups; 30+ plant blend (98·1 %), probiotic (99·2 %) and control (99·2 %). Participants were instructed to maintain a habitual background diet, monitored by completion of 24-h dietary recalls at baseline and 6 weeks. Participants in the 30+ plant blend group had marginally greater energy intake from total sugar (mean (sd); 16 % (sd 7 %)) in comparison to the probiotic group (15 % (sd 5 %); P = 0·038, ANCOVA with baseline values as covariate). There were no other differences in energy or macronutrient intake between groups (online Supplementary Table 7). HEI was calculated from 24-h recalls (independent of intervention foods), and there were no significant difference (ANCOVA with baseline values as covariate) between the 30+ plant blend (Δbase-end = −1, 95 % CI −4, 2) and control (Δbase-end = −3, 95 % CI −2, 0; P = 0·94), or 30+ plant blend and probiotic (Δbase-end = −5, 95 % CI −7, −2; P = 0·23) at the endpoint.
Safety
Adverse events were reported to the study coordinator and reviewed by the principal investigator and medical director. All adverse events were documented in line with the guidance set by the relevant research ethics committee. Adverse events were classified as related if they were attributed to a study procedure (e.g. feeling faint during blood collection), to the treatment (e.g. gastrointestinal symptoms such as stomach discomfort, gas, nausea, vomiting or diarrhoea), resolved upon withdrawal or were otherwise considered related by the investigators. No serious adverse events were reported. Six related adverse events occurred during the chronic study. Two of these resulted in withdrawal of participants from the study: one participant in the 30+ plant blend group reported vomiting during week 2 and a second participant reported a skin rash during week 4. Symptoms resolved following withdrawal. The remaining four adverse events included two reports of dysgeusia (probiotic group n 1; control group n 1), one instance of headache and restlessness (probiotic group n 1) and one instance of a broken tooth filling (30+ plant blend group n 1); in these cases, participants chose to remain on the study.
In the postprandial study, no serious adverse events were reported. Two unrelated occurred: in one instance, a participant was diagnosed with appendicitis and withdrew from the study as they were subsequently unable to comply with consumption of the test meals. In the second instance, a participant reported flu-like symptoms that persisted for several days before resolving. This participant chose to remain in the study.
Microbiome analysis
In the modified ITT cohort, there was a significant difference between groups in the number of species significantly changing (relative abundance) from baseline to 6 weeks for both the primary comparison (30+ plant blend v. control; n 57 v. n 14 SGB, P < 0·001; χ 2 test) and the secondary comparison (30+ plant blend v. probiotic; n 57 v. n 4 SGB, P < 0·001; χ 2 test; Table 2). Relative abundance, prevalence, the log2 fold change of the relative abundance and ZOE MB health and diet ranks of species that significantly changed between baseline and endpoint are presented in online Supplementary Table 8 and Supplementary Figure 2. Of these significantly changing species, we then distinguished them according to whether they increased or decreased their relative abundance at 6 weeks and tested whether the significantly increasing (or decreasing) species had significantly different rankings in terms of the ZOE MB health ranks(Reference Asnicar, Manghi and Fackelmann46). Rank values closer to 0 are indicative of ‘favourable’ species associated with better health outcomes, while ranks closer to 1 indicate ‘unfavourable’ species associated with poorer health outcomes. There were no significant differences between groups in the ZOE MB health ranks for significantly increasing or decreasing species, for either the primary or secondary comparisons (Table 2).
Microbiome outcomes in the ZOE BIOME study

Table 2. Long description
The table presents microbiome outcomes across three groups: 30+ plant blend, probiotic, and control. It includes data on significantly changing species, richness, Shannon’s index, and ZOE Microbiome Health and Diet Ranks. The table has 10 rows and 14 columns. Column headers include ‘30+ plant blend’, ‘Probiotic’, ‘Control’, and ‘q-Values’. Row labels include ‘Significantly changing species (n)’, ‘Richness’, ‘Shannon’s index’, ‘ZOE Microbiome Health Rank’, and ‘ZOE Microbiome Diet Rank’. Each group has data for Baseline, Endpoint, and Δ baseline-end. Notable trends include significant changes in species for the 30+ plant blend group compared to the control and probiotic groups. The q-Values indicate statistical significance for these comparisons.
IQR, interquartile range; FDR, false discovery rate.
*Values are the number of species (n) with a significant change (increase or decrease) in relative abundance from baseline to endpoint in each group. P-values are a result of a χ 2 test.
†Values are median and IQR; q-values are a result of a Mann–Whitney U test on median change from baseline values, with FDR correction (significant when q < 0·01).
‡Values are median and IQR; q-values are a result of a Mann–Whitney U test on median ranks of species with a significant change in relative abundance from baseline to endpoint, with FDR correction (significant when q < 0·01). 30+ plant blend, n 106; Probiotic, n 106; Control, n 109. p-values or q-values in bold represent a significant difference between groups.
To further explore the impact of the 30+ plant blend on the highly personalised gut microbiome, we conducted within-group analyses (online Supplementary Figure 3) to address the specific aims of the current study, which were conducted independently from similar analyses previously published elsewhere(Reference Asnicar, Manghi and Fackelmann46). Briefly, in the 30+ plant blend group, the species with increased relative abundance at 6 weeks showed significantly more favourable ZOE MB health ranks (lower median rank) than the decreasing species (median rank (increasing v. decreasing) 0·408 v. 0·659, P = 0·007; Mann–Whitney U test; online Supplementary Figure 3a, c). This indicates that the 30+ plant blend modified the ZOE MB health rank of participants by increasing more favourably ranked species in comparison to decreasing species. There were no significant differences in the ZOE MB health rank for the species changing in the probiotic group (median rank (increasing v. decreasing) 0·694 v. 0·604; P = 0·500) or in the control group (median rank (increasing v. decreasing) 0·519 v. 0·604; P = 0·555) (online Supplementary Figure 3a).
As well as the distributions changing in the 30+ plant blend arm, the significantly changing species had different prevalence patterns over time. Increasing (generally ‘favourable’) species maintained or increased their prevalence (from 74·1 % to 76·9 % median prevalence, Wilcoxon paired test P = 0·001), while decreasing generally ‘unfavourable’ species became undetectable in many individuals (from 61·3 % to 44·3 % median prevalence, Wilcoxon paired test P < 0·001) (online Supplementary Figure 3d).
Similarly, to explore the effect of the interventions on microbiome species associated with markers of diet quality, we evaluated the identified significant species according to their ZOE MB diet ranks(Reference Asnicar, Manghi and Fackelmann46). There were no significant differences between groups in the ZOE MB diet ranks for significantly increasing or decreasing species, for either the primary or secondary comparisons (Table 2). In the within-group analyses, the species with increased relative abundance showed significantly more favourable ZOE MB diet ranks than the decreasing species in the 30+ plant blend group (median rank 0·323 v. 0·686, P < 0·001; Mann–Whitney U test; online Supplementary 3b). There were no significant differences in the ZOE MB diet rank for the species changing in the probiotic group (0·410 v. 0·641; P = 1·00) or the control group (0·410 v. 0·546; P = 0·55) (online Supplementary Figure 3b).
A subject specific change score based on species ranks (ZOE MB health and diet) was also compared across groups (online Supplementary Figure 4a). There was a significant difference in the ZOE MB diet rank score only in the 30+ plant blend group in comparison to both the probiotic (Mann–Whitney U test; P = 0·002) and control (P < 0·001) groups. Although no causal relationship can be inferred between the ZOE MB ranks and cardiometabolic health, this analysis functions as a proxy measure indicating a shift to a microbiome composition that is associated with favourable dietary health markers.
To assess the similarity within and between different gut microbiome samples (α and β diversities, respectively), we calculated the species richness and Shannon’s diversity indexes, and the weighted-UniFrac and Bray–Curtis pairwise similarities. The weighted-UniFrac did not show separation between the baseline microbiome composition across the three groups (PERMANOVA P = 0·584), while endpoint microbiome compositions showed significant differences (PERMANOVA P = 0·020). PERMANOVA analysis performed within each group, comparing baseline with endpoint microbiome composition, showed significant differences only for the 30+ plant blend group (30+ plant blend P = 0·030, probiotic P = 0·327 and control P = 0·059) (online Supplementary Figure 4b). For α diversity, there was a significant difference in change in richness (30+ plant blend v. control) at 6 weeks (median change –9·50 v. 7·00, q = 0·007; Mann–Whitney U test). There were no other significant differences between groups for α diversity indices (Table 2). Exploratory analyses of within-group changes in α diversity were conducted and are presented in online Supplementary Figure 4c.
Finally as a secondary measure of adherence, we investigated the presence of the probiotic L. rhamnosus across the groups at baseline and 6 weeks. As expected, only the probiotic group showed a significantly larger number of individuals from which we were able to identify L. rhamnosus in their gut microbiome at 6 weeks compared with baseline (an increase from 5 to 58 participants, online Supplementary Figure 3e).
Secondary outcomes
Subjective measures
Hunger, energy and mood were assessed using VAS administered online (0–10; digital VAS), and gastrointestinal symptoms were assessed using the Gastrointestinal Symptom Rating Scale (GSRS)(Reference Kulich, Madisch and Pacini47) at baseline and 6 weeks (Table 3). For the primary comparison (30+ plant blend v. control), participants reported increased subjective feelings of energy (0·93, 95 % CI 0·57, 1·28 v. 0·01, 95 % CI –0·29, 0·30; P = 0·004) and happiness (0·30, 95 % CI 0·03, 0·57; v. –0·22, 95 % CI –0·48, 0·04; P = 0·020) and reduced severity of heartburn (–0·29, 95 % CI –0·42, –0·16 v. –0·05, 95 % CI –0·16, –0·05; P = 0·045), severity of constipation (–0·26, 95 % CI –0·37, –0·16 v. 0·02, 95 % CI –0·10, 0·14; P = 0·019) and severity of flatulence (–0·33, 95 % CI –0·49, –0·17 v. 0·05, 95 % CI –0·66, –0·31; P = 0·048) following the 30+ plant blend v. the control (online Supplementary Table 10; Figure 3). When assessed as symptom domains, there were reductions in severity of indigestion domain symptoms (–0·25, 95 % CI –0·34, –0·16 v. –0·04, 95 % CI –0·12, 0·04; P = 0·011), severity of constipation domain symptoms (–0·17, 95 % CI –0·25, –0·09 v. –0·01, 95 % CI –0·09, 0·12; P = 0·023) and overall symptoms (–0·16, 95 % CI –0·21, –0·12 v. –0·03, 95 % CI –0·09, 0·03; P = 0·018) following the 30+ plant blend v. the control (Table 3; Figure 3). As the effect sizes were small and of unclear clinical significance in this healthy cohort, we also explored the proportion of participants achieving an increase from baseline in subjective measures and found that a greater proportion of participants reported an increase from baseline in energy (50·5 % v. 37·3 %) and happiness (44·6 % v. 30 %) and a reduction from baseline in severity of indigestion domain symptoms (55·1 % v. 36·4 %), severity of constipation domain symptoms (34·6 % v. 24·5 %), severity of flatulence (37·4 % v. 23·6 %), severity of heartburn (17·8 % v. 11·8 %) and total gastrointestinal symptoms (69·2 % v. 56·4 %) following the 30+ plant blend v. the control. Stool frequency was significantly different following the 30+ plant blend in comparison to control at 6 weeks, with a smaller proportion of the 30+ plant blend group reporting stool frequencies of ‘Three or four times per week’ (3·5 %), v. control (14·2 %) (online Supplementary Table 9). There were no differences between the groups in self-reported sleep quality (online Supplementary Table 9). Anthropometric (self reported) measures (waist circumference and weight), stool consistency, acne, sleep quantity and remaining subjective emotions and gastrointestinal symptoms did not differ significantly between groups (Table 3; online Supplementary Table 9–10).
Selected secondary outcomes in the ZOE BIOME study

VAS, visual analogue scales (0–10).
Data were not normally distributed but are presented as mean (sd) or mean (95 % CI) to illustrate precise changes between the groups for each outcome (as median values did not indicate the direction); P-values are a result of a Mann–Whitney U test on median change from baseline values. p-values in bold represent a significant difference between groups.
Changes in selected secondary outcomes for the primary comparison (30+ plant blend v. control) in the ZOE BIOME study. (a–c) Changes in severity of individual gastrointestinal symptoms including heartburn (a), flatulence (b) and constipation (c) in the 30+ plant blend (n 107) and control (n 110) groups. (d–e) Changes in severity of gastrointestinal symptom domains including indigestion (d) and constipation (e) in the 30+ plant blend (n 107) and control (n 110) groups. (f) Changes in severity of total gastrointestinal symptoms in the 30+ plant blend (n 107) and control (n 110) groups. (g) Changes in subjective energy ratings (digital visual analogue scale, digital VAS; 0–10) from baseline to 6 weeks in the 30+ plant blend (n 107) and control (n 110) groups. Data presented are median (centre line), first and third quartile (box limits) and range (whiskers) for all. The mean value is also presented (+). P-values are the result of Mann–Whitney U tests (a–g) or Wilcoxon signed-rank test (h). 30+ plant blend (pink) and control (blue) for all.

Figure 3. Long description
Panel A: A box-and-whisker plot comparing changes in heartburn severity between the control group and the 30+ plant blend group. The horizontal axis represents the groups (Control and 30+ plant blend), and the vertical axis represents the change in heartburn severity from baseline. The median, quartiles, and range are shown for each group. The p-value is 0.045. Panel B: A box-and-whisker plot comparing changes in flatulence severity between the control group and the 30+ plant blend group. The horizontal axis represents the groups (Control and 30+ plant blend), and the vertical axis represents the change in flatulence severity from baseline. The median, quartiles, and range are shown for each group. The p-value is 0.048. Panel C: A box-and-whisker plot comparing changes in constipation severity between the control group and the 30+ plant blend group. The horizontal axis represents the groups (Control and 30+ plant blend), and the vertical axis represents the change in constipation severity from baseline. The median, quartiles, and range are shown for each group. The p-value is 0.02. Panel D: A box-and-whisker plot comparing changes in indigestion severity between the control group and the 30+ plant blend group. The horizontal axis represents the groups (Control and 30+ plant blend), and the vertical axis represents the change in indigestion severity from baseline. The median, quartiles, and range are shown for each group. The p-value is 0.001. Panel E: A box-and-whisker plot comparing changes in constipation domain severity between the control group and the 30+ plant blend group. The horizontal axis represents the groups (Control and 30+ plant blend), and the vertical axis represents the change in constipation domain severity from baseline. The median, quartiles, and range are shown for each group. The p-value is 0.02. Panel F: A box-and-whisker plot comparing changes in total gastrointestinal symptoms severity between the control group and the 30+ plant blend group. The horizontal axis represents the groups (Control and 30+ plant blend), and the vertical axis represents the change in total gastrointestinal symptoms severity from baseline. The median, quartiles, and range are shown for each group. The p-value is 0.02. Panel G: A box-and-whisker plot comparing changes in subjective energy ratings between the control group and the 30+ plant blend group. The horizontal axis represents the groups (Control and 30+ plant blend), and the vertical axis represents the change in energy ratings from baseline to 6 weeks. The median, quartiles, and range are shown for each group. The p-value is 0.004.
For the secondary comparison (30+ plant blend v. probiotic), there were greater reductions in severity of constipation (–0·26, 95 % CI –0·37, –0·16 v. 0·04, 95 % CI –0·09, –0·17; P = 0·007) (online Supplementary Table 11) and hunger (–0·86, 95 % CI –1·24, –0·48 v. –0·44, 95 % CI –0·30, 0·37; P = 0·006) (Table 3) following the 30+ plant blend v. the probiotic. There were no other clinically relevant differences between groups (Table 3; online Supplementary Table 9, 11).
Post hoc analysis
Sub-group analysis of participants within the top tertile concentrations (using baseline values) of key measures of lipids (apoB; LDL-cholesterol; TAG) and inflammation (glycoprotein acetyls, GlycA) was performed. There were no significant differences between groups observed for changes in these outcome measures (online Supplementary Table 14). Further exploration of within-group analyses in this sub-group was conducted and is reported in Supplementary Results.
Sub-group analysis of gastrointestinal symptoms was also conducted on participants who reported symptoms at baseline with a severity score ≥ 2 and only for symptoms that were reported by ≥ 25 % of participants at baseline to ensure adequate sample size (n 10 symptoms). Between-group analysis showed significant differences between the 30+ plant blend and control for reductions in severity of rumbling stomach (mean (95 % CI); –1·0 (–1·2, –0·8) v. –0·5 (–0·8, –0·3); P = 0·008) and constipation (–1·0 (–1·2, –0·8) v. –0·45 (–0·8, –0·1); P = 0·033) (online Supplementary Table 14). Further exploration of within-group analyses in this sub-group was conducted and is reported in Supplementary Results.
Sub-group analysis of sleep quality was conducted comparing those who reported any increase in sleep quality from baseline to endpoint. Between-group analysis showed a significantly greater proportion of participants reporting an increase in sleep quality following the 30+ plant blend v. the control (n 59; 34·9 % v. 20 %; χ 2 P = 0·014). Additionally, there was a significantly greater proportion of participants reporting an increase in sleep quality following the 30+ plant blend v. the probiotic (n 58; 34·9 % v. 19·6 %; χ 2 P = 0·012).
Postprandial sub-study
In the acute postprandial sub-study, thirty-nine participants who completed the control arm of the chronic phase and opted to take part were randomly assigned to one of six meal orders. A total of 34 participants completed the postprandial sub-study and were included in the analysis. There was no significant difference in the maximum glucose concentration (c-max; primary outcome) following the high-carbohydrate standardised breakfast alone (median 7·28 mmol/l; IQR 1·63) v. with the 30+ plant blend (median 7·50 mmol/l; IQR 1·83; P = 0·495; median difference –0·00, IQR 0·83) (online Supplementary Table 15). There were no significant differences between test meals in additional measures of glycaemic response (online Supplementary Results). The addition of the 30+ plant blend to the test meal resulted in significantly greater subjective fullness (by 41·5 %; median (IQR): 481 (275, 699) v. 328 (191, 573) mm × 3 h, P = 0·001), meal satisfaction (by 21·6 %; mean (sd); 243 (sd 290) v. 299 (sd 316) mm × 3 h, P = 0·037) and energy (by 43·3 % median (IQR): 91 (62, 270) v. 192 (119, 328) mm × 3 h, P = 0·03) and lower hunger (by –16·9 %, mean (sd); 56 (sd 76) v. 21 (sd 33) mm × 3 h, P = 0·03), desire to eat (by –70·9 %, mean (sd); 75 (sd 78) v. 25 (sd 37) mm × 3 h, P = 0·003) and prospective consumption (by –54·2 %, mean (sd); 48 (sd 63) v. 15 (sd 24) mm × 3 h, P = 0·01) in comparison to the test meal alone (online Supplementary Figure 5). Energy and macronutrient intake at the next meal was not significantly different following test meals (online Supplementary Table 15), with the exception of fibre, potentially as a result of the additional fibre consumed from the test meal with the 30+ plant blend (online Supplementary Results). Time to the next meal did not differ significantly following test meals (online Supplementary Table 15). There was significant meal × time interaction for fullness (P < 0·05; online Supplementary Results). No other differences in time-course analysis between meals for glucose metrics or subjective outcomes were observed (online Supplementary Figure 6–7).
Discussion
Effective strategies are urgently needed to improve diet quality to reduce the burden of diet-related disease and increase healthy years. In this RCT, we demonstrated that a simple, single dietary strategy in the form of a diverse high-fibre whole-food plant blend modifies gut microbiome composition and may improve gastrointestinal symptoms and subjective feelings of energy, mood and hunger when added to habitual diet. In addition to the chronic impact of the 30+ plant blend on health over 6 weeks, the exploratory findings from the postprandial sub-study demonstrate that acute intake of the 30+ plant blend with a high-carbohydrate breakfast may serve to reduce hunger and increase satiety and energy when consumed as intended, that is, as an addition to a meal.
There were significant differences between the 30+ plant blend group and both the control and probiotic groups, in the number of species significantly changing in relative abundance (increasing or decreasing) from baseline to 6 weeks. Within-group analyses showed that this corresponded to a significant change in the ZOE microbiome health and diet ranks following the 30+ plant blend, an effect that was not seen in either the probiotic or control groups, whereby species previously associated with favourable health markers and dietary indices increased in relative abundance, while species associated with less favourable profiles decreased, suggesting a shift in the gut microbial composition towards a profile previously linked with beneficial metabolic and health outcomes(Reference Asnicar, Manghi and Fackelmann46). To our knowledge, this is the first RCT to test the impact of a whole-food dietary supplement on gut microbiome composition in healthy adults. Defining a baseline ‘healthy’ gut microbiome has been a long-standing challenge in microbiome research due to inter-individual variability, geographic differences and the personalised impact of diet on microbial composition(Reference Asnicar, Manghi and Fackelmann46). Nonetheless, it is clear the diet has a profound role in shaping microbiome composition(Reference Fackelmann, Manghi and Carlino63). In this context, the use of the ZOE Microbiome Health Ranking 2025 offers a novel, evidence-based primary outcome for dietary intervention studies in healthy adults, capturing shifts in microbiome composition that may act as early, mechanistically relevant indicators of potential long-term health benefits.
The gut microbiome has been implicated as a mediator of dietary effects on host metabolic processes, including lipid metabolism, inflammation, glucose homoeostasis, bile acid signalling and SCFA production(Reference Wang, Nguyen and Li19,Reference Koh, De Vadder and Kovatcheva-Datchary25,Reference Bourdeau-Julien, Castonguay-Paradis and Rochefort64,Reference Shi, Ter Horst and Nielen65) . However, the ZOE Microbiome Health Ranking is derived from associations between microbial species and health-related or dietary indices rather than direct measurement of microbial metabolic pathways. As such, changes in this ranking reflect shifts in the relative abundance of microbial taxa previously associated with favourable health profiles and may provide complementary information to traditional health biomarkers, which may be less responsive over short intervention periods in healthy populations. These findings provide insight into potential pathways through which diet may influence long-term health, mediated via the gut microbiome. We also observed a decrease in richness in the 30+ plant blend group. While measures of microbial diversity are commonly used as indicators of microbiome health, their interpretation is context-dependent and increasing evidence suggests that diversity alone may not reliably reflect host health status(Reference Johnson and Burnet66). With the improved taxonomic resolution available from tools such as MetaPhlAn 4.0, recent work has highlighted that diversity metrics may obscure important compositional shifts within the microbiome(Reference Beghini, McIver and Blanco-Míguez67,Reference Thomas, Manghi and Asnicar68) . In particular, diversity measures do not account for whether taxa present are associated with favourable or unfavourable health outcomes. As such, complementary approaches that consider the functional or health-related associations of specific species, such as the ZOE Microbiome Health Ranking used here, may provide additional insight into diet-related microbiome changes.
An increase in energy and reduction in hunger was observed in the chronic and postprandial studies following consumption of the 30+ plant blend. Changes in subjective feelings of energy and happiness are of uncertain clinical significance in this generally healthy population; as to our knowledge, clinically relevant differences in these outcomes have not been previously reported for healthy populations. For appetite outcomes (measured by VAS), a change of ≥ 15 mm on a 100 mm VAS (or 1·5 on a 10-point scale) has been previously reported as the minimum effect expected to result in a consistent and significant difference in subsequent energy intake(Reference Sadoul, Schuring and Mela69). In the current study, we observed a reduction in hunger of –0·86 in the 30+ plant blend group which was significantly different to the probiotic group (–0·44) and is therefore considered a modest effect on postprandial hunger. A minimal clinically relevant change for the GSRS has been reported in renal transplant patients, with domain-specific thresholds ranging from 0·4 to 0·7(Reference Chan, Mulgaonkar and Walker70). However, these thresholds may not be directly applicable to healthy populations, where baseline symptom severity is typically lower and the magnitude of change required to reflect a meaningful improvement may differ.
Previous studies have demonstrated the addition of functional foods to existing meals can meaningfully modulate postprandial metabolism and appetite, even when macronutrient content is not matched. For example, adding mycoprotein to a mixed meal altered postprandial glucose kinetics compared with the base meal alone, without changing overall glucose concentrations(Reference Whelehan, West and Abdelrahman71), while the addition of concentrated arabinoxylan and whole-grain rye kernels to a porridge modified postprandial glucose, insulin, SCFA production and subjective appetite in adults with metabolic syndrome(Reference Hartvigsen, Lærke and Overgaard72). Such studies highlight the physiological impact of functional foods when consumed as an addition to habitual meals, reflecting real-world consumption scenarios. The interventions were not matched for energy, macronutrients or carbohydrate load due to the presence of a small amount of carbohydrate in the 30+ plant blend. Consistent with the aforementioned approach, we intentionally tested the 30+ plant blend as an additive to a standard high-carbohydrate breakfast, recognising that differences in energy and macronutrient content between meals may contribute to the observed effects. This design was chosen to specifically investigate the impact of the blend on postprandial glycaemia when used, as intended, as an addition to a meal, therefore providing insight into its potential real-world influence on appetite and postprandial metabolism. This also considered that the starch profile of the blend was different to that of the white bread; therefore, the carbohydrate in the blend was not interchangeable with that in the breakfast.
Additionally, our observations of a potential effect of the 30+ plant blend on subjective energy and hunger are pertinent to the current food environment. In countries where a Western dietary pattern is prevalent, habitual diets are characterised by excessive consumption of foods high in sugar, salt and saturated fats and low in fibre that typically have low satiating capacity and may encourage overconsumption(Reference Hall, Ayuketah and Brychta73). While shifts in overall dietary pattern may induce broader health benefits over time, low-burden and convenient dietary strategies have the potential to improve diet quality and diet-related outcomes in the shorter term, particularly in individuals with demanding lifestyles for whom larger dietary shifts may be unattainable. In this context, the study specifically enrolled healthy adults with fibre intakes below the UK average for adults (< 20 g/d), reflecting the vast majority of the UK population who do not meet recommended fibre intakes(5). This inclusion criterion was selected both to reduce baseline heterogeneity, given that habitual fibre intake is a key determinant of gut microbiome composition and responsiveness to dietary intervention(Reference Gill, Rossi and Bajka32,Reference Lin, Peters and Friedlander74,Reference Healey, Murphy and Butts75) , and to evaluate the intervention in individuals most likely to derive measurable microbiome and gut health benefits from increased fibre and plant diversity. Accordingly, the findings should be interpreted in the context of populations with sub-optimal fibre intake, for whom such low-burden dietary strategies may be particularly relevant.
It was hypothesised that the intervention would modulate gut microbiome composition, resulting in significant improvements in cardiometabolic health markers. While we did observe a within-arm increase in relative abundance of microbiome species associated with health(Reference Asnicar, Manghi and Fackelmann46) following the 30+ plant blend, there was no effect of the intervention on cardiometabolic biomarkers in comparison to either the functional or active controls. Our sample consisted of healthy individuals without cardiometabolic risk factors; therefore, there may have been little in terms of cardiometabolic health outcomes that could be improved in these individuals. We conducted exploratory post hoc analysis in a sub-group of participants with the highest concentrations of these biomarkers before the intervention, and while we saw no differences between groups, there were small but significant reductions in measures of inflammation (GlycA) and lipids (apoB) from baseline to 6 weeks in the 30+ plant blend group only (online Supplementary Results) that potentially warrant further investigation in future trials over longer durations. While diet has a direct, rapid and often profound impact on the gut microbiome(Reference David, Maurice and Carmody21), the relationship between diet, the microbiome and cardiometabolic health outcomes is indirect, likely mediated by the effects of fibre on microbial fermentation and subsequent action of microbial metabolites (e.g. SCFA) on cardiovascular and metabolic tissues(Reference Koh, De Vadder and Kovatcheva-Datchary25). Results seen in this sub-group were small, and given the limited sample size, of unclear clinical significance. Nonetheless, if confirmed in future studies, these findings suggest that regular consumption of the blend by individuals at greater cardiometabolic risk may have additional benefits for health.
Similar results were seen following consumption of the probiotic, indicating the 30+ plant blend can exert effects similar to those seen using interventions previously shown to impact gut microbiome composition and health outcomes. This is particularly interesting considering previous investigations of the probiotic species used in our study. Administration of L. rhamnosus has shown beneficial effects on immune health in elderly adults(Reference Ashraf and Shah76), on cognition in middle-aged and older adults(Reference Aljumaah, Bhatia and Roach77). Future studies are warranted to determine the impact of the 30+ plant blend on health and cognitive outcomes in these population groups. Additionally, the 30+ plant blend resulted in significantly increased mood and energy compared with the control. This aligns with the growing and promising body of evidence suggesting that diet has the potential to impact brain processes and behaviour via the microbiota–gut–brain axis(Reference Berding, Vlckova and Marx79), with an RCT demonstrating a benefit of prebiotic fibres on mood(Reference Talbott and Talbott80). While these results are of interest, we note that secondary outcomes in this trial were considered exploratory and unadjusted for multiple comparisons. Therefore, these findings should be interpreted with appropriate caution.
While we did not observe an impact of the 30+ plant blend on postprandial glucose concentrations in this population, acute consumption of interventions containing fibre, consumed as a preload or at the same time as a high-carbohydrate meal has been demonstrated to modulate postprandial glucose concentrations in individuals with increased cardiometabolic risk(Reference Dong, Rendeiro and Kristek81) or type 2 diabetes(Reference Clifton, Galbraith and Coles82,Reference Bae, Kim and Min83) . Thus, it is possible that the additional fibre from 30+ plant blend may benefit postprandial glycaemia in people at greater metabolic risk, an outcome that warrants investigation in future trials. In line with our findings, a meta-analysis of RCT investigating the impact of dietary prebiotics on postprandial ratings of hunger and satiety reported that prebiotics resulted in greater postprandial satiety(Reference Kellow, Coughlan and Reid84).
A strength of this study was the relatively high self-reported adherence, suggesting participants were generally able to incorporate the 30+ plant blend into their habitual diets, highlighting the real-world application of the blend. Although self-report is subject to bias, evidence from dietary studies shows that higher self-reported adherence is indicative of meaningful changes in health outcomes(Reference O’Reilly, Panizza and Lim85). In the probiotic arm, detection of L.rhamnosus was explored as a secondary adherence marker; colonisation is highly variable and often transient; therefore, inconsistent detection, as observed in the current study, does not necessarily indicate non-compliance(Reference Suez, Zmora and Segal86,Reference Yan, Gao and Sun87) . While the study did not directly assess long-term acceptability of the blend, the interventions appeared to be well tolerated, indicating that continued use beyond 6 weeks is likely to be acceptable and convenient. Future studies are warranted to determine whether longer intervention duration leads to subsequent benefits for cardiometabolic health markers mediated via the gut microbiome.
An added contribution of this research to the field of nutrition was the innovative study design approach. We conducted an exclusively remote RCT, incorporating a 6-week dietary intervention assessing multiple measures of health (gut microbiome, metabolomics and self-reported measures), with both high self-reported adherence and participant retention. We have demonstrated the feasibility of this approach and a potential paradigm shift for dietary intervention trials, in that they can be conducted remotely while maintaining scientific rigour. The use of a remote design for the postprandial sub-study presented several challenges, specifically, remote delivery limits the degree to which dietary intake can be fully controlled and necessitates some reliance on subjective outcome measures. Although technological advancements in our ability to monitor health outcomes in the home are advancing rapidly, remote designs also offer important benefits, particularly in the context of dietary interventions intended for real-world use. They enable evaluation of interventions under conditions that more closely reflect habitual consumption patterns, reduce participant burden and facilitate recruitment of larger and more diverse populations than is often feasible in tightly controlled laboratory settings.
Limitations of our study include the absence of a true control food and therefore lack of complete blinding of participants. This is a common challenge in dietary intervention trials due to the technical limitations of designing a control food that is both nutritionally and functionally similar, but without the active ingredients of the intervention(Reference Staudacher, Irving and Lomer88). Therefore, we chose a control that was isoenergetic and functionally similar, in that the 30+ plant blend is designed to be added to meals, in a similar way to croutons. In addition, we did not indicate which treatment was the intervention of interest on any participant facing materials or communications, in an attempt to blind participants to the intent of the trial(Reference Tien, Hockey and So38). Nonetheless, it is possible that self-reported results may suffer from a degree of subjectivity as a result of participants’ potential awareness of their allocated group (intervention v. control). A number of secondary outcome measures were self-reported. For many of these outcomes (subjective feelings, gastrointestinal symptoms and stool output), reliable objective methods do not exist or are not applicable to remote studies. Findings from the subjective outcomes analyses (subjective hunger, energy, mood and gastrointestinal symptoms) should be interpreted with caution, as the magnitude of the observed changes is relatively small and, in some cases (subjective energy and mood, gastrointestinal symptoms), of uncertain clinical significance in this generally healthy population. In addition, these outcomes were assessed at two time points only (baseline and 6 weeks), and therefore the study design does not allow determination of whether the observed changes exceed normal day-to-day variability in these measures. Future studies incorporating repeated measurements or determining acceptable thresholds for meaningful change in healthy populations would be valuable to confirm the clinical relevance of these findings. Nonetheless, subjective measures provide an insight into the real-world experience of participants and valuable information on whether an intervention is likely to be acceptable or adhered to.
In addition, due to the remote design of the study, randomisation was performed prior to the full completion of eligibility screening in order to facilitate efficient recruitment and study management, within the capacity of trial staff. While this resulted in a number of post-randomisation exclusions, it reflects the practical constraints of conducting decentralised remote trials at scale. Other limitations include the duration of the intervention (6 weeks) which may have been insufficient to detect clinically meaningful changes in blood metabolites. The sample did not include young or elderly individuals or those suffering from diabetes or severe obesity; in addition, individuals from non-European backgrounds were underrepresented in our study, so we cannot generalise results to these groups. Although the adherence based on weekly calls was very high, we did not include any objective measure of intake, which is a technical limitation of remote studies, and nutritional studies in a free-living setting. Also, although we observed significant differences between groups in microbiome composition due to the limited sample size, we were unable to carry out additional analyses, including more detailed sensitivity analyses or additional health-related variables. Future interventions should be carried out in large-scale cohorts, particularly with the remote techniques established in this study. Finally, our sample had a high proportion of female participants (75 %) and were of majority White ethnicity (93 %); therefore, our results cannot be considered reflective of a nationally representative sample of the UK population. Future studies should seek to validate these findings in a targeted sample.
The formulation 30+ plant blend investigated in the current study comprised diverse plant ingredients containing established prebiotic fibres, and its consumption resulted in selective shifts in gut microbiome composition that were not observed in the probiotic or control groups. Notably, the species modulated by the intervention have previously been associated with favourable health and diet quality indices, while those linked to less favourable species decreased(Reference Asnicar, Manghi and Fackelmann46). While these findings suggest that the blend may exert prebiotic-like effects on the gut microbiome, the current study was not designed to establish whether it meets the formal criteria for classification as a prebiotic, including defining the structure and composition of substrates, or demonstration of selective utilisation of these substrates(Reference Hutkins, Walter and Gibson89). Further work is required to characterise the specific components and mechanisms underlying the effects seen in the current study. Nevertheless, the observed microbiome changes provide evidence that the 30+ plant blend can modulate gut microbial composition in a manner consistent with known effects of fermentable plant substrates.
In conclusion, we present a simple, convenient fibre-rich plant-diverse blend of whole-food ingredients that can be consumed daily as an addition to the diet or to replace less nutrient dense alternatives that are designed to add flavour but are typically nutrient-poor. As well as encouraging improvement in diet quality and fibre intake, convenient simple strategies such as the addition of this 30+ plant blend provide promising shifts in microbiome composition and potential improvements in gut symptoms. Further research is warranted to determine whether changes in health-associated microbial species in response to the blend result in improvements in further health outcomes over time.
Supplementary material
For supplementary material/s referred to in this article, please visit https://doi.org/10.1017/S0007114526107703
Acknowledgements
The authors thank the participants of the ZOE BIOME study. The authors also thank G. Hadjigeorgiou, A. Majid, D. Boland, G. Cotrupi, L. Parker, M. Deldeniya, H. Warne, S. Gordon, M. Gallivan, R. DSouza and V. Zely for their assistance during the study and manuscript preparation. The authors thank Indi Supplements for their contribution towards the development of the 30+ plant blend. This research was funded by ZOE Ltd; the study funder contributed, as part of the scientific advisory board, to study design, data collection and analysis, and the writing of the manuscript.
This research was supported by ZOE limited.
J.W. and T.D.S. obtained the funding. F.Am., N.S., W.J.B., K.M.B., I.L., R.D., F.As., T.D.S. and S.E.B. contributed to the study design and developed the study concept. H.B., M.W., H.A.S., A.P., C.J., C.C. and N.K. collected the data. A.C.C., H.B., K.M.B. and S.E.B. coordinated the study. M.W., A.A., H.A.S., A.P., J.C.P., E.P., A.R.L., C.J., F.G., F.As., A.C.C. and C.K. prepared and analysed the data. A.C.C., H.B., F.Am., A.A., H.A.S., W.J.B., F.As., T.D.S. and S.E.B. wrote the manuscript. All authors read and approved the final manuscript.
T.D.S. and J.W. are co-founders of Zoe Ltd; S.E.B., F.As. and N.S. are consultants to ZOE Ltd; A.C.C., H.B., F.Am., M.W., A.A., H.A.S., A.P., W.J.B., K.M.B., J.C.P., A.R.L., C.J., C.C., N.K., I.L., F.G., R.D. and C.K. are or have been employees of ZOE Ltd; A.C.C. H.B., F.Am., A.A., M.W., H.A.S., A.P., W.J.B., K.M.B., J.C.P., A.R.L., I.L., C.K., F.G., F.As., J.W., N.S., S.E.B. and T.D.S. receive options with ZOE Ltd.
Ethical approval was granted by King’s College London Research Ethics Committee (HR/DP-23/24-39673). All procedures were carried out in accordance with the Declaration of Helsinki (2013) and Good Clinical Practice. Informed consent was obtained from all volunteer participants. Electronic written informed consent was obtained from all subjects. The study protocol was registered on clincialtrials.gov (NCT06231706; https://clinicaltrials.gov).
The study data can be released to bona fide researchers by submitting a research proposal approved by a subpanel of our scientific advisory board which meets once per month with independent members to assess proposals. The data may be pseudonymised or otherwise redacted to comply with the UK General Data Protection Regulation (GDPR). Researchers will be required to enter into a GDPR data sharing agreement before data may be released. Access request proposals should be sent to data.papers@joinzoe.com. The microbiome data will be made freely available via the EBI website (www.ebi.ac.uk; ID PRJEB78714).
The scripts for the statistical analysis are freely available upon request to ZOE Ltd. Application is via data.papers@joinzoe.com. Code will be made available within 2 months of the request.

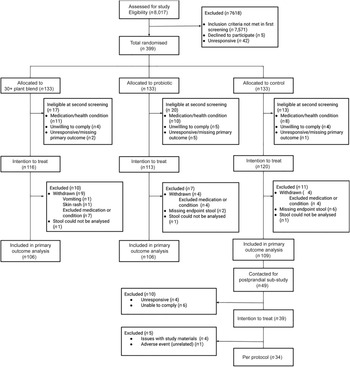
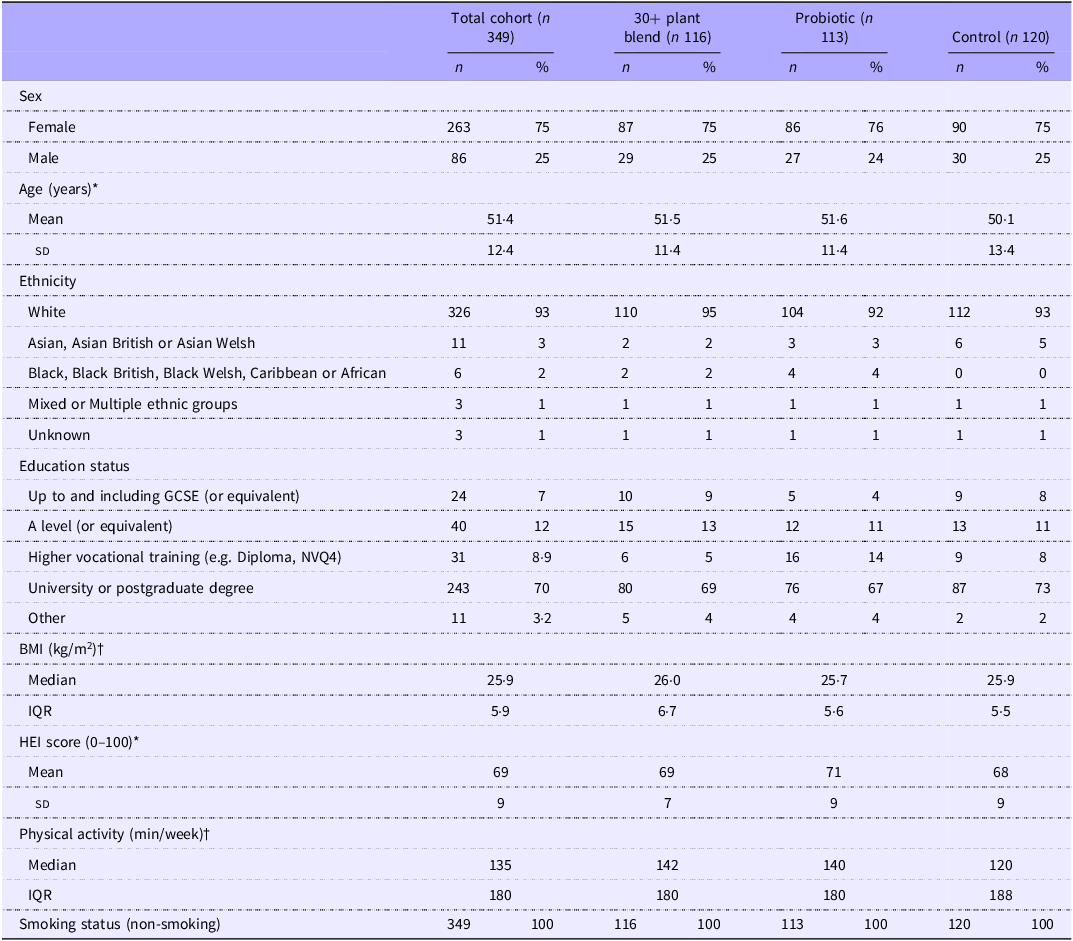
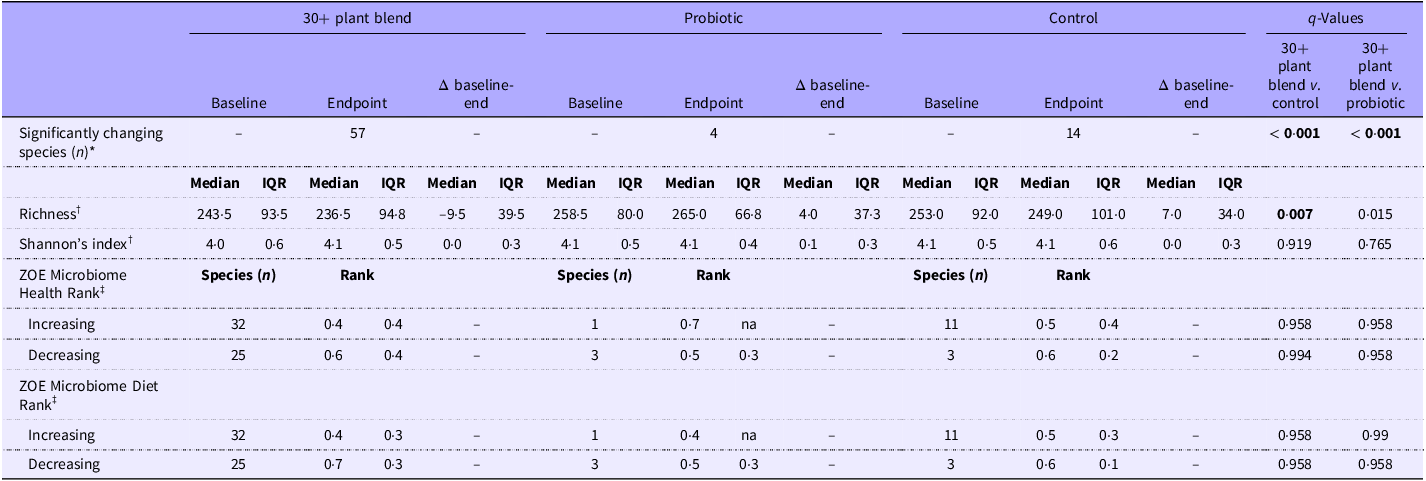
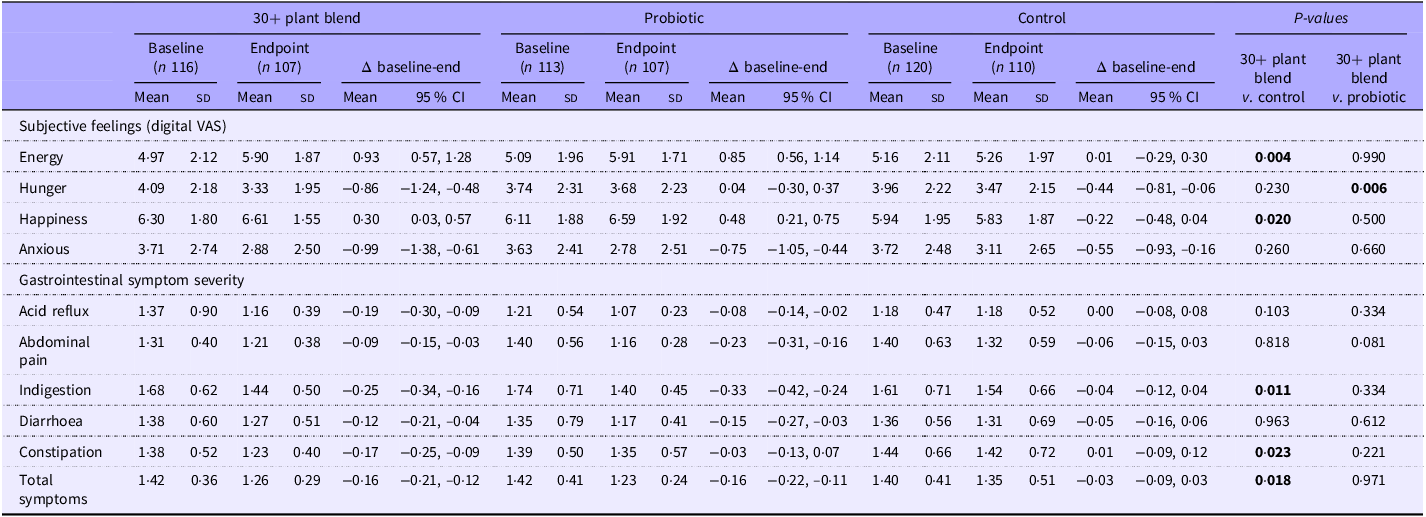


 Open access

