


1. Introduction
One of the most commonly used systems in reliability is an r-out-of-n system. This system, comprising n components, works iff at least r components work, and it includes parallel, fail-safe and series systems all as special cases corresponding to r = 1, 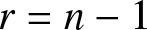 $r=n-1$ and r = n, respectively. Let
 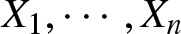 $X_1,\cdots,X_n$ denote the lifetimes of components of a system and
 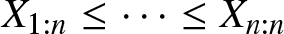 $X_{1:n}\le \cdots\le X_{n:n}$ be the corresponding order statistics. Then,
 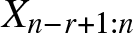 $X_{n -r+1:n}$ corresponds to the lifetime of a r-out-of-n system. Due to this direct connection, the theory of order statistics becomes important in studying
 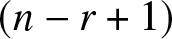 $(n-r+1)$-out-of-n systems and in characterizing their properties.
The comparison of important characteristics associated with lifetimes of technical systems is an interesting topic in reliability theory, since it usually enables us to approximate complex systems with simpler ones and subsequently enable us to obtain various bounds for important ageing characteristics of the complex system. A tool that is useful for this purpose is the theory of stochastic orderings.
A huge body of literature concerning distributional properties as well as applications of order statistics has been published in the last few decades. Interested readers may refer to Balakrishnan and Rao [Reference Balakrishnan and Rao5, Reference Balakrishnan and Rao6], David and Nagaraja [Reference David and Nagaraja12], and Arnold et al. [Reference Arnold, Balakrishnan and Nagaraja2] for pertinent details. Besides order statistics, some functions of them have also been found to be useful in applications. One of them, called the sample range, is defined as 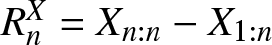 $R^X_n=X_{n:n}- X_{1:n}$. Sample range can be interpreted in a reliability context as follows. Let the random variables
  $X_1,\cdots,X_n$ describe the lifetimes of components of a series system. When the system fails, that is, after the first failure, n − 1 components still survive which can, therefore, be used in some other systems or even for other testing purposes. If the live components are put to work in a parallel system, for example, then the lifetime of the new system can be described by
  $R^X_n$; see Balakrishnan et al. [Reference Balakrishnan, Barmalzan and Haidari3] for further details, in the iid (independent and identically distributed) case.
Stochastic comparisons of sample ranges have been investigated for independent exponential random variables and some other cases. To review the established results in this direction and some extensions of them to the general proportional hazard rate model, one may refer to Kochar and Rojo [Reference Kochar and Rojo19], Khaledi and Kochar [Reference Khaledi, Kochar and Misra16], Kochar and Xu [Reference Kochar and Xu20], Zhao and Li [Reference Zhao and Li31], Genest et al. [Reference Genest, Kochar and Xu14], Mao and Hu [Reference Mao and Hu24], Zhao and Zhang [Reference Zhao and Zhang33], Zhao and Li [Reference Zhao and Li32], Ding et al. [Reference Ding, Da and Zhao13], Balakrishnan and Zhao [Reference Balakrishnan and Zhao9], Balakrishnan et al. [Reference Balakrishnan, Chen, Zhang and Zhao4], Castaño-Martinez et al. [Reference Castaño-Martinez, Pigueiras and Sordo10], Kochar [Reference Kochar18], and Balakrishnan et al. [Reference Balakrishnan, Saadat Kia and Mehrpooya7, Reference Balakrishnan, Zhang and Zhao8]. But, for other distributions not covered by the general proportional hazard rate model, stochastic comparison results for sample ranges remain noticeably absent in the literature, maybe due to the complexity of the problem. Moreover, another problem of interest concerns the case when the involved random variables are dependent. For modeling dependency, many attractive multivariate distributions have been introduced and discussed in detail; see, for example, Kotz et al. [Reference Kotz, Balakrishnan and Johnson21]. However, ordering results for the comparison of their sample ranges are scarce in the literature, and one may see in this regard the recent work of Balakrishnan et al. [Reference Balakrishnan, Saadat Kia and Mehrpooya7] concerning the Marshall-Olkin bivariate exponential distribution.
Assume that the non-negative random vector  $(X_1,X_2)$ possesses the joint survival and joint probability density functions as
 \begin{eqnarray*}
\bar{F}(x_1,x_2)=(1+\lambda_1x_1+\lambda_2x_2)^{-\alpha},\qquad x_1\ge 0, x_2\ge 0,
\end{eqnarray*}
\begin{eqnarray*}
\bar{F}(x_1,x_2)=(1+\lambda_1x_1+\lambda_2x_2)^{-\alpha},\qquad x_1\ge 0, x_2\ge 0,
\end{eqnarray*}and
 \begin{eqnarray*}
f(x_1,x_2)=\alpha(\alpha+1)\lambda_1\lambda_2(1+\lambda_1x_1+\lambda_2x_2)^{-(\alpha+2)},\qquad x_1\in\mathbb{R}^+, x_2\in\mathbb{R}^+,
\end{eqnarray*}
\begin{eqnarray*}
f(x_1,x_2)=\alpha(\alpha+1)\lambda_1\lambda_2(1+\lambda_1x_1+\lambda_2x_2)^{-(\alpha+2)},\qquad x_1\in\mathbb{R}^+, x_2\in\mathbb{R}^+,
\end{eqnarray*} respectively, where 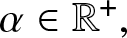 $\alpha\in\mathbb{R}^+,$
 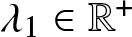 $\lambda_1\in\mathbb{R}^+$ and
  $\lambda_2\in\mathbb{R}^+.$ Then,
  $(X_1,X_2)$ is said to have the bivariate Pareto distribution with parameters
  $\alpha,$ λ 1 and
  $\lambda_2,$ written as
  $(X_1,X_2)\sim\mathcal{BP}(\alpha,\lambda_1,\lambda_2).$ For more information on the properties and applications of the bivariate Pareto distribution, one may refer to Lai and Balakrishnan [Reference Lai and Balakrishnan22], Arnold [Reference Arnold1], and Lindley and Singpurwalla [Reference Lindley and Singpurwalla23]. Now, let
  $(X_1,X_2)$ and
  $(Y_1,Y_2)$ be two non-negative random vectors with
  $(X_1,X_2)\sim\mathcal{BP}(\alpha,\lambda_1,\lambda_2)$ and
  $(Y_1,Y_2)\sim\mathcal{BP}(\alpha,\mu_1,\mu_2).$ It is then shown here that
 \begin{eqnarray}
(\lambda_1,\lambda_2)\stackrel{m}{\succ}(\mu_1,\mu_2)\Rightarrow (X_{1:2},X_{2:2})\ge_{st}(Y_{1:2},Y_{2:2}).
\end{eqnarray}
\begin{eqnarray}
(\lambda_1,\lambda_2)\stackrel{m}{\succ}(\mu_1,\mu_2)\Rightarrow (X_{1:2},X_{2:2})\ge_{st}(Y_{1:2},Y_{2:2}).
\end{eqnarray} Also, under the assumption that  $\lambda_1\le\mu_1\le\mu_2\le\lambda_2,$ the following equivalencies are proved:
 \begin{align}
(\lambda_1,\lambda_2)&\stackrel{rm}{\succ}(\mu_1,\mu_2)\Longleftrightarrow X_{2:2}-X_{1:2}\ge_{hr}Y_{2:2}-Y_{1:2}\Longleftrightarrow X_{2:2}-X_{1:2}\ge_{st}Y_{2:2}-Y_{1:2},
\end{align}
\begin{align}
(\lambda_1,\lambda_2)&\stackrel{rm}{\succ}(\mu_1,\mu_2)\Longleftrightarrow X_{2:2}-X_{1:2}\ge_{hr}Y_{2:2}-Y_{1:2}\Longleftrightarrow X_{2:2}-X_{1:2}\ge_{st}Y_{2:2}-Y_{1:2},
\end{align} \begin{align}
(\lambda_1,\lambda_2)&\stackrel{w}{\succ}(\mu_1,\mu_2)\Longleftrightarrow X_{2:2}-X_{1:2}\ge_{lr}Y_{2:2}-Y_{1:2}\Longleftrightarrow X_{2:2}-X_{1:2}\ge_{rh}Y_{2:2}-Y_{1:2}.
\end{align}
\begin{align}
(\lambda_1,\lambda_2)&\stackrel{w}{\succ}(\mu_1,\mu_2)\Longleftrightarrow X_{2:2}-X_{1:2}\ge_{lr}Y_{2:2}-Y_{1:2}\Longleftrightarrow X_{2:2}-X_{1:2}\ge_{rh}Y_{2:2}-Y_{1:2}.
\end{align} In the above,  $\stackrel{m}{\succ}$,
  $\stackrel{w}{\succ}$ and
  $\stackrel{rm}{\succ}$ denote majorization, weak majorization and reciprocal majorization orders, while
  $\ge_{st}$,
  $\ge_{hr}$,
  $\ge_{rh}$ and
  $\ge_{lr}$ denote the usual stochastic, hazard rate, reversed hazard rate and likelihood ratio orders, respectively, which are all defined in the next section. As an application of rate (1), one may find a lower bound for the survival function of the convolution of bivariate Pareto distributed random variables. Moreover, (2) and (3) can be used to find some lower and upper bounds for the survival, hazard rate and reversed hazard rate functions of the sample range arising from the bivariate Pareto distributed random variables.
It is important to note that the marginal distributions of the above given bivariate Pareto distribution are univariate Pareto. These distributions have assumed an important role in modeling data in economic and financial applications; see, for example, Arnold [Reference Arnold1]. Based on univariate Pareto variables, some stochastic ordering results have been discussed by Naqvi et al. [Reference Naqvi, Ding and Zhao26] and Chen et al. [Reference Chen, Embrechts and Wang11]. In particular, the first of these two articles has established stochastic ordering results for the lifetimes of parallel systems comprising independent Pareto components. In what follows, we prove some results concerning the stochastic comparison of order statistics and the range arising from a bivariate Pareto random vector defined above.
The rest of this paper is organized as follows. In Section 2, we briefly review some definitions and notions that are essential for the results to be established in the sections to follow. Section 3 discusses some new results concerning the stochastic comparisons of vectors of order statistics and also characterization ordering results between sample ranges from two sets of bivariate Pareto distributed random variables. Finally, some brief concluding remarks are made in Section 4.
2. Preliminaries
We describe here some concepts and notions that will be used in the next section. In the first definition, we describe some univariate stochastic orderings that are used to compare the magnitude of random variables.
Definition 2.1. Suppose Z 1 and Z 2 are two non-negative random variables with distribution functions G1 and  $G_2,$ survival functions
  $\bar{G}_1=1-G_1$ and
  $\bar{G}_2=1-G_2,$ density functions g 1 and
  $g_2,$ hazard rate functions
  $r_1=g_1/\bar{G}_1$ and
  $r_2=g_2/\bar{G}_2,$ and reversed hazard rate functions
  $\tilde{r}_1=g_1/G_1$ and
  $\tilde{r}_2=g_2/G_2,$ respectively. Then, it is said that
(i) Z 1 is larger than Z 2 in the usual stochastic order, denoted by
 $Z_1\ge_{st}Z_2,$ if
$\bar{G}_1(x)\ge\bar{G}_2(x)$ for all
$x\ge 0;$
$Z_1\ge_{st}Z_2,$ if
$\bar{G}_1(x)\ge\bar{G}_2(x)$ for all
$x\ge 0;$(ii) Z 1 is larger than Z 2 in the hazard rate order, denoted by
$Z_1\ge_{hr}Z_2,$ if
$r_2(x)\ge r_1(x)$ for all
$x\ge 0;$(iii) Z 1 is larger than Z 2 in the reversed hazard rate order, denoted by
$Z_1\ge_{rh}Z_2,$ if
$\tilde{r}_1(x)\ge\tilde{r}_2(x)$ for all
$x\ge 0;$(iv) Z 1 is larger than Z 2 in the likelihood ratio order, denoted by
$Z_1\ge_{lr}Z_2,$ if
$g_1(x)/g_2(x)$ is increasing in
$x\ge 0.$


It is known that likelihood ratio order implies both hazard rate and reversed hazard rate orders, and these orders simultaneously result in the usual stochastic order; see Chapter 1 of Shaked and Shanthikumar [Reference Shaked and Shanthikumar28] for more details.
Below, a bivariate generalization of the usual stochastic order is described; see Chapter 6 of Shaked and Shanthikumar [Reference Shaked and Shanthikumar28].
Definition 2.2. For two non-negative random vectors  $(Z_1,Z_2)$ and
  $(U_1,U_2),$ it is said that
  $(Z_1,Z_2)$ is larger than
  $(U_1,U_2)$ in the usual bivariate stochastic order, denoted by
  $(Z_1,Z_2)\ge_{st}(U_1,U_2),$ if
  $\mathbb{E}(\varphi(Z_1,Z_2))\ge\mathbb{E}(\varphi(U_1,U_2))$ for all increasing functions
  $\varphi:[0,\infty)\times [0,\infty)\rightarrow\mathbb{R},$ where the involved expectations are assumed to be exist.
Next, some criteria for comparing positive vectors are described.
Definition 2.3. Consider two vectors  $\boldsymbol{a}=(a_1,\ldots,a_m)\in{\mathbb{R}^+}^n$ and
  $\boldsymbol{b}=(b_1,\ldots,b_m)\in{\mathbb{R}^+}^n$ and let
  $a_{(1)}\le\ldots\le a_{(n)}$ and
  $b_{(1)}\le\ldots\le b_{(n)}$, respectively, denote the arrangements of their components in increasing order. Set
  $s_i(\boldsymbol{a})=\sum_{j=1}^{i}a_{(j)},$
  $p_i(\boldsymbol{a})=\prod_{j=1}^{i}a_{(j)}$ and
  $q_i(\boldsymbol{a})=\sum_{j=1}^{i}a^{-1}_{(j)},$ for
  $i=1,\ldots,n.$ Then, it is said that
(i) a is greater than b in the majorization order, written as
$\boldsymbol{a}\stackrel{m}{\succ}\boldsymbol{b},$ if
$s_i(\boldsymbol{b})\ge s_i(\boldsymbol{a}),$ for
$i=1\ldots,n-1,$ and
$s_n(\boldsymbol{a})= s_n(\boldsymbol{b});$(ii) a is greater than b in the weak majorization order, written as
$\boldsymbol{a}\stackrel{w}{\succ}\boldsymbol{b},$ if
$s_i(\boldsymbol{b})\ge s_i(\boldsymbol{a}),$ for
$i=1\ldots,n;$(iii) a is greater than b in the p-larger order, written as
$\boldsymbol{a}\stackrel{p}{\succ}\boldsymbol{b},$ if
$p_i(\boldsymbol{b})\ge p_i(\boldsymbol{a}),$ for
$i=1,\ldots,n;$(iv) a is greater than b in the reciprocal majorization order, written as
$\boldsymbol{a}\stackrel{rm}{\succ}\boldsymbol{b},$ if
$q_i(\boldsymbol{a})\ge q_i(\boldsymbol{b}),$ for
$i=1,\ldots,n.$


It is well-known that the majorization order implies the weak majorization order and the latter in turn implies the p-larger order [Reference Khaledi and Kochar15]. Further, the p-larger order implies the reciprocal majorization order [Reference Kochar and Xu17]. To get comprehensive details on the above vector orderings and their applications, one may refer to Marshall et al. [Reference Marshall, Olkin and Arnold25] and Balakrishnan and Zhao [Reference Balakrishnan and Zhao9].
Those functions that preserve the majorization ordering are said to be Schur-convex. The following lemma provides a characterization of Schur-convex functions.
Lemma 2.4. ([Reference Ostrowski27][Reference Marshall, Olkin and Arnold25, p. 84])
Let  $\mathbb{I}$ be an open interval and let
  $\varphi:{\mathbb{I}^n}\rightarrow\mathbb{R}$ be continuously differentiable. Then, the necessary and sufficient conditions for φ to be Schur-convex on
  $\mathbb{I}^n$ are
(i) φ is symmetric on
$\mathbb{I}^n;$(ii) for all
$\boldsymbol{u}=(u_1,\ldots,u_n)\in\mathbb{I}^n$ and all
$i\not=j,$ we have
\begin{eqnarray*}
(u_i-u_j)(\partial_i\varphi(\boldsymbol{u})-\partial_j\varphi(\boldsymbol{u}))\ge 0,
\end{eqnarray*}where
$\partial_k\varphi(\boldsymbol{u})=\partial\varphi(\boldsymbol{u})/\partial u_k.$


Set
 \begin{eqnarray*}
\mathcal{E}^{+}_2=\Big\{(u_1,u_2)\in\mathbb{R}^2:\,0 \lt u_1\le u_2\Big\}.
\end{eqnarray*}
\begin{eqnarray*}
\mathcal{E}^{+}_2=\Big\{(u_1,u_2)\in\mathbb{R}^2:\,0 \lt u_1\le u_2\Big\}.
\end{eqnarray*}The following lemma will play a key role in establishing the main results in the next section. Part (i) of it could be found in Wang [Reference Wang29], while Part (ii) is stated in Wang and Cheng [Reference Wang and Cheng30].
Lemma 2.5. Consider a function  $\psi:\mathcal{E}^+_2\rightarrow\mathbb{R},$ and assume that
  $a_1\le b_1\le b_2\le a_2.$
(i) If
$\psi(a_1,a_2)$ is decreasing (increasing) along the vectors
$(1,0)$ and
$(1,-1),$ then we have
\begin{equation*}(a_1,a_2)\stackrel{w}{\succ}(b_1,b_2)\Longrightarrow\psi(a_1,a_2)\ge(\le)\psi(b_1,b_2);\end{equation*}(ii) If
$\psi(a_1,a_2)$ is decreasing (increasing) along the vectors
$(1,0)$ and
$(a^2_1,-a^2_2),$ then we have
\begin{equation*}(a_1,a_2)\stackrel{rm}{\succ}(b_1,b_2)\Longrightarrow\psi(a_1,a_2)\ge(\le)\psi(b_1,b_2).\end{equation*}


To simplify the calculations made in Section 3, we need some distributional properties of order statistics arising from a bivariate Pareto distribution. For  $(X_1,X_2)\sim\mathcal{BP}(\alpha,\lambda_1,\lambda_2),$ the survival functions of
  $X_{1:2}$ and
  $X_{2:2}$ are denoted by
  $\bar{F}_{1:2}$ and
  $\bar{F}_{2:2}.$ It is then easy to see that, for
  $x\ge 0,$
 \begin{eqnarray*}
\bar{F}_{1:2}(x)=(1+(\lambda_1+\lambda_2)x)^{-\alpha},\quad
\bar{F}_{2:2}(x)=(1+\lambda_1x)^{-\alpha}+(1+\lambda_2x)^{-\alpha}-(1+(\lambda_1+\lambda_2)x)^{-\alpha}.
\end{eqnarray*}
\begin{eqnarray*}
\bar{F}_{1:2}(x)=(1+(\lambda_1+\lambda_2)x)^{-\alpha},\quad
\bar{F}_{2:2}(x)=(1+\lambda_1x)^{-\alpha}+(1+\lambda_2x)^{-\alpha}-(1+(\lambda_1+\lambda_2)x)^{-\alpha}.
\end{eqnarray*} We shall now find the joint survival function of  $(X_{1:2},X_{2:2}),$ denoted by
  $\bar{F}_{1,2:2}.$ For
  $x_1\ge x_2,$ one can readily observe that
  $\bar{F}_{1,2:2}(x_1,x_2)=\bar{F}_{1:2}(x_1).$ Moreover, the cases
  $0 \gt x_2 \gt x_1$ or
  $x_2 \gt 0 \gt x_1$ result in
  $\bar{F}_{1,2:2}(x_1,x_2)=\bar{F}_{2:2}(x_2).$ Now, for
  $x_2 \gt x_1 \gt 0,$ we have
 \begin{align*}
\bar{F}_{1,2:2}(x_1,x_2)&=\mathbb{P}(X_{1:2} \gt x_1)-\mathbb{P}(x_1 \lt X_1\le x_2, x_1 \lt X_2\le x_2)\\
&=\bar{F}(x_1,x_1)-\left[\bar{F}(x_1,x_1)+\bar{F}(x_2,x_2)-\bar{F}(x_1,x_2)-\bar{F}(x_2,x_1)\right]\\
&=\bar{F}(x_1,x_2)+\bar{F}(x_2,x_1)-\bar{F}(x_2,x_2).
\end{align*}
\begin{align*}
\bar{F}_{1,2:2}(x_1,x_2)&=\mathbb{P}(X_{1:2} \gt x_1)-\mathbb{P}(x_1 \lt X_1\le x_2, x_1 \lt X_2\le x_2)\\
&=\bar{F}(x_1,x_1)-\left[\bar{F}(x_1,x_1)+\bar{F}(x_2,x_2)-\bar{F}(x_1,x_2)-\bar{F}(x_2,x_1)\right]\\
&=\bar{F}(x_1,x_2)+\bar{F}(x_2,x_1)-\bar{F}(x_2,x_2).
\end{align*} Consequently, the joint survival function of  $(X_{1:2},X_{2:2})$ is found to be
 \begin{align*}
\bar{F}_{1,2:2}(x_1,x_2)&=\bar{F}_{1:2}(x_1)I_{\{x_1\ge x_2\}}+\bar{F}_{2:2}(x_2)I_{\{0 \gt x_2 \gt x_1\}\cup\{x_2 \gt 0 \gt x_1\}}\\
&\quad+\Big[\bar{F}(x_1,x_2)+\bar{F}(x_2,x_1)-\bar{F}(x_2,x_2)\Big]I_{\{x_2 \gt x_1 \gt 0\}}.
\end{align*}
\begin{align*}
\bar{F}_{1,2:2}(x_1,x_2)&=\bar{F}_{1:2}(x_1)I_{\{x_1\ge x_2\}}+\bar{F}_{2:2}(x_2)I_{\{0 \gt x_2 \gt x_1\}\cup\{x_2 \gt 0 \gt x_1\}}\\
&\quad+\Big[\bar{F}(x_1,x_2)+\bar{F}(x_2,x_1)-\bar{F}(x_2,x_2)\Big]I_{\{x_2 \gt x_1 \gt 0\}}.
\end{align*} The joint probability density function of  $(X_{1:2},X_{2:2})$ is then obtained as
 \begin{align*}
f_{1,2:2}(x_1,x_2)&=\frac{\partial^2}{\partial x_1\partial x_2}\bar{F}_{1,2:2}(x_1,x_2)\\
&=\alpha(\alpha+1)\lambda_1\lambda_2\Big[(1+\lambda_1x_1+\lambda_2x_2)^{-(\alpha+2)}+(1+\lambda_2x_1+\lambda_1x_2)^{-(\alpha+2)}\Big]I_{\{x_2 \gt x_1 \gt 0\}}.
\end{align*}
\begin{align*}
f_{1,2:2}(x_1,x_2)&=\frac{\partial^2}{\partial x_1\partial x_2}\bar{F}_{1,2:2}(x_1,x_2)\\
&=\alpha(\alpha+1)\lambda_1\lambda_2\Big[(1+\lambda_1x_1+\lambda_2x_2)^{-(\alpha+2)}+(1+\lambda_2x_1+\lambda_1x_2)^{-(\alpha+2)}\Big]I_{\{x_2 \gt x_1 \gt 0\}}.
\end{align*} Next, the conditional survival function of  $X_{2:2},$ given
  $X_{1:2}=x_1(\in\mathbb{R}^+),$ denoted by
  $\bar{F}_{2|1}(.|x_1),$ is obtained. For
  $x_1\ge x_2,$ one can readily observe that
  $\bar{F}_{2|1}(x_2|x_1)=1.$ Let us now assume that
  $x_2 \gt x_1 \gt 0.$ From the above discussion, we have
 \begin{align*}
\bar{F}_{2|1}(x_2|x_1)&=\int_{x_2}^{\infty}\frac{f_{1,2:2}(x_1,u)}{f_{1:2}(x_1)}du\\
&=(\alpha+1)\frac{\lambda_1\lambda_2}{\lambda_1+\lambda_2}(1+(\lambda_1+\lambda_2)x_1)^{\alpha+1}\\
&\quad \times \int_{x_2}^{\infty}\left[(1+\lambda_1x_1+\lambda_2u)^{-(\alpha+2)}+(1+\lambda_2x_1+\lambda_1u)^{-(\alpha+2)}\right]du\\
&=(\alpha+1)\frac{\lambda_1\lambda_2}{\lambda_1+\lambda_2}(1+(\lambda_1+\lambda_2)x_1)^{\alpha+1}\\
&\quad \times \left[\frac{(1+\lambda_1x_1+\lambda_2x_2)^{-(\alpha+1)}}{(\alpha+1)\lambda_2}
+\frac{(1+\lambda_2x_1+\lambda_1x_2)^{-(\alpha+1)}}{(\alpha+1)\lambda_1}\right]\\
&=\frac{\lambda_1}{\lambda_1+\lambda_2}\left[\frac{\displaystyle 1+(\lambda_1+\lambda_2)x_1}{\displaystyle 1+\lambda_1x_1+\lambda_2x_2}\right]^{\alpha+1}+\frac{\lambda_2}{\lambda_1+\lambda_2}\left[\frac{\displaystyle 1+(\lambda_1+\lambda_2)x_1}{\displaystyle 1+\lambda_2x_1+\lambda_1x_2}\right]^{\alpha+1}.
\end{align*}
\begin{align*}
\bar{F}_{2|1}(x_2|x_1)&=\int_{x_2}^{\infty}\frac{f_{1,2:2}(x_1,u)}{f_{1:2}(x_1)}du\\
&=(\alpha+1)\frac{\lambda_1\lambda_2}{\lambda_1+\lambda_2}(1+(\lambda_1+\lambda_2)x_1)^{\alpha+1}\\
&\quad \times \int_{x_2}^{\infty}\left[(1+\lambda_1x_1+\lambda_2u)^{-(\alpha+2)}+(1+\lambda_2x_1+\lambda_1u)^{-(\alpha+2)}\right]du\\
&=(\alpha+1)\frac{\lambda_1\lambda_2}{\lambda_1+\lambda_2}(1+(\lambda_1+\lambda_2)x_1)^{\alpha+1}\\
&\quad \times \left[\frac{(1+\lambda_1x_1+\lambda_2x_2)^{-(\alpha+1)}}{(\alpha+1)\lambda_2}
+\frac{(1+\lambda_2x_1+\lambda_1x_2)^{-(\alpha+1)}}{(\alpha+1)\lambda_1}\right]\\
&=\frac{\lambda_1}{\lambda_1+\lambda_2}\left[\frac{\displaystyle 1+(\lambda_1+\lambda_2)x_1}{\displaystyle 1+\lambda_1x_1+\lambda_2x_2}\right]^{\alpha+1}+\frac{\lambda_2}{\lambda_1+\lambda_2}\left[\frac{\displaystyle 1+(\lambda_1+\lambda_2)x_1}{\displaystyle 1+\lambda_2x_1+\lambda_1x_2}\right]^{\alpha+1}.
\end{align*} Therefore, the conditional survival function of  $X_{2:2},$ given
  $X_{1:2}=x_1(\in\mathbb{R}^+),$ is
 \begin{align}
\bar{F}_{2|1}(x_2|x_1)&=\left\{\frac{\lambda_1}{\lambda_1+\lambda_2}\left[\frac{\displaystyle 1+(\lambda_1+\lambda_2)x_1}{\displaystyle 1+\lambda_1x_1+\lambda_2x_2}\right]^{\alpha+1} \right.\nonumber\\
&\quad \left.+\frac{\lambda_2}{\lambda_1+\lambda_2}\left[\frac{\displaystyle 1+(\lambda_1+\lambda_2)x_1}{\displaystyle 1+\lambda_2x_1+\lambda_1x_2}\right]^{\alpha+1}\right\}I_{\{x_2 \gt x_1\}}+I_{\{x_1\ge x_2\}}.
\end{align}
\begin{align}
\bar{F}_{2|1}(x_2|x_1)&=\left\{\frac{\lambda_1}{\lambda_1+\lambda_2}\left[\frac{\displaystyle 1+(\lambda_1+\lambda_2)x_1}{\displaystyle 1+\lambda_1x_1+\lambda_2x_2}\right]^{\alpha+1} \right.\nonumber\\
&\quad \left.+\frac{\lambda_2}{\lambda_1+\lambda_2}\left[\frac{\displaystyle 1+(\lambda_1+\lambda_2)x_1}{\displaystyle 1+\lambda_2x_1+\lambda_1x_2}\right]^{\alpha+1}\right\}I_{\{x_2 \gt x_1\}}+I_{\{x_1\ge x_2\}}.
\end{align} Next, the survival function of the sample range,  $R_X=X_{2:2}-X_{1:2},$ can be obtained as
 \begin{align*}
\bar{F}_{R_X}(t)&=\int_{0}^{\infty}\mathbb{P}(X_{2:2}-X_{1:2} \gt t|X_{1:2}=x)f_{1:2}(x)dx\\
&=\int_{0}^{\infty}\bar{F}_{2|1}(t+x|x)f_{1:2}(x)dx\\
&=\int_{0}^{\infty}\left\{\frac{\lambda_1}{\lambda_1+\lambda_2}\left[\frac{\displaystyle 1+(\lambda_1+\lambda_2)x}{\displaystyle 1+\lambda_1x+\lambda_2(t+x)}\right]^{\alpha+1}+\frac{\lambda_2}{\lambda_1+\lambda_2}\left[\frac{\displaystyle 1+(\lambda_1+\lambda_2)x}{\displaystyle 1+\lambda_2x+\lambda_1(t+x)}\right]^{\alpha+1}\right\}\\
&\qquad\qquad\times\alpha(\lambda_1+\lambda_2)(1+(\lambda_1+\lambda_2)x)^{-(\alpha+1)}\,dx\\
&=\int_{0}^{\infty}\Bigg\{\alpha\lambda_1(1+(\lambda_1+\lambda_2)x+\lambda_1t)^{-(\alpha+1)}+\alpha\lambda_2(1+(\lambda_1+\lambda_2)x+\lambda_2t)^{-(\alpha+1)}\Bigg\}dx\\
&=\frac{\lambda_1(1+\lambda_2t)^{-\alpha}+\lambda_2(1+\lambda_1t)^{-\alpha}}{\lambda_1+\lambda_2},\qquad t\ge 0.
\end{align*}
\begin{align*}
\bar{F}_{R_X}(t)&=\int_{0}^{\infty}\mathbb{P}(X_{2:2}-X_{1:2} \gt t|X_{1:2}=x)f_{1:2}(x)dx\\
&=\int_{0}^{\infty}\bar{F}_{2|1}(t+x|x)f_{1:2}(x)dx\\
&=\int_{0}^{\infty}\left\{\frac{\lambda_1}{\lambda_1+\lambda_2}\left[\frac{\displaystyle 1+(\lambda_1+\lambda_2)x}{\displaystyle 1+\lambda_1x+\lambda_2(t+x)}\right]^{\alpha+1}+\frac{\lambda_2}{\lambda_1+\lambda_2}\left[\frac{\displaystyle 1+(\lambda_1+\lambda_2)x}{\displaystyle 1+\lambda_2x+\lambda_1(t+x)}\right]^{\alpha+1}\right\}\\
&\qquad\qquad\times\alpha(\lambda_1+\lambda_2)(1+(\lambda_1+\lambda_2)x)^{-(\alpha+1)}\,dx\\
&=\int_{0}^{\infty}\Bigg\{\alpha\lambda_1(1+(\lambda_1+\lambda_2)x+\lambda_1t)^{-(\alpha+1)}+\alpha\lambda_2(1+(\lambda_1+\lambda_2)x+\lambda_2t)^{-(\alpha+1)}\Bigg\}dx\\
&=\frac{\lambda_1(1+\lambda_2t)^{-\alpha}+\lambda_2(1+\lambda_1t)^{-\alpha}}{\lambda_1+\lambda_2},\qquad t\ge 0.
\end{align*} It is of interest to observe that this is the survival function of a two-component mixture of univariate Pareto  $(\alpha,\lambda_2)$ and Pareto
  $(\alpha,\lambda_1),$ variabels with mixing probabilities
  $\frac{\lambda_1}{\lambda_1+\lambda_2}$ and
  $\frac{\lambda_2}{\lambda_1+\lambda_2},$ respectively.
The probability density function of RX is then
 \begin{eqnarray*}
f_{R_X}(t)=\alpha\frac{\lambda_1\lambda_2\Big[(1+\lambda_1t)^{-(\alpha+1)}+(1+\lambda_2t)^{-(\alpha+1)}\Big]}{\lambda_1+\lambda_2},\qquad t\in\mathbb{R}^+.
\end{eqnarray*}
\begin{eqnarray*}
f_{R_X}(t)=\alpha\frac{\lambda_1\lambda_2\Big[(1+\lambda_1t)^{-(\alpha+1)}+(1+\lambda_2t)^{-(\alpha+1)}\Big]}{\lambda_1+\lambda_2},\qquad t\in\mathbb{R}^+.
\end{eqnarray*}Based on the above expressions, the hazard rate function of RX has the following form:
 \begin{eqnarray}
h_{R_X}(t)=\frac{\lambda_1\lambda_2\Big[(1+\lambda_1t)^{-(\alpha+1)}+(1+\lambda_2t)^{-(\alpha+1)}\Big]}{\lambda_1(1+\lambda_2t)^{-\alpha}+\lambda_2(1+\lambda_1t)^{-\alpha}},\qquad t\in\mathbb{R}^+.
\end{eqnarray}
\begin{eqnarray}
h_{R_X}(t)=\frac{\lambda_1\lambda_2\Big[(1+\lambda_1t)^{-(\alpha+1)}+(1+\lambda_2t)^{-(\alpha+1)}\Big]}{\lambda_1(1+\lambda_2t)^{-\alpha}+\lambda_2(1+\lambda_1t)^{-\alpha}},\qquad t\in\mathbb{R}^+.
\end{eqnarray}3. Main results
In this section, we consider stochastic comparisons of vectors of order statistics and sample ranges from bivariate Pareto distributions.
First, the following result deals with the usual bivariate stochastic order between the random vectors of order statistics.
Theorem 3.1. Assume that  $(X_1,X_2)\sim\mathcal{BP}(\alpha,\lambda_1,\lambda_2)$ and
  $(Y_1,Y_2)\sim\mathcal{BP}(\alpha,\mu_1,\mu_2).$ If
  $(\lambda_1,\lambda_2)\stackrel{m}{\succ}(\mu_1,\mu_2),$ then we have
  $(X_{1:2},X_{2:2})\ge_{st}(Y_{1:2},Y_{2:2}).$
Proof. According to Theorem 6.B.3 of Shaked and Shanthikumar [Reference Shaked and Shanthikumar28, p. 268], it is sufficient to show the following:
(i)
$X_{1:2}\ge_{st}Y_{1:2};$(ii)
$[X_{2:2}|X_{1:2}=x]\ge_{st}[Y_{2:2}|Y_{1:2}=x]$ for
$x \gt 0;$(iii)
$[X_{2:2}|X_{1:2}=x]\ge_{st}[X_{2:2}|X_{1:2}=x']$ for
$x \gt x' \gt 0.$


As  $\lambda_1+\lambda_2=\mu_1+\mu_2,$ it immediately follows that (i) holds. To prove (ii), it must be proved, for all
  $x\in\mathbb{R}^+$ and
  $y\in\mathbb{R},$ that
 \begin{eqnarray}
\mathbb{P}(X_{2:2} \gt y|X_{1:2}=x)\ge \mathbb{P}(Y_{2:2} \gt y|Y_{1:2}=x).
\end{eqnarray}
\begin{eqnarray}
\mathbb{P}(X_{2:2} \gt y|X_{1:2}=x)\ge \mathbb{P}(Y_{2:2} \gt y|Y_{1:2}=x).
\end{eqnarray} Note that (6) holds for  $x\ge y$ because both sides are equal to 1. Next, assume that
  $y \gt x.$ Consider the function
  $\phi:{\mathbb{R}^+}^2\rightarrow\mathbb{R}^+$ as follows:
 \begin{eqnarray*}
\phi(\lambda_1,\lambda_2)=\lambda_1\left[\frac{\displaystyle 1+(\lambda_1+\lambda_2)x}{\displaystyle 1+\lambda_1x+\lambda_2y}\right]^{\alpha+1}+\lambda_2\left[\frac{\displaystyle 1+(\lambda_1+\lambda_2)x}{\displaystyle 1+\lambda_2x+\lambda_1y}\right]^{\alpha+1}.
\end{eqnarray*}
\begin{eqnarray*}
\phi(\lambda_1,\lambda_2)=\lambda_1\left[\frac{\displaystyle 1+(\lambda_1+\lambda_2)x}{\displaystyle 1+\lambda_1x+\lambda_2y}\right]^{\alpha+1}+\lambda_2\left[\frac{\displaystyle 1+(\lambda_1+\lambda_2)x}{\displaystyle 1+\lambda_2x+\lambda_1y}\right]^{\alpha+1}.
\end{eqnarray*} If we could show that ϕ is Schur-convex over  ${\mathbb{R}^+}^2,$ then in view of (4), one may observe that the inequality in (6) also holds for
  $y \gt x.$ Clearly, ϕ is a symmetric function. Further, the partial derivative of
  $\phi(\lambda_1,\lambda_2)$ with respect to λ 1 is
 \begin{align*}
\partial_1\phi(\lambda_1,\lambda_2)&=\left[\frac{\displaystyle 1+(\lambda_1+\lambda_2)x}{\displaystyle 1+\lambda_1x+\lambda_2y}\right]^{\alpha+1}+(\alpha+1)\lambda_1\frac{\partial}{\partial\lambda_1}\left(\frac{\displaystyle 1+(\lambda_1+\lambda_2)x}{\displaystyle 1+\lambda_1x+\lambda_2y}\right)\left[\frac{\displaystyle 1+(\lambda_1+\lambda_2)x}{\displaystyle 1+\lambda_1x+\lambda_2y}\right]^{\alpha}\\
&\quad+(\alpha+1)\lambda_2\frac{\partial}{\partial\lambda_1}\left(\frac{\displaystyle 1+(\lambda_1+\lambda_2)x}{\displaystyle 1+\lambda_2x+\lambda_1y}\right)\left[\frac{\displaystyle 1+(\lambda_1+\lambda_2)x}{\displaystyle 1+\lambda_2x+\lambda_1y}\right]^{\alpha}\\
&=\left[\frac{\displaystyle 1+(\lambda_1+\lambda_2)x}{\displaystyle 1+\lambda_1x+\lambda_2y}\right]^{\alpha+1}+(\alpha+1)\lambda_1\lambda_2\frac{\displaystyle x(y-x)}{\displaystyle (1+\lambda_1x+\lambda_2y)^2}\left[\frac{\displaystyle 1+(\lambda_1+\lambda_2)x}{\displaystyle 1+\lambda_1x+\lambda_2y}\right]^{\alpha}\\
&\quad+(\alpha+1)\lambda_2\frac{\displaystyle (x-y)(1+\lambda_2x)}{\displaystyle (1+\lambda_2x+\lambda_1y)^2}\left[\frac{\displaystyle 1+(\lambda_1+\lambda_2)x}{\displaystyle 1+\lambda_2x+\lambda_1y}\right]^{\alpha}.
\end{align*}
\begin{align*}
\partial_1\phi(\lambda_1,\lambda_2)&=\left[\frac{\displaystyle 1+(\lambda_1+\lambda_2)x}{\displaystyle 1+\lambda_1x+\lambda_2y}\right]^{\alpha+1}+(\alpha+1)\lambda_1\frac{\partial}{\partial\lambda_1}\left(\frac{\displaystyle 1+(\lambda_1+\lambda_2)x}{\displaystyle 1+\lambda_1x+\lambda_2y}\right)\left[\frac{\displaystyle 1+(\lambda_1+\lambda_2)x}{\displaystyle 1+\lambda_1x+\lambda_2y}\right]^{\alpha}\\
&\quad+(\alpha+1)\lambda_2\frac{\partial}{\partial\lambda_1}\left(\frac{\displaystyle 1+(\lambda_1+\lambda_2)x}{\displaystyle 1+\lambda_2x+\lambda_1y}\right)\left[\frac{\displaystyle 1+(\lambda_1+\lambda_2)x}{\displaystyle 1+\lambda_2x+\lambda_1y}\right]^{\alpha}\\
&=\left[\frac{\displaystyle 1+(\lambda_1+\lambda_2)x}{\displaystyle 1+\lambda_1x+\lambda_2y}\right]^{\alpha+1}+(\alpha+1)\lambda_1\lambda_2\frac{\displaystyle x(y-x)}{\displaystyle (1+\lambda_1x+\lambda_2y)^2}\left[\frac{\displaystyle 1+(\lambda_1+\lambda_2)x}{\displaystyle 1+\lambda_1x+\lambda_2y}\right]^{\alpha}\\
&\quad+(\alpha+1)\lambda_2\frac{\displaystyle (x-y)(1+\lambda_2x)}{\displaystyle (1+\lambda_2x+\lambda_1y)^2}\left[\frac{\displaystyle 1+(\lambda_1+\lambda_2)x}{\displaystyle 1+\lambda_2x+\lambda_1y}\right]^{\alpha}.
\end{align*} Similarly, the partial derivative of  $\phi(\lambda_1,\lambda_2)$ with respect to λ 2 is
 \begin{align*}
\partial_2\phi(\lambda_1,\lambda_2)&=\left[\frac{\displaystyle 1+(\lambda_1+\lambda_2)x}{\displaystyle 1+\lambda_2x+\lambda_1y}\right]^{\alpha+1}+(\alpha+1)\lambda_1\lambda_2\frac{\displaystyle x(y-x)}{\displaystyle (1+\lambda_2x+\lambda_1y)^2}\left[\frac{\displaystyle 1+(\lambda_1+\lambda_2)x}{\displaystyle 1+\lambda_2x+\lambda_1y}\right]^{\alpha}\\
&\quad+(\alpha+1)\lambda_1\frac{\displaystyle (x-y)(1+\lambda_1x)}{\displaystyle (1+\lambda_1x+\lambda_2y)^2}\left[\frac{\displaystyle 1+(\lambda_1+\lambda_2)x}{\displaystyle 1+\lambda_1x+\lambda_2y}\right]^{\alpha}.
\end{align*}
\begin{align*}
\partial_2\phi(\lambda_1,\lambda_2)&=\left[\frac{\displaystyle 1+(\lambda_1+\lambda_2)x}{\displaystyle 1+\lambda_2x+\lambda_1y}\right]^{\alpha+1}+(\alpha+1)\lambda_1\lambda_2\frac{\displaystyle x(y-x)}{\displaystyle (1+\lambda_2x+\lambda_1y)^2}\left[\frac{\displaystyle 1+(\lambda_1+\lambda_2)x}{\displaystyle 1+\lambda_2x+\lambda_1y}\right]^{\alpha}\\
&\quad+(\alpha+1)\lambda_1\frac{\displaystyle (x-y)(1+\lambda_1x)}{\displaystyle (1+\lambda_1x+\lambda_2y)^2}\left[\frac{\displaystyle 1+(\lambda_1+\lambda_2)x}{\displaystyle 1+\lambda_1x+\lambda_2y}\right]^{\alpha}.
\end{align*}Now, we have
 \begin{eqnarray*}
\partial_1\phi(\lambda_1,\lambda_2)-\partial_2\phi(\lambda_1,\lambda_2)\stackrel{sgn}{=}\Theta_1+\Theta_2+\Theta_3,
\end{eqnarray*}
\begin{eqnarray*}
\partial_1\phi(\lambda_1,\lambda_2)-\partial_2\phi(\lambda_1,\lambda_2)\stackrel{sgn}{=}\Theta_1+\Theta_2+\Theta_3,
\end{eqnarray*}where
 \begin{align*}
\Theta_1&=(1+(\lambda_1+\lambda_2)x)^{\alpha+1}\Bigg[(1+\lambda_1x+\lambda_2y)^{-(\alpha+1)}-(1+\lambda_2x+\lambda_1y)^{-(\alpha+1)}\Bigg],\\
\Theta_2&=(\alpha+1)\lambda_1\lambda_2x(y-x)(1+(\lambda_1+\lambda_2)x)^{\alpha}\Bigg[(1+\lambda_1x+\lambda_2y)^{-(\alpha+2)}-(1+\lambda_2x+\lambda_1y)^{-(\alpha+2)}\Bigg],\\
\Theta_3&=(y-x)(1+(\lambda_1+\lambda_2)x)^{\alpha}\Bigg[\lambda_1(1+\lambda_1x)(1+\lambda_1x+\lambda_2y)^{-(\alpha+2)}\\
&\quad -\lambda_2(1+\lambda_2x)(1+\lambda_2x+\lambda_1y)^{-(\alpha+2)}\Bigg].
\end{align*}
\begin{align*}
\Theta_1&=(1+(\lambda_1+\lambda_2)x)^{\alpha+1}\Bigg[(1+\lambda_1x+\lambda_2y)^{-(\alpha+1)}-(1+\lambda_2x+\lambda_1y)^{-(\alpha+1)}\Bigg],\\
\Theta_2&=(\alpha+1)\lambda_1\lambda_2x(y-x)(1+(\lambda_1+\lambda_2)x)^{\alpha}\Bigg[(1+\lambda_1x+\lambda_2y)^{-(\alpha+2)}-(1+\lambda_2x+\lambda_1y)^{-(\alpha+2)}\Bigg],\\
\Theta_3&=(y-x)(1+(\lambda_1+\lambda_2)x)^{\alpha}\Bigg[\lambda_1(1+\lambda_1x)(1+\lambda_1x+\lambda_2y)^{-(\alpha+2)}\\
&\quad -\lambda_2(1+\lambda_2x)(1+\lambda_2x+\lambda_1y)^{-(\alpha+2)}\Bigg].
\end{align*} For  $\lambda_1\ge\lambda_2,$ one can see that
  $1+\lambda_1x+\lambda_2y\le1+\lambda_2x+\lambda_1y.$ From this, it immediately follows that
  $\Theta_i\ge0,$ for
  $i=1,2,3.$ Therefore, we obtain
 \begin{eqnarray*}
(\lambda_1-\lambda_2)(\partial_1\phi(\lambda_1,\lambda_2)-\partial_2\phi(\lambda_1,\lambda_2))\ge 0,
\end{eqnarray*}
\begin{eqnarray*}
(\lambda_1-\lambda_2)(\partial_1\phi(\lambda_1,\lambda_2)-\partial_2\phi(\lambda_1,\lambda_2))\ge 0,
\end{eqnarray*} which, based on Lemma 2.4, results in ϕ being Schur-convex over  ${\mathbb{R}^+}^2,$ as required. For both cases
  $x\ge x'\ge y$ and
  $x\ge y \gt x',$ (iii) is trivial. Set
 \begin{eqnarray*}
A_1(x)=\left[\frac{\displaystyle 1+(\lambda_1+\lambda_2)x}{\displaystyle 1+\lambda_1x+\lambda_2y}\right]^{\alpha+1}\quad\text{and}\quad A_2(x)=\left[\frac{\displaystyle 1+(\lambda_1+\lambda_2)x}{\displaystyle 1+\lambda_2x+\lambda_1y}\right]^{\alpha+1}.
\end{eqnarray*}
\begin{eqnarray*}
A_1(x)=\left[\frac{\displaystyle 1+(\lambda_1+\lambda_2)x}{\displaystyle 1+\lambda_1x+\lambda_2y}\right]^{\alpha+1}\quad\text{and}\quad A_2(x)=\left[\frac{\displaystyle 1+(\lambda_1+\lambda_2)x}{\displaystyle 1+\lambda_2x+\lambda_1y}\right]^{\alpha+1}.
\end{eqnarray*} Then, we have, for  $y \gt x\ge x',$
 \begin{align*}
\mathbb{P}(X_{2:2} \gt y|X_{1:2}=x)&=\frac{\lambda_1}{\lambda_1+\lambda_2}A_1(x)+\frac{\lambda_2}{\lambda_1+\lambda_2}A_2(x),\\
\mathbb{P}(X_{2:2} \gt y|X_{1:2}=x')&=\frac{\lambda_1}{\lambda_1+\lambda_2}A_1(x')+\frac{\lambda_2}{\lambda_1+\lambda_2}A_2(x').
\end{align*}
\begin{align*}
\mathbb{P}(X_{2:2} \gt y|X_{1:2}=x)&=\frac{\lambda_1}{\lambda_1+\lambda_2}A_1(x)+\frac{\lambda_2}{\lambda_1+\lambda_2}A_2(x),\\
\mathbb{P}(X_{2:2} \gt y|X_{1:2}=x')&=\frac{\lambda_1}{\lambda_1+\lambda_2}A_1(x')+\frac{\lambda_2}{\lambda_1+\lambda_2}A_2(x').
\end{align*} Both functions  $A_1(x)$ and
  $A_2(x)$ are increasing in
  $x\in (0,y].$ Hence, it follows that
  $A_1(x)\ge A_1(x')$ and
  $A_2(x)\ge A_2(x')$ for
  $y \gt x\ge x',$ which completes the proof of the theorem.
Corollary 3.2. Because the joint stochastic ordering implies the marginal stochastic orderings (see [Reference Shaked and Shanthikumar28]), the stochastic orderings of series system and parallel system comprising two dependent components having a bivariate Pareto distribution follow readily; see Naqvi et al. [Reference Naqvi, Ding and Zhao26], in this regard, for stochastic comparisons of parallel systems with independent Pareto components.
Corollary 3.3. Assume that  $(X_1,X_2)\sim\mathcal{BP}(\alpha,\lambda_1,\lambda_2).$ Due to Theorem 3.1, Part (a) of Theorem 6.B.16 of Shaked and Shanthikumar [Reference Shaked and Shanthikumar28, p. 273] and the fact that
  $(\lambda_1,\lambda_2)\stackrel{m}{\succ}(\bar{\lambda},\bar{\lambda}),$ where
  $\bar{\lambda}=(\lambda_1+\lambda_2)/2,$ we can obtain the following lower bound for the convolution of two random variables X1 and
  $X_2:$
 \begin{eqnarray*}
\mathbb{P}(X_1+X_2 \gt t)\ge (1+(\alpha+1)\bar{\lambda}t)(1+\bar{\lambda}t)^{-(\alpha+1)},\qquad t\ge 0.
\end{eqnarray*}
\begin{eqnarray*}
\mathbb{P}(X_1+X_2 \gt t)\ge (1+(\alpha+1)\bar{\lambda}t)(1+\bar{\lambda}t)^{-(\alpha+1)},\qquad t\ge 0.
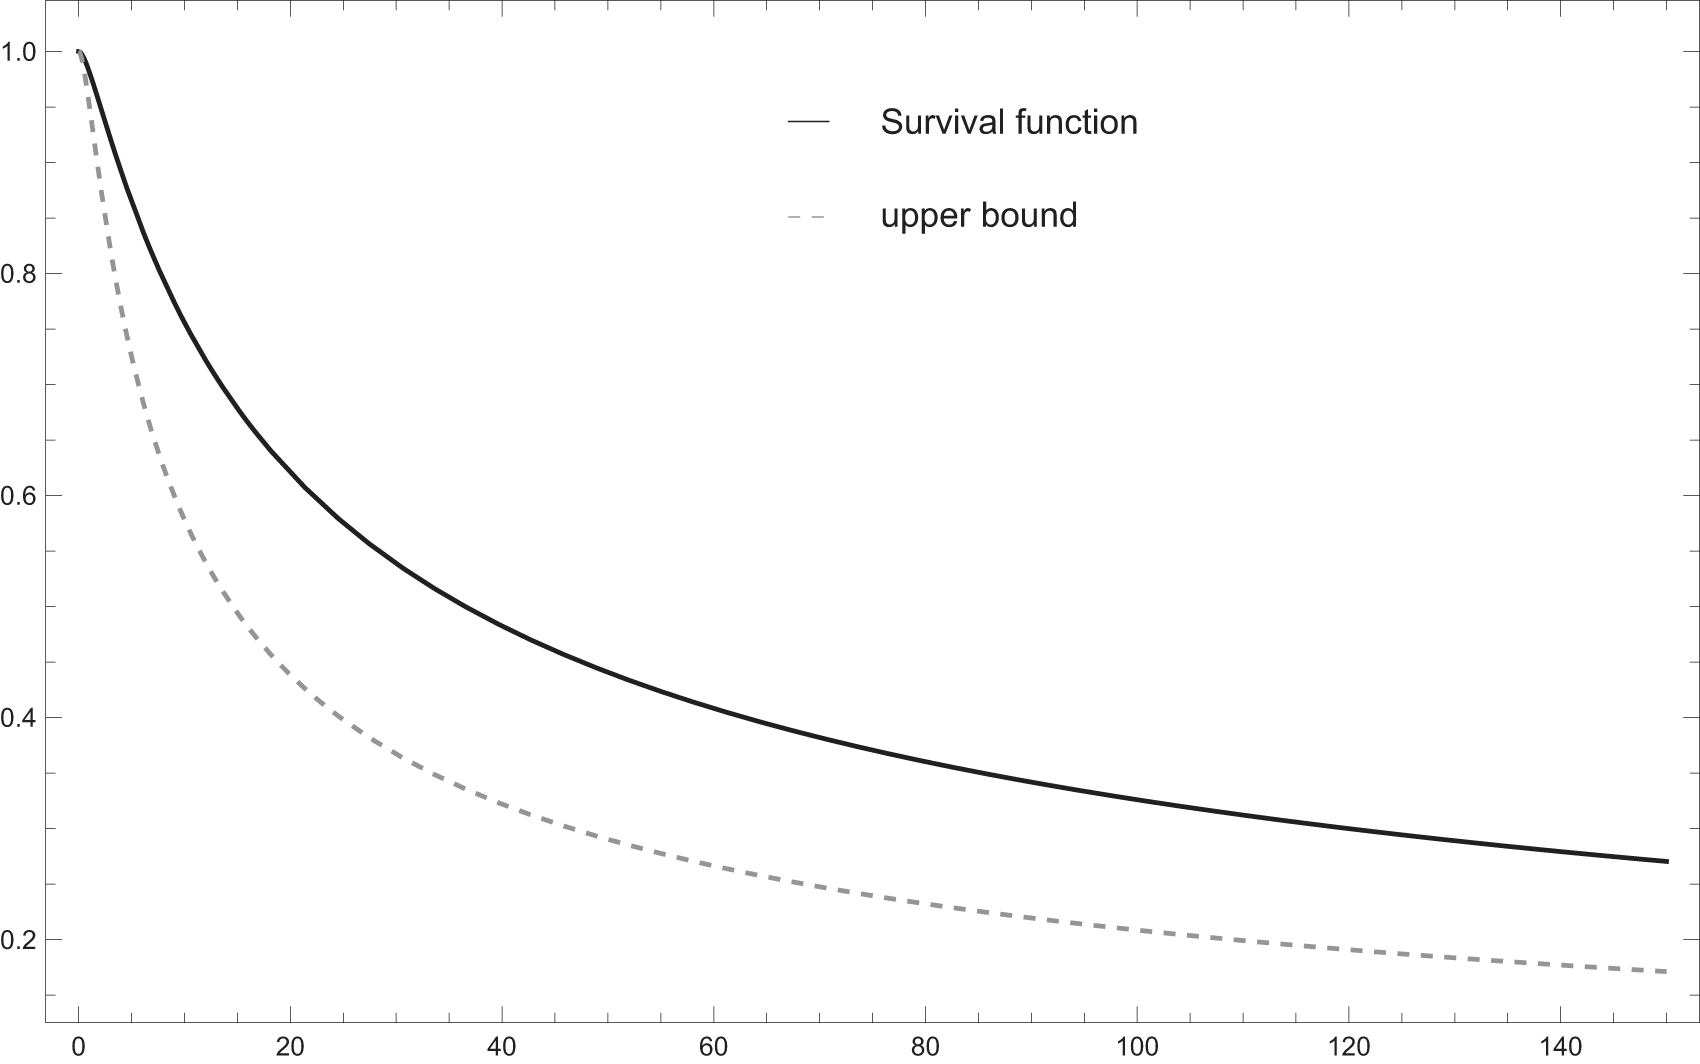
\end{eqnarray*}The result established in the above corollary is illustrated numerically in the next example.
Example 3.4. Assume that  $(X_1,X_2)\sim\mathcal{BP}(0.5,\lambda_1,\lambda_2),$ where
  $(\lambda_1,\lambda_2)=(0.9, 0.1).$ It is then easy to observe that
  $\bar{\lambda}=0.5.$ The survival function of
  $X_1+X_2$ and the bound given in Corollary 3.3 are plotted in Figure 1.
The next two theorems deal with characterization results on the stochastic orders between the sample ranges from bivariate Pareto distributions.
Theorem 3.5. Assume that  $(X_1,X_2)\sim\mathcal{BP}(\alpha,\lambda_1,\lambda_2)$ and
  $(Y_1,Y_2)\sim\mathcal{BP}(\alpha,\mu_1,\mu_2),$ where
  $\lambda_1\le\mu_1\le\mu_2\le\lambda_2.$ Then, the following three statements are equivalent:
(i)
$(\lambda_1,\lambda_2)\stackrel{rm}{\succ}(\mu_1,\mu_2);$(ii)
$R_X\ge_{hr}R_Y;$(ii)
$R_X\ge_{st}R_Y.$
Proof. (i) $\Rightarrow$(ii). By (5), the hazard rate functions of RX and RY can be expressed as, for
  $t\in\mathbb{R}^+,$
 \begin{eqnarray*}
h_{R_X}(t)=\frac{\alpha}{t}\psi(\lambda_1t,\lambda_2t)\qquad\text{and}\qquad h_{R_Y}(t)=\frac{\alpha}{t}\psi(\mu_1t,\mu_2t),
\end{eqnarray*}
\begin{eqnarray*}
h_{R_X}(t)=\frac{\alpha}{t}\psi(\lambda_1t,\lambda_2t)\qquad\text{and}\qquad h_{R_Y}(t)=\frac{\alpha}{t}\psi(\mu_1t,\mu_2t),
\end{eqnarray*} respectively, where  $\psi:\mathcal{E}^{+}_2\rightarrow\mathbb{R}^+$ is given by
 \begin{eqnarray*}
\psi(u_1,u_2)=u_1u_2\frac{(1+u_1)^{-(\alpha+1)}+(1+u_2)^{-(\alpha+1)}}{u_1(1+u_2)^{-\alpha}+u_2(1+u_1)^{-\alpha}}.
\end{eqnarray*}
\begin{eqnarray*}
\psi(u_1,u_2)=u_1u_2\frac{(1+u_1)^{-(\alpha+1)}+(1+u_2)^{-(\alpha+1)}}{u_1(1+u_2)^{-\alpha}+u_2(1+u_1)^{-\alpha}}.
\end{eqnarray*}Plots of the survival function of  $X_1+X_2$ and the lower bound for
  $(\lambda_1,\lambda_2)=(0.9, 0.1)$.

Due to the fact that  $(\lambda_1,\lambda_2)\stackrel{rm}{\succ}(\mu_1,\mu_2)$ if and only if
  $(\lambda_1t,\lambda_2t)\stackrel{rm}{\succ}(\mu_1t,\mu_2t)$ for
  $t\in\mathbb{R}^+,$ it is then enough to show that
  $\psi(u_1,u_2)\le\psi(v_1,v_2)$ whenever
  $(u_1,u_2)\stackrel{rm}{\succ}(v_1,v_2)$ and
  $u_1\le v_1\le v_2\le u_2.$ Note that
 \begin{align*}
\frac{1}{\psi(u_1,u_2)}&=\frac{u_1(1+u_2)^{-\alpha}+u_2(1+u_1)^{-\alpha}}{u_1u_2\Big[(1+u_1)^{-(\alpha+1)}+(1+u_2)^{-(\alpha+1)}\Big]}\\
&=\frac{(u_1+u_1u_2)(1+u_2)^{-(\alpha+1)}+(u_2+u_1u_2)(1+u_1)^{-(\alpha+1)}}{u_1u_2\Big[(1+u_1)^{-(\alpha+1)}+(1+u_2)^{-(\alpha+1)}\Big]}\\
&=\frac{1}{\varphi(u_1,u_2)}+1,
\end{align*}
\begin{align*}
\frac{1}{\psi(u_1,u_2)}&=\frac{u_1(1+u_2)^{-\alpha}+u_2(1+u_1)^{-\alpha}}{u_1u_2\Big[(1+u_1)^{-(\alpha+1)}+(1+u_2)^{-(\alpha+1)}\Big]}\\
&=\frac{(u_1+u_1u_2)(1+u_2)^{-(\alpha+1)}+(u_2+u_1u_2)(1+u_1)^{-(\alpha+1)}}{u_1u_2\Big[(1+u_1)^{-(\alpha+1)}+(1+u_2)^{-(\alpha+1)}\Big]}\\
&=\frac{1}{\varphi(u_1,u_2)}+1,
\end{align*} where  $\varphi:\mathcal{E}^{+}_2\rightarrow\mathbb{R}^+$ is given by
 \begin{eqnarray*}
\varphi(u_1,u_2)=\frac{u_1u_2\Big[(1+u_1)^{-(\alpha+1)}+(1+u_2)^{-(\alpha+1)}\Big]}{u_1(1+u_2)^{-(\alpha+1)}+u_2(1+u_1)^{-(\alpha+1)}}.
\end{eqnarray*}
\begin{eqnarray*}
\varphi(u_1,u_2)=\frac{u_1u_2\Big[(1+u_1)^{-(\alpha+1)}+(1+u_2)^{-(\alpha+1)}\Big]}{u_1(1+u_2)^{-(\alpha+1)}+u_2(1+u_1)^{-(\alpha+1)}}.
\end{eqnarray*} Therefore, if we could show that  $\varphi(u_1,u_2)\le\varphi(v_1,v_2)$ whenever
  $(u_1,u_2)\stackrel{rm}{\succ}(v_1,v_2)$ and
  $u_1\le v_1\le v_2\le u_2,$ then the conclusion would readily follow. To this end, we shall use Part (ii) of Lemma 2.5 to show that
  $\varphi(u_1,u_2)$ is increasing along the vectors
  $(1,0)$ and
  $(u^2_1,-u^2_2).$ Let the denominator of φ be denoted by
  $D.$ Now, taking derivative of
  $\varphi(u_1,u_2)$ with respect to
  $u_1,$ we have
 \begin{align*}
D^2\partial_1\varphi(u_1,u_2)&=\Bigg\{u_2\Big[(1+u_1)^{-(\alpha+1)}+(1+u_2)^{-(\alpha+1)}\Big]-(\alpha+1)u_1u_2(1+u_1)^{-(\alpha+2)}\Bigg\}\\
&\quad \times \Big[u_1(1+u_2)^{-(\alpha+1)}+u_2(1+u_1)^{-(\alpha+1)}\Big]\\
&\quad-u_1u_2\Big[(1+u_2)^{-(\alpha+1)}-(\alpha+1)u_2(1+u_1)^{-(\alpha+2)}\Big]\\
&\quad \times \Big[(1+u_1)^{-(\alpha+1)}+(1+u_2)^{-(\alpha+1)}\Big]\\
&=u_2\Bigg\{u_2(1+u_1)^{-(\alpha+1)}\Big[(1+u_1)^{-(\alpha+1)}+(1+u_2)^{-(\alpha+1)}\Big]\\
&\quad +(\alpha+1)u_1(u_2-u_1)(1+u_1)^{-(\alpha+2)}(1+u_2)^{-(\alpha+1)}\Bigg\}.
\end{align*}
\begin{align*}
D^2\partial_1\varphi(u_1,u_2)&=\Bigg\{u_2\Big[(1+u_1)^{-(\alpha+1)}+(1+u_2)^{-(\alpha+1)}\Big]-(\alpha+1)u_1u_2(1+u_1)^{-(\alpha+2)}\Bigg\}\\
&\quad \times \Big[u_1(1+u_2)^{-(\alpha+1)}+u_2(1+u_1)^{-(\alpha+1)}\Big]\\
&\quad-u_1u_2\Big[(1+u_2)^{-(\alpha+1)}-(\alpha+1)u_2(1+u_1)^{-(\alpha+2)}\Big]\\
&\quad \times \Big[(1+u_1)^{-(\alpha+1)}+(1+u_2)^{-(\alpha+1)}\Big]\\
&=u_2\Bigg\{u_2(1+u_1)^{-(\alpha+1)}\Big[(1+u_1)^{-(\alpha+1)}+(1+u_2)^{-(\alpha+1)}\Big]\\
&\quad +(\alpha+1)u_1(u_2-u_1)(1+u_1)^{-(\alpha+2)}(1+u_2)^{-(\alpha+1)}\Bigg\}.
\end{align*}Similarly, we have
 \begin{align*}
D^2\partial_2\varphi(u_1,u_2)&=u_1\Bigg\{u_1(1+u_2)^{-(\alpha+1)}\Big[(1+u_1)^{-(\alpha+1)}+(1+u_2)^{-\alpha}\Big]\\
&\quad +(\alpha+1)u_2(u_1-u_2)(1+u_1)^{-(\alpha+1)}(1+u_2)^{-(\alpha+2)}\Bigg\}
\end{align*}
\begin{align*}
D^2\partial_2\varphi(u_1,u_2)&=u_1\Bigg\{u_1(1+u_2)^{-(\alpha+1)}\Big[(1+u_1)^{-(\alpha+1)}+(1+u_2)^{-\alpha}\Big]\\
&\quad +(\alpha+1)u_2(u_1-u_2)(1+u_1)^{-(\alpha+1)}(1+u_2)^{-(\alpha+2)}\Bigg\}
\end{align*} Hence,  $\varphi(u_1,u_2)$ is increasing along the vector
  $(1,0)$ because, by
  $u_1\le u_2,$ the gradient of
  $\varphi(u_1,u_2)$ along the vector
  $(1,0)$ satisfies
 \begin{align*}
\nabla_{(1,0)}\varphi(u_1,u_2)&=\partial_1\varphi(u_1,u_2)\\
&\stackrel{sgn}{=}u_2(1+u_1)^{-(\alpha+1)}\Big[(1+u_1)^{-(\alpha+1)}+(1+u_2)^{-\alpha}\Big]\\
&\quad +(\alpha+1)u_1(u_2-u_1)(1+u_1)^{-(\alpha+2)}(1+u_2)^{-(\alpha+1)}\\
&\ge 0.
\end{align*}
\begin{align*}
\nabla_{(1,0)}\varphi(u_1,u_2)&=\partial_1\varphi(u_1,u_2)\\
&\stackrel{sgn}{=}u_2(1+u_1)^{-(\alpha+1)}\Big[(1+u_1)^{-(\alpha+1)}+(1+u_2)^{-\alpha}\Big]\\
&\quad +(\alpha+1)u_1(u_2-u_1)(1+u_1)^{-(\alpha+2)}(1+u_2)^{-(\alpha+1)}\\
&\ge 0.
\end{align*} Moreover, by the assumption that  $u_1\le u_2$ and the fact that
  $(1+x)^{-(\alpha+1)}$ is decreasing in
 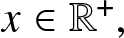 $x\in\mathbb{R}^+,$ the gradient of
 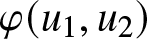 $\varphi(u_1,u_2)$ along the vector
 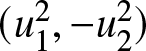 $(u^2_1,-u^2_2)$ satisfies
 \begin{align*}
\nabla_{(u^2_1,-u^2_2)}\varphi(u_1,u_2)&=u^2_1\partial_1\varphi(u_1,u_2)-u^2_2\partial_2\varphi(u_1,u_2)\\
&\stackrel{sgn}{=}u^2_1u^2_2\Big[(1+u_1)^{-(\alpha+1)}-(1+u_2)^{-(\alpha+1)}\Big]\Big[(1+u_1)^{-(\alpha+1)}+(1+u_2)^{-(\alpha+1)}\Big]\\
&\quad (\alpha+1)u_1u_2(u_2-u_1)(1+u_1)^{-(\alpha+2)}(1+u_2)^{-(\alpha+2)}\Big[u^2_1(1+u_2)+u^2_2(1+u_1)\Big]\\
&\ge 0,
\end{align*}
\begin{align*}
\nabla_{(u^2_1,-u^2_2)}\varphi(u_1,u_2)&=u^2_1\partial_1\varphi(u_1,u_2)-u^2_2\partial_2\varphi(u_1,u_2)\\
&\stackrel{sgn}{=}u^2_1u^2_2\Big[(1+u_1)^{-(\alpha+1)}-(1+u_2)^{-(\alpha+1)}\Big]\Big[(1+u_1)^{-(\alpha+1)}+(1+u_2)^{-(\alpha+1)}\Big]\\
&\quad (\alpha+1)u_1u_2(u_2-u_1)(1+u_1)^{-(\alpha+2)}(1+u_2)^{-(\alpha+2)}\Big[u^2_1(1+u_2)+u^2_2(1+u_1)\Big]\\
&\ge 0,
\end{align*}as required.
(ii) $\Rightarrow$(iii). This is trivial because the hazard rate order implies the usual stochastic order.
(iii) $\Rightarrow$(i). For
  $t\in\mathbb{R}^+,$ we have
 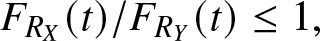 $F_{R_X}(t)/F_{R_Y}(t)\le 1,$ and so
  $\lim_{t\rightarrow 0} F_{R_X}(t)/F_{R_Y}(t)\le 1.$ Now, by using L’Hospital’s rule, we find that
 \begin{align*}
\lim_{t\rightarrow 0}\frac{F_{R_X}(t)}{F_{R_Y}(t)}&=\lim_{t\rightarrow 0}\frac{\displaystyle 1-\frac{\lambda_1(1+\lambda_2t)^{-\alpha}+\lambda_2(1+\lambda_1t)^{-\alpha}}{\lambda_1+\lambda_2}}{\displaystyle 1-\frac{\mu_1(1+\mu_2t)^{-\alpha}+\mu_2(1+\mu_1t)^{-\alpha}}{\mu_1+\mu_2}}\\
&=\frac{\mu_1+\mu_2}{\lambda_1+\lambda_2}\lim_{t\rightarrow 0}\frac{\alpha\lambda_1\lambda_2(1+\lambda_2t)^{-(\alpha+1)}+\alpha\lambda_1\lambda_2(1+\lambda_1t)^{-(\alpha+1)}}
{\alpha\mu_2\mu_1(1+\mu_2t)^{-(\alpha+1)}+\alpha\mu_2\mu_1(1+\mu_1t)^{-(\alpha+1)}}\\
&=\frac{2\lambda_1\lambda_2(\mu_1+\mu_2)}{2\mu_1\mu_2(\lambda_1+\lambda_2)}\\
&\le 1,
\end{align*}
\begin{align*}
\lim_{t\rightarrow 0}\frac{F_{R_X}(t)}{F_{R_Y}(t)}&=\lim_{t\rightarrow 0}\frac{\displaystyle 1-\frac{\lambda_1(1+\lambda_2t)^{-\alpha}+\lambda_2(1+\lambda_1t)^{-\alpha}}{\lambda_1+\lambda_2}}{\displaystyle 1-\frac{\mu_1(1+\mu_2t)^{-\alpha}+\mu_2(1+\mu_1t)^{-\alpha}}{\mu_1+\mu_2}}\\
&=\frac{\mu_1+\mu_2}{\lambda_1+\lambda_2}\lim_{t\rightarrow 0}\frac{\alpha\lambda_1\lambda_2(1+\lambda_2t)^{-(\alpha+1)}+\alpha\lambda_1\lambda_2(1+\lambda_1t)^{-(\alpha+1)}}
{\alpha\mu_2\mu_1(1+\mu_2t)^{-(\alpha+1)}+\alpha\mu_2\mu_1(1+\mu_1t)^{-(\alpha+1)}}\\
&=\frac{2\lambda_1\lambda_2(\mu_1+\mu_2)}{2\mu_1\mu_2(\lambda_1+\lambda_2)}\\
&\le 1,
\end{align*} which results in  $1/\lambda_1+1/\lambda_2\ge 1/\mu_1+1/\mu_2,$ completing the proof of the theorem.
Theorem 3.6 Assume that  $(X_1,X_2)\sim\mathcal{BP}(\alpha,\lambda_1,\lambda_2)$ and
  $(Y_1,Y_2)\sim\mathcal{BP}(\alpha,\mu_1,\mu_2),$ where
  $\lambda_1\le\mu_1\le\mu_2\le\lambda_2.$ Then, the following three statements are equivalent:
(i)
$(\lambda_1,\lambda_2)\stackrel{w}{\succ}(\mu_1,\mu_2);$(ii)
$R_X\ge_{lr}R_Y;$(iii)
$R_X\ge_{rh}R_Y.$
Proof. (i) $\Rightarrow$(ii). We must show that
  $f'_{R_X}(t)/f_{R_X}(t)\ge f'_{R_Y}(t)/f_{R_Y}(t)$ for all
  $t\in\mathbb{R}^+,$ where
 \begin{align*}
\frac{f'_{R_X}(t)}{f_{R_X}(t)}&=-(\alpha+1)\frac{\lambda_1(1+\lambda_1t)^{-(\alpha+2)}+\lambda_2(1+\lambda_2t)^{-(\alpha+2)}}{(1+\lambda_1t)^{-(\alpha+1)}+(1+\lambda_2t)^{-(\alpha+1)}},\\
\frac{f'_{R_Y}(t)}{f_{R_Y}(t)}&=-(\alpha+1)\frac{\mu_1(1+\mu_1t)^{-(\alpha+2)}+\mu_2(1+\mu_2t)^{-(\alpha+2)}}{(1+\mu_1t)^{-(\alpha+1)}+(1+\mu_2t)^{-(\alpha+1)}}.
\end{align*}
\begin{align*}
\frac{f'_{R_X}(t)}{f_{R_X}(t)}&=-(\alpha+1)\frac{\lambda_1(1+\lambda_1t)^{-(\alpha+2)}+\lambda_2(1+\lambda_2t)^{-(\alpha+2)}}{(1+\lambda_1t)^{-(\alpha+1)}+(1+\lambda_2t)^{-(\alpha+1)}},\\
\frac{f'_{R_Y}(t)}{f_{R_Y}(t)}&=-(\alpha+1)\frac{\mu_1(1+\mu_1t)^{-(\alpha+2)}+\mu_2(1+\mu_2t)^{-(\alpha+2)}}{(1+\mu_1t)^{-(\alpha+1)}+(1+\mu_2t)^{-(\alpha+1)}}.
\end{align*} It is easy to see that  $(\lambda_1,\lambda_2)\stackrel{w}{\succ}(\mu_1,\mu_2)$ if and only if
  $(\lambda_1t,\lambda_2t)\stackrel{w}{\succ}(\mu_1t,\mu_2t)$ for
  $t\in\mathbb{R}^+.$ Using this, one may deduce that the conclusion would follow if we could show that
  $\Psi(\lambda_1,\lambda_2)\le\Psi(\mu_1,\mu_2)$ whenever
  $(u_1,u_2)\stackrel{w}{\succ}(v_1,v_2)$ and
  $u_1\le v_1\le v_2\le u_2,$ where the function
  $\Psi:\mathcal{E}^+_2\rightarrow\mathbb{R}^+$ is given by
 \begin{eqnarray*}
\Psi(u_1,u_2)=\frac{u_1(1+u_1)^{-(\alpha+2)}+u_2(1+u_2)^{-(\alpha+2)}}{(1+u_1)^{-(\alpha+1)}+(1+u_2)^{-(\alpha+1)}}.
\end{eqnarray*}
\begin{eqnarray*}
\Psi(u_1,u_2)=\frac{u_1(1+u_1)^{-(\alpha+2)}+u_2(1+u_2)^{-(\alpha+2)}}{(1+u_1)^{-(\alpha+1)}+(1+u_2)^{-(\alpha+1)}}.
\end{eqnarray*}Note that
 \begin{align*}
\frac{1}{\Psi(u_1,u_2)}&=\frac{(1+u_1)^{-(\alpha+1)}+(1+u_2)^{-(\alpha+1)}}{u_1(1+u_1)^{-(\alpha+2)}+u_2(1+u_2)^{-(\alpha+2)}}\\
&=\frac{(1+u_1)^{-(\alpha+2)}+(1+u_2)^{-(\alpha+2)}+u_1(1+u_1)^{-(\alpha+2)}+u_2(1+u_2)^{-(\alpha+2)}}{u_1(1+u_1)^{-(\alpha+2)}+u_2(1+u_2)^{-(\alpha+2)}}\\
&=\frac{1}{\Xi(u_1,u_2)}+1,
\end{align*}
\begin{align*}
\frac{1}{\Psi(u_1,u_2)}&=\frac{(1+u_1)^{-(\alpha+1)}+(1+u_2)^{-(\alpha+1)}}{u_1(1+u_1)^{-(\alpha+2)}+u_2(1+u_2)^{-(\alpha+2)}}\\
&=\frac{(1+u_1)^{-(\alpha+2)}+(1+u_2)^{-(\alpha+2)}+u_1(1+u_1)^{-(\alpha+2)}+u_2(1+u_2)^{-(\alpha+2)}}{u_1(1+u_1)^{-(\alpha+2)}+u_2(1+u_2)^{-(\alpha+2)}}\\
&=\frac{1}{\Xi(u_1,u_2)}+1,
\end{align*} where  $\Xi:\mathcal{E}^+_2\rightarrow\mathbb{R}^+$ is given by
 \begin{eqnarray*}
\Xi(u_1,u_2)=\frac{u_1(1+u_1)^{-(\alpha+2)}+u_2(1+u_2)^{-(\alpha+2)}}{(1+u_1)^{-(\alpha+2)}+(1+u_2)^{-(\alpha+2)}}.
\end{eqnarray*}
\begin{eqnarray*}
\Xi(u_1,u_2)=\frac{u_1(1+u_1)^{-(\alpha+2)}+u_2(1+u_2)^{-(\alpha+2)}}{(1+u_1)^{-(\alpha+2)}+(1+u_2)^{-(\alpha+2)}}.
\end{eqnarray*} So, if we could show that  $\Xi(u_1,u_2)\le\Xi(v_1,v_2)$ whenever
  $(u_1,u_2)\stackrel{w}{\succ}(v_1,v_2)$ and
  $u_1\le v_1\le v_2\le u_2,$ then the desired result would follow. For this purpose, we shall utilize Part (i) of Lemma 2.5 to prove that
  $\Xi(u_1,u_2)$ is increasing along the vectors
  $(1,0)$ and
  $(1,-1).$ Let the denominator of φ be denoted by
  $D.$ The partial derivative of
  $\Xi(u_1,u_2)$ with respect to u 1 is
 \begin{align*}
D^2\partial_1\Xi(u_1,u_2)&=\Big[(1+u_1)^{-(\alpha+2)}-(\alpha+2)u_1(1+u_1)^{-(\alpha+3)}\Big]\Big[(1+u_1)^{-(\alpha+2)}+(1+u_2)^{-(\alpha+2)}\Big]\\
&\quad+(\alpha+2)(1+u_1)^{-(\alpha+3)}\Big[u_1(1+u_1)^{-(\alpha+2)}+u_2(1+u_2)^{-(\alpha+2)}\Big]\\
&=(1+u_1)^{-(\alpha+2)}\Big[(1+u_1)^{-(\alpha+2)}+(1+u_2)^{-(\alpha+2)}\Big]\\
&\quad+(\alpha+2)(u_2-u_1)(1+u_1)^{-(\alpha+3)}(1+u_2)^{-(\alpha+2)}.
\end{align*}
\begin{align*}
D^2\partial_1\Xi(u_1,u_2)&=\Big[(1+u_1)^{-(\alpha+2)}-(\alpha+2)u_1(1+u_1)^{-(\alpha+3)}\Big]\Big[(1+u_1)^{-(\alpha+2)}+(1+u_2)^{-(\alpha+2)}\Big]\\
&\quad+(\alpha+2)(1+u_1)^{-(\alpha+3)}\Big[u_1(1+u_1)^{-(\alpha+2)}+u_2(1+u_2)^{-(\alpha+2)}\Big]\\
&=(1+u_1)^{-(\alpha+2)}\Big[(1+u_1)^{-(\alpha+2)}+(1+u_2)^{-(\alpha+2)}\Big]\\
&\quad+(\alpha+2)(u_2-u_1)(1+u_1)^{-(\alpha+3)}(1+u_2)^{-(\alpha+2)}.
\end{align*} Similarly, the partial derivative of  $\Xi(u_1,u_2)$ with respect to u 2 is
 \begin{align*}
D^2\partial_2\Xi(u_1,u_2)&=(1+u_2)^{-(\alpha+2)}\Big[(1+u_1)^{-(\alpha+2)}+(1+u_2)^{-(\alpha+2)}\Big]\\
&\quad +(\alpha+2)(u_1-u_2)(1+u_1)^{-(\alpha+2)}(1+u_2)^{-(\alpha+3)}.
\end{align*}
\begin{align*}
D^2\partial_2\Xi(u_1,u_2)&=(1+u_2)^{-(\alpha+2)}\Big[(1+u_1)^{-(\alpha+2)}+(1+u_2)^{-(\alpha+2)}\Big]\\
&\quad +(\alpha+2)(u_1-u_2)(1+u_1)^{-(\alpha+2)}(1+u_2)^{-(\alpha+3)}.
\end{align*} Now, the gradient of  $\Xi(u_1,u_2)$ along the vector
  $(1,0)$ is
 \begin{align*}
\nabla_{(1,0)}\Xi(u_1,u_2)&=\partial_1\Xi(u_1,u_2)\\
&\stackrel{sgn}{=}(1+u_1)^{-(\alpha+2)}\Big[(1+u_1)^{-(\alpha+2)}+(1+u_2)^{-(\alpha+2)}\Big]\\
&\quad +(\alpha+2)(u_2-u_1)(1+u_1)^{-(\alpha+3)}(1+u_2)^{-(\alpha+2)}.
\end{align*}
\begin{align*}
\nabla_{(1,0)}\Xi(u_1,u_2)&=\partial_1\Xi(u_1,u_2)\\
&\stackrel{sgn}{=}(1+u_1)^{-(\alpha+2)}\Big[(1+u_1)^{-(\alpha+2)}+(1+u_2)^{-(\alpha+2)}\Big]\\
&\quad +(\alpha+2)(u_2-u_1)(1+u_1)^{-(\alpha+3)}(1+u_2)^{-(\alpha+2)}.
\end{align*} As  $u_1\le u_2$, it readily follows that
  $\nabla_{(1,0)}\Xi(u_1,u_2)\ge 0,$ that is,
  $\Xi(u_1,u_2)$ is increasing along the vector
  $(1,0).$ Further, the gradient of
  $\Xi(u_1,u_2)$ along the vector
  $(1,-1)$ is
 \begin{align*}
\nabla_{(1,-1)}\Xi(u_1,u_2)&=\partial_1\Xi(u_1,u_2)-\partial_2\Xi(u_1,u_2)\\
&\stackrel{sgn}{=}\Big[(1+u_1)^{-(\alpha+2)}-(1+u_2)^{-(\alpha+2)}\Big]\Big[(1+u_1)^{-(\alpha+2)}+(1+u_2)^{-(\alpha+2)}\Big]\\
&\qquad+(\alpha+2)(u_2-u_1)(2+u_1+u_2)(1+u_1)^{-(\alpha+3)}(1+u_2)^{-(\alpha+3)}.
\end{align*}
\begin{align*}
\nabla_{(1,-1)}\Xi(u_1,u_2)&=\partial_1\Xi(u_1,u_2)-\partial_2\Xi(u_1,u_2)\\
&\stackrel{sgn}{=}\Big[(1+u_1)^{-(\alpha+2)}-(1+u_2)^{-(\alpha+2)}\Big]\Big[(1+u_1)^{-(\alpha+2)}+(1+u_2)^{-(\alpha+2)}\Big]\\
&\qquad+(\alpha+2)(u_2-u_1)(2+u_1+u_2)(1+u_1)^{-(\alpha+3)}(1+u_2)^{-(\alpha+3)}.
\end{align*} From the assumption that  $u_1\le u_2$ once again and the fact that
  $(1+x)^{-(\alpha+2)}$ is decreasing in
  $x\in\mathbb{R}^+,$ we find that
  $\nabla_{(1,-1)}\Xi(u_1,u_2)\ge 0.$ Consequently,
  $\Xi(u_1,u_2)$ is also increasing along the vector
  $(1,-1),$ as desired.
(ii) $\Rightarrow$(iii). This is trivial because the likelihood ratio order implies the reversed hazard rate order.
(iii) $\Rightarrow$(i). Using Taylor expansion at the origin, the reversed hazard rate functions of RX and RY can be rewritten as
 \begin{align*}
\tilde{r}_{R_X}(t)&=\frac{\displaystyle\alpha\lambda_1\lambda_2\Big[(1+\lambda_1t)^{-(\alpha+1)}+(1+\lambda_2t)^{-(\alpha+1)}\Big]}{\displaystyle \lambda_1+\lambda_2-\Big[\lambda_1(1+\lambda_2t)^{-\alpha}+\lambda_2(1+\lambda_1t)^{-\alpha}\Big]}\\
&=\frac{1}{t}+\frac{\displaystyle -\binom{\alpha+1}{2}(\lambda_1+\lambda_2)+o(1)}{\displaystyle 2\alpha+o(1)},\qquad t\in\mathbb{R}^+,
\end{align*}
\begin{align*}
\tilde{r}_{R_X}(t)&=\frac{\displaystyle\alpha\lambda_1\lambda_2\Big[(1+\lambda_1t)^{-(\alpha+1)}+(1+\lambda_2t)^{-(\alpha+1)}\Big]}{\displaystyle \lambda_1+\lambda_2-\Big[\lambda_1(1+\lambda_2t)^{-\alpha}+\lambda_2(1+\lambda_1t)^{-\alpha}\Big]}\\
&=\frac{1}{t}+\frac{\displaystyle -\binom{\alpha+1}{2}(\lambda_1+\lambda_2)+o(1)}{\displaystyle 2\alpha+o(1)},\qquad t\in\mathbb{R}^+,
\end{align*}and
 \begin{align*}
\tilde{r}_{R_X}(t)&=\frac{\displaystyle\alpha\mu_1\mu_2\Big[(1+\mu_1t)^{-(\alpha+1)}+(1+\mu_2t)^{-(\alpha+1)}\Big]}{\displaystyle \mu_1+\mu_2-\Big[\mu_1(1+\mu_2t)^{-\alpha}+\mu_2(1+\mu_1t)^{-\alpha}\Big]}\\
&=\frac{1}{t}+\frac{\displaystyle -\binom{\alpha+1}{2}(\mu_1+\mu_2)+o(1)}{\displaystyle 2\alpha+o(1)},\qquad t\in\mathbb{R}^+,
\end{align*}
\begin{align*}
\tilde{r}_{R_X}(t)&=\frac{\displaystyle\alpha\mu_1\mu_2\Big[(1+\mu_1t)^{-(\alpha+1)}+(1+\mu_2t)^{-(\alpha+1)}\Big]}{\displaystyle \mu_1+\mu_2-\Big[\mu_1(1+\mu_2t)^{-\alpha}+\mu_2(1+\mu_1t)^{-\alpha}\Big]}\\
&=\frac{1}{t}+\frac{\displaystyle -\binom{\alpha+1}{2}(\mu_1+\mu_2)+o(1)}{\displaystyle 2\alpha+o(1)},\qquad t\in\mathbb{R}^+,
\end{align*} respectively. Now, from the above expressions and the ordering  $R_X\ge_{rh}R_Y,$ it follows that
  $\tilde{r}_{R_X}(t)\ge\tilde{r}_{R_Y}(t)$ for all
  $t\in\mathbb{R}^+,$ or equivalently,
 \begin{eqnarray*}
\frac{\displaystyle -\binom{\alpha+1}{2}(\lambda_1+\lambda_2)+o(1)}{\displaystyle 2\alpha+o(1)}\ge\frac{\displaystyle -\binom{\alpha+1}{2}(\mu_1+\mu_2)+o(1)}{\displaystyle 2\alpha+o(1)},\qquad t\in\mathbb{R}^+.
\end{eqnarray*}
\begin{eqnarray*}
\frac{\displaystyle -\binom{\alpha+1}{2}(\lambda_1+\lambda_2)+o(1)}{\displaystyle 2\alpha+o(1)}\ge\frac{\displaystyle -\binom{\alpha+1}{2}(\mu_1+\mu_2)+o(1)}{\displaystyle 2\alpha+o(1)},\qquad t\in\mathbb{R}^+.
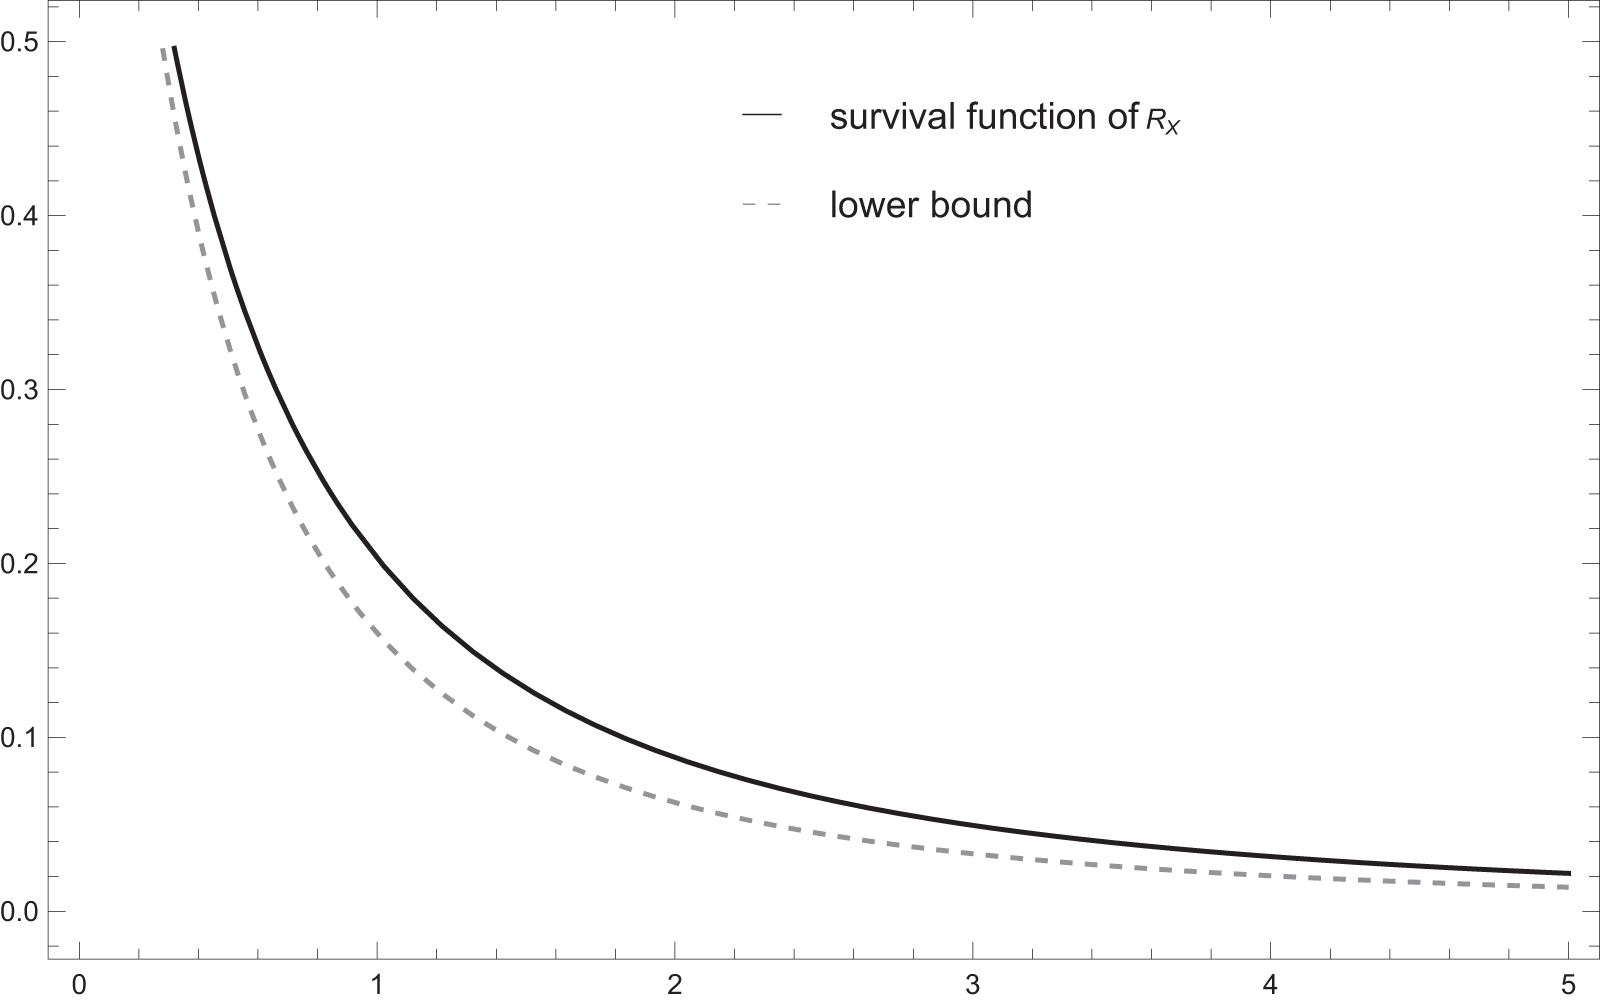
\end{eqnarray*}Plots of the survival function of RX and the lower bound for  $(\lambda_1,\lambda_2)=(1,3)$.

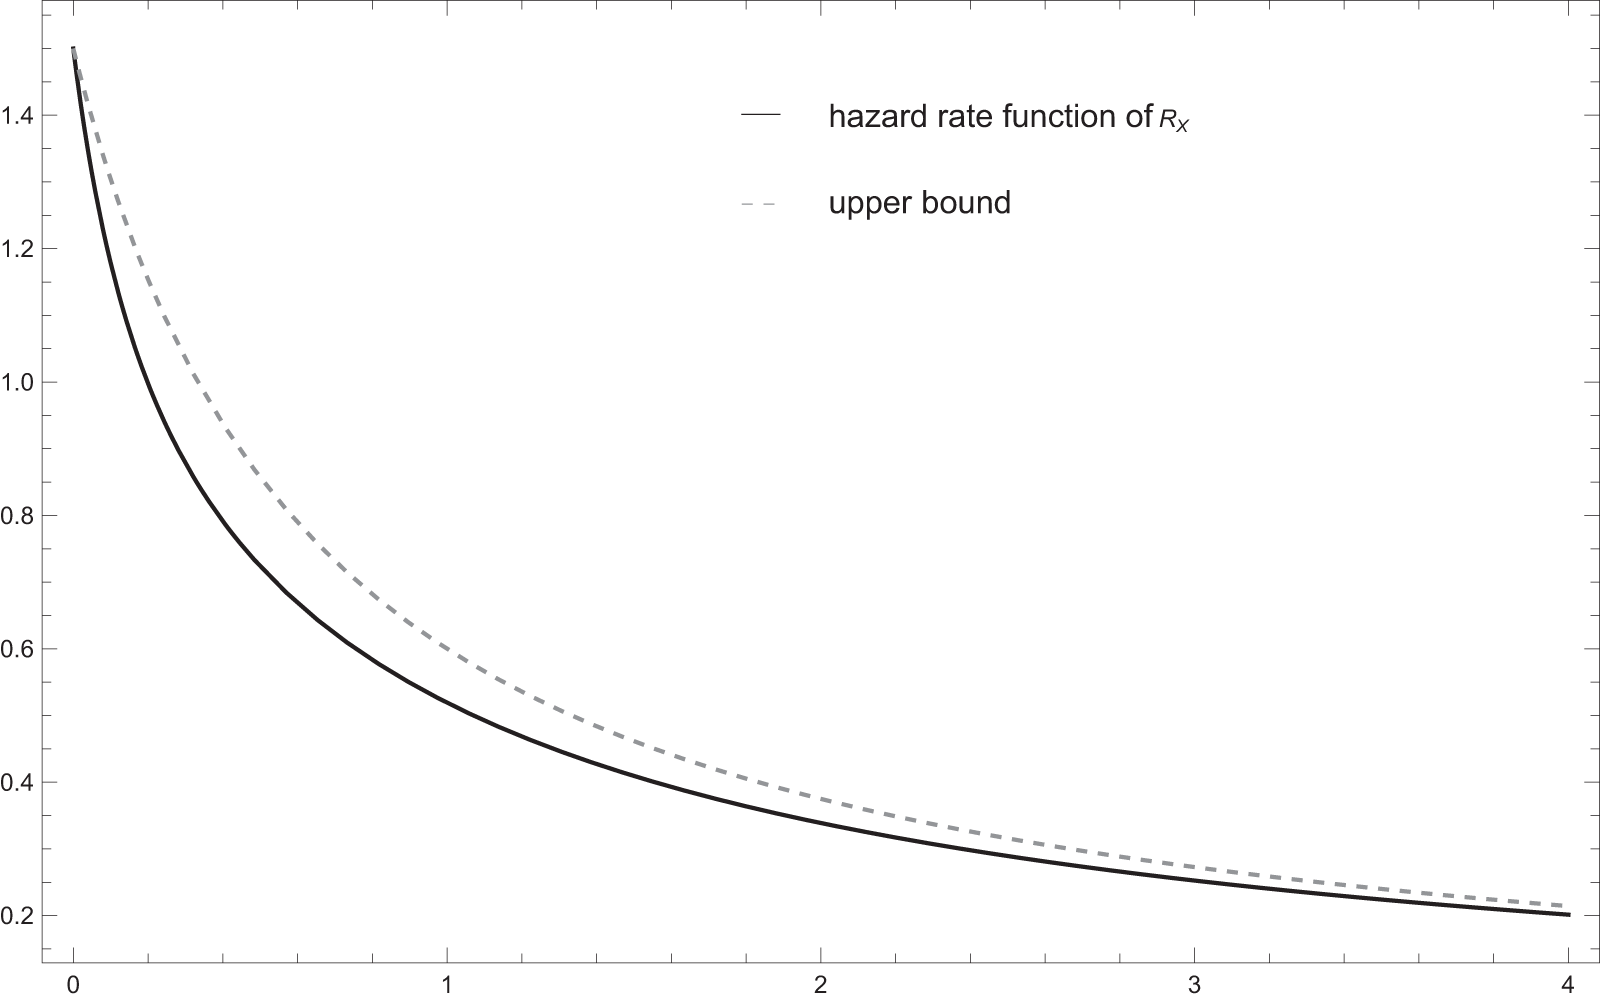
Plots of the hazard rate function of RX and the upper bound for  $(\lambda_1,\lambda_2)=(1,3)$.

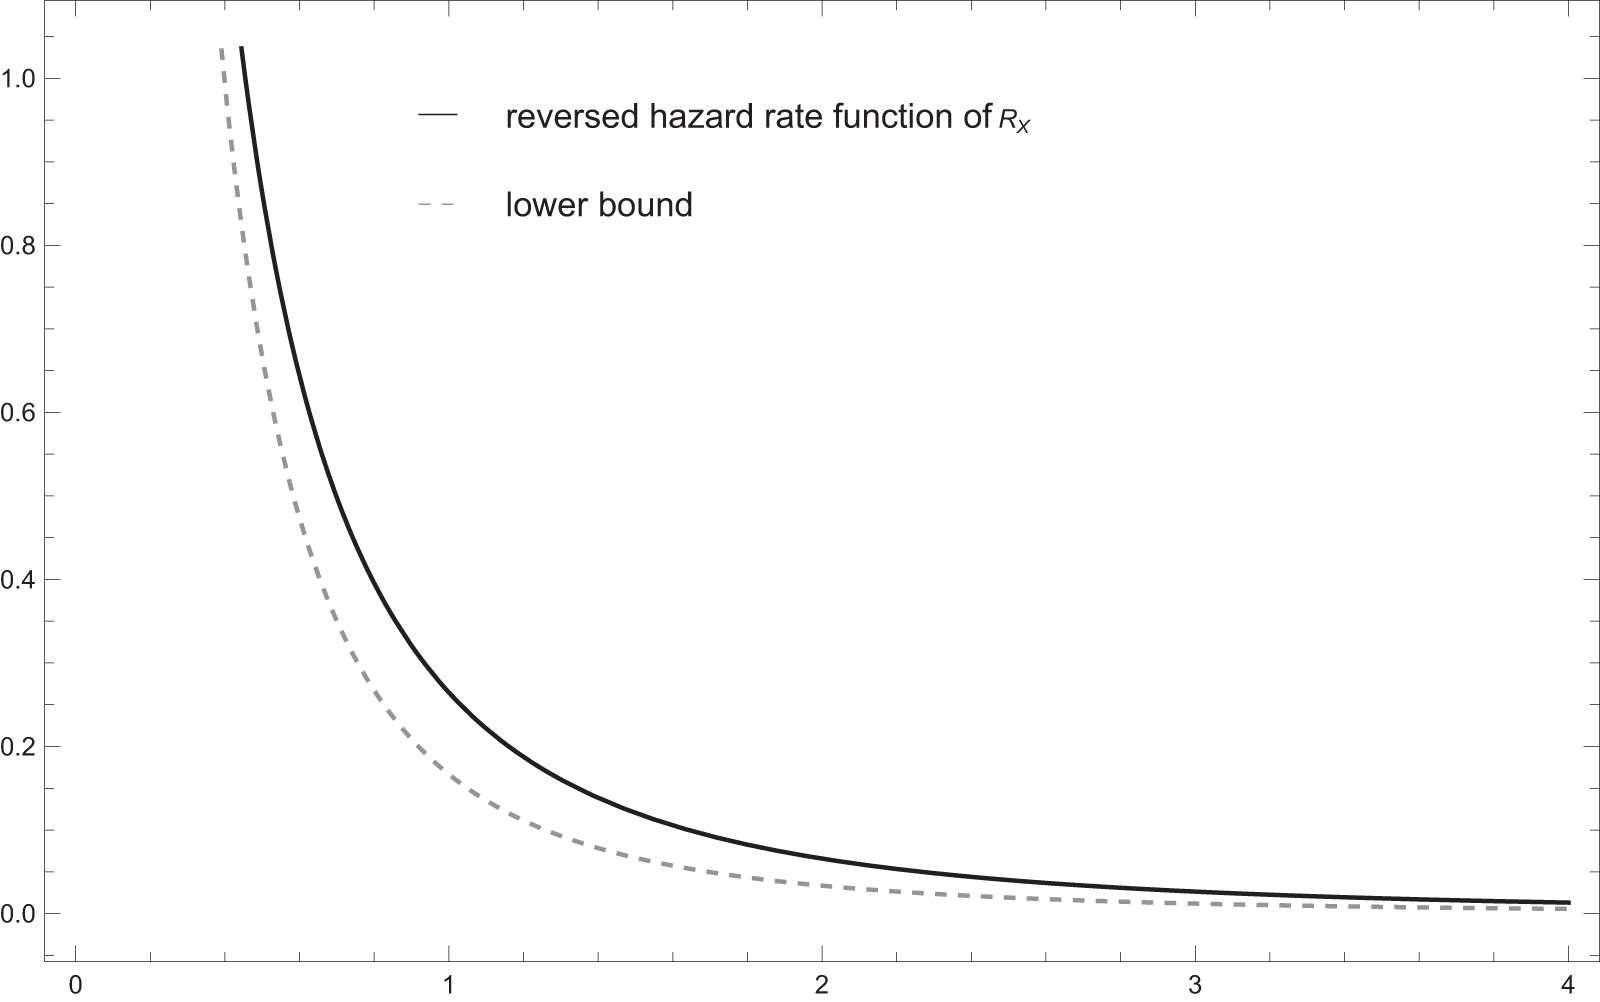
Plots of the reversed hazard rate function of RX and the lower bound for  $(\lambda_1,\lambda_2)=(1,3)$.

Taking limits on both sides of the above inequality, we see that  $\lambda_1+\lambda_2\le\mu_1+\mu_2,$ thus completing the proof of the theorem.
  $\square$
Corollary 3.7. From Theorems 3.5 and 3.6 and the facts that  $(\lambda_1,\lambda_2)\stackrel{w}{\succ}(\bar{\lambda},\bar{\lambda})$ and
  $(\lambda_1,\lambda_2)\stackrel{rm}{\succ}(\hat{\lambda},\hat{\lambda}),$ where
  $\bar{\lambda}=(\lambda_1+\lambda_2)/2$ and
  $\hat{\lambda}=2/(\lambda^{-1}_1+\lambda^{-1}_2),$ we can obtain the following bounds for the survival, hazard rate and reversed hazard rate functions of the sample range
  $R_X=X_{2:2}-X_{1:2}$ with
  $(X_1,X_2)\sim\mathcal{BP}(\alpha,\lambda_1,\lambda_2)\!:$
 \begin{align*}
\bar{F}_{R_X}(t)&\ge (1+\hat{\lambda}t)^{-\alpha},\qquad t\in\mathbb{R}^+,\\
h_{R_X}(t)&\le\frac{\hat{\lambda}}{1+\hat{\lambda}t},\qquad t\in\mathbb{R}^+,\\
\tilde{r}_{R_X}(t)&\ge\alpha \bar{\lambda}\frac{(1+\bar{\lambda}t)^{-(\alpha+1)}}{1-(1+\bar{\lambda}t)^{-\alpha}},\qquad t\in\mathbb{R}^+.
\end{align*}
\begin{align*}
\bar{F}_{R_X}(t)&\ge (1+\hat{\lambda}t)^{-\alpha},\qquad t\in\mathbb{R}^+,\\
h_{R_X}(t)&\le\frac{\hat{\lambda}}{1+\hat{\lambda}t},\qquad t\in\mathbb{R}^+,\\
\tilde{r}_{R_X}(t)&\ge\alpha \bar{\lambda}\frac{(1+\bar{\lambda}t)^{-(\alpha+1)}}{1-(1+\bar{\lambda}t)^{-\alpha}},\qquad t\in\mathbb{R}^+.
\end{align*}The next example provides an illustration for the result presented in Corollary 3.7.
Example 3.8. Assume that  $(X_1,X_2)\sim\mathcal{BP}(2,\lambda_1,\lambda_2),$ where
  $(\lambda_1,\lambda_2)=(1,3).$ It is then easy to see that
  $\bar{\lambda}=2$ and
  $\hat{\lambda}=1.5.$ The survival, hazard rate and reversed hazard rate functions of RX and the bounds given in Corollary 3.7 have been plotted in Figures 2, 3 and 4, respectively.
4. Concluding remarks
In this paper, we have established some ordering properties of vectors of order statistics and sample ranges arising from bivariate Pareto random variables. Assume that  $(X_1,X_2)\sim\mathcal{BP}(\alpha,\lambda_1,\lambda_2)$ and
  $(Y_1,Y_2)\sim\mathcal{BP}(\alpha,\mu_1,\mu_2).$ We have been established that
  $(\lambda_1,\lambda_2)\stackrel{m}{\succ}(\mu_1,\mu_2)$ implies
  $(X_{1:2},X_{2:2})\ge_{st}(Y_{1:2},Y_{2:2}).$ Under the same setup, we have also proved that the reciprocal majorization order between the two vectors of parameters is equivalent to the hazard rate and usual stochastic orders between sample ranges and that the weak majorization order between two vectors of parameters is equivalent to the likelihood ratio and reversed hazard rate orders between the sample ranges. It will naturally be of interest to consider the development of similar results for other forms of bivariate Pareto distributions known in the literature and also possibly for some other bivariate lifetime distributions.
Acknowledgements
The authors express their sincere thanks to the Editor, the Associate Editor and the reviewers for their useful comments on an earlier version of this manuscript which resulted in this improved version.


 Open access