


Introduction
High-tunnel (HT) systems have been shown to maximize yields, improve fruit quality and thus reduce pre- and post-harvest food losses, increase profitability by lengthening the growing season of profitable cash crops, and enhance overall economic stability (Waterer, Reference Waterer2003; Zhao and Carey, Reference Zhao and Carey2009; Knewtson et al., Reference Knewtson, Carey and Kirkham2010; O'Connell et al., Reference O'Connell, Grossman, Hoyt, Shi, Marticorena, Fager and Creamer2012; Ward and Bomford, Reference Ward and Bomford2013; Batziakas et al., Reference Batziakas, Swaney-Stueve, Talavera, Rivard and Pliakoni2019, Reference Batziakas, Rivard, Stanley and Pliakoni2020a, Reference Batziakas, Stanley, Batziakas, Brecht, Rivard and Pliakoni2020b; Bruce et al., Reference Bruce, Farmer, Maynard and Valliant2019). HTs are unheated, semi-permanent structures covered with polyethylene film, and are used to protect plants grown directly in the soil from extreme weather events, and to capture heat and extend the production season.
Tomato (Solanum lycopersicum L.), a heavy nitrogen (N) feeder, is the most popular crop grown in HTs during non-winter months due to strong consumer demand and profitable market values. Cool season crops, such as brassicas and salad greens, are commonly over-wintered in HTs as a second cash crop in warmer climates (Orzolek et al., Reference Orzolek, Lamont and White2002; Carey et al., Reference Carey, Jett, Lamont, Nennich, Orzolek and Williams2009; Knewtson et al., Reference Knewtson, Carey and Kirkham2010; Fitzgerald and Hutton, Reference Fitzgerald and Hutton2012; Janke et al., Reference Janke, Altamimi and Khan2017; Bruce et al., Reference Bruce, Farmer, Maynard and Valliant2019).
The intense production practices common in HT cropping systems often result in extensive tillage and increased nutrient demands which pose challenges for soil health, environmental quality and long-term economic sustainability particularly for organic systems where N is often a limiting nutrient (Clark et al., Reference Clark, Horwath, Shennan, Scow, Lanini and Howard1999; Berry et al., Reference Berry, Sylvester-Bradley, Phillipps, Hatch, Cuttle, Ryans and Gosling2006). Organic growers, including those operating in HTs, are required under the USDA National Organic Program to incorporate soil building practices as part of their management plan (National Organic Program §205.203(b)).
Many organic HT growers utilize manure-based composts to improve fertility and build soil health (Knewtson et al., Reference Knewtson, Carey and Kirkham2010). Compost applications in HTs have led to long-term sustainability concerns such as phosphorus accumulation (Gaskell and Smith, Reference Gaskell and Smith2007; Reeve and Drost, Reference Reeve and Drost2012), soil salinity (Bonanomi et al., Reference Bonanomi, Antignani, Capodilupo and Scala2014) and herbicide residue contamination (Davis et al., Reference Davis, Johnson and Jennings2020).
Cover crops used as a green manure have the potential to build soil organic matter, improve soil microbial activity (Finney et al., Reference Finney, Buyer and Kaye2017; Wallander et al., Reference Wallander, Smith, Bowman and Claassen2021), stabilize or increase yields (Lu et al., Reference Lu, Watkins, Teasdale and Abdul-Baki2000; Bergtold et al., Reference Bergtold, Terra, Reeves, Shaw, Balkcom and Raper2005; Snapp et al., Reference Snapp, Swinton, Labarta, Mutch, Black, Leep and Nyiraneza2005), reduce weed populations (Ngouajio et al., Reference Ngouajio, McGiffen and Hutchison2003; Lawson et al., Reference Lawson, Cogger, Bary and Fortuna2015) and replace inorganic fertilizer through biological fixation (Tonitto et al., Reference Tonitto, David and Drinkwater2006; Wayman et al., Reference Wayman, Cogger, Benedict, Burke, Collins and Bary2014; Janke et al., Reference Janke, Altamimi and Khan2017). Hairy vetch (Vicia villosa) has among the highest nitrogen fixation rates when compared to other legume cover crops (Parr et al., Reference Parr, Grossman, Reberg-Horton, Brinton and Crozier2011). In HTs, hairy vetch has been shown to replace 40–50% of synthetic N fertilizer, while maintaining or even slightly increasing tomato and other vegetable crop yields (Hajime et al., Reference Hajime, Hane, Hoshino and Hirata2009; Muchanga et al., Reference Muchanga, Hirata and Araki2017; Rudisill et al., Reference Rudisill, Bordelon, Turco and Hoagland2015). For farmers with no winter cash crops, improving soil quality via cover crop production may be an effective use of labor and space that would otherwise be left fallow. However, in warmer climates where a second cash crop is often grown during winter months, the short window between winter and summer cash crops precludes the use of hairy vetch as a potential cover crop (Sarrantonio, Reference Sarrantonio1992). Organic vegetable growers surveyed consider the shortened cover crop planting window ‘extremely challenging’ (Moore et al., Reference Moore, Mitchell, Silva and Barham2016). Therefore, planting hairy vetch as a cover crop in warm climate HTs would need to be done at the expense of a winter cash crop.
There is a substantial body of economic literature addressing the use of cover crops for grain and oilseed rotations in open field conditions. The studies are well documented but inconclusive. Field trials and modeling, for example, have shown either neutral or positive economic gains owing to net gains in fertilizer replacement (Ott and Hargrove, Reference Ott and Hargrove1989; Lichtenberg et al., Reference Lichtenberg, Hanson, Decker and Clark1994; Roberts et al., Reference Roberts, Larson, Tyler, Duck and Dillivan1998; Gabrielyan et al., Reference Gabrielyan, Chintawar and Westra2010), weed suppression (O'Reilly et al., Reference O'Reilly, Robinson, Vyn and Van Eerd2011) and improved crop yields (Frye et al., Reference Frye, Smith and Williams1985; Shurley, Reference Shurley and Power1987; Sweeney and Moyer, Reference Sweeney and Moyer1994; Kelly et al., Reference Kelly, Lu, Abdul-Baki and Teasdale1995; Teasdale and Abdul-Baki, Reference Teasdale and Abdul-Baki1997; Lu et al., Reference Lu, Watkins, Teasdale and Abdul-Baki2000). While these studies account for direct costs (seed), direct benefits (yield boosts) and indirect benefits (N savings), they do not account for the full costs of cover crop planting, maintenance and termination, nor do they explore the opportunity costs associated with planting cover crops in place of an alternative cash crop. Therefore, we suggest that cover crop expenses are undervalued and the economic benefits are overvalued in the studies reviewed.
Row crop studies that account for the full direct costs of cover crop establishment, maintenance and termination report marginal economic benefits or negative net returns. The researchers suggest that marginal benefits or negative net returns are attributed to little or no change in subsequent cash crop yield and limited fertilizer replacement value (Hanson et al., Reference Hanson, Lichtenberg, Decker and Clark1993; Bollero and Bullock, Reference Bollero and Bullock1994; Stute and Posner, Reference Stute and Posner1995; Larson et al., Reference Larson, Roberts, Tyler, Duck and Slinsky1998; O'Reilly et al., Reference O'Reilly, Robinson, Vyn and Van Eerd2011; Bietila et al., Reference Bietila, Silva, Pfeiffer and Colquhoun2016; Cai et al., Reference Cai, Udawatta, Gantzer, Jose, Godsey and Cartwright2019; Badon et al., Reference Badon, Czarnecki, Krutz, Shockley and Baker2021).
Only a few studies evaluate the economic impact of cover crops on vegetable cropping systems, including Kelly et al. (Reference Kelly, Lu, Abdul-Baki and Teasdale1995), Creamer et al. (Reference Creamer, Bennett, Stinner and Cardina1996), Teasdale and Abdul-Baki (Reference Teasdale and Abdul-Baki1998), Sainju et al. (Reference Sainju, Singh and Yaffa2002) and most recently, Duzy et al. (Reference Duzy, Kornecki, Balkcom and Arriga2013). We did not identify any studies measuring the economic outcome associated with cover crop use in organic HT systems. Like the field grain and oilseed research, economic results from the winter cover–vegetable rotation trials are inconclusive with some studies concluding that the cover crop treatment was more profitable than the control treatments (Kelly et al., Reference Kelly, Lu, Abdul-Baki and Teasdale1995) and others determining that the control treatments (no cover) were more profitable than the cover crop treatment when measuring returns above direct costs (Creamer et al., Reference Creamer, Bennett, Stinner and Cardina1996; Duzy et al., Reference Duzy, Kornecki, Balkcom and Arriga2013). Again, we suggest that these studies undervalue the cover crop costs borne from planting green manures in place of winter cash crops.
The objectives of this study are threefold: (1) compile an enterprise budget for a leguminous cover crop that includes direct material and labor costs as well as overhead expenses; (2) calculate the indirect economic benefits of N fixation and the opportunity costs associated with growing a leguminous cover crop in place of a winter cash crop or fallow ground; and (3) compare the economic costs and benefits of growing a cover crop in organic HTs in three distinct production regions characterized by different climate conditions.
Materials and methods
This study uses a partial budget (PB) approach to explore the direct economic costs and benefits associated with an over-wintered leguminous cover crop for organic HT tomato production in three states: Kansas (KS) in the Midwest, Kentucky (KY) in the Mid-South and Minnesota (MN) in the Upper Midwest. These states are distinct from one another in terms of climate, population size, farm typology, farm economy, organic certification and adoption of conservation practices. Kansas, for example, is the smallest when it comes to population, number of farms and use of cover cropping programs. By comparison, KY, which is considerably more populous and characterized by more farm numbers, tends to manage smaller farms. Both KS and KY are more temperate than Minnesota allowing for double cropping opportunities. Minnesota, which averages winter temperatures well below zero, has the largest population with the greatest purchasing power and more organic farms than other states. A complete list of biophysical characteristics (conservation efforts, climate, farm typology), demographics (population) and farm sector economy is presented in Table 1.
Regional characteristics
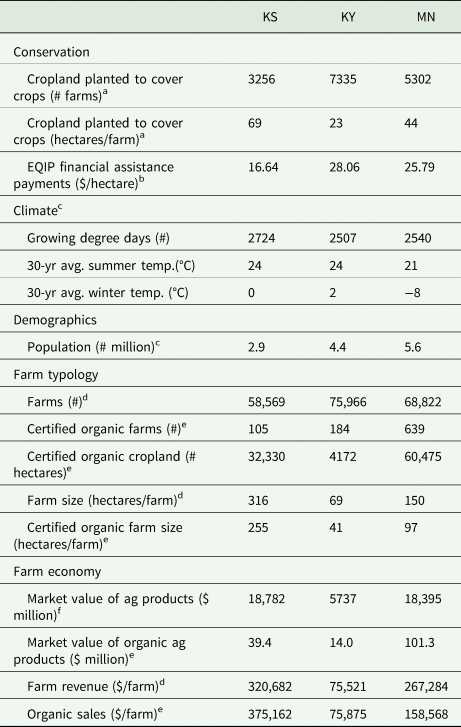
a 2017 Census of Agriculture. Table 41. Land Use Practices: 2017 and 2012. USDA, NASS. https://www.nass.usda.gov/Publications/AgCensus/2017/Full_Report/Volume_1,_Chapter_2_US_State_Level/st99_2_0041_0041.pdf.
b Reflects ‘basic’ organic cover rates for single species cover crop. Estimates provided by conservationists in each state (Joel Willhoft, NRCS Kansas on 1.18.22; Deena Wheby, NRCS, Kentucky on 8.23.21; and Keith Kloubec, NRCS, Minnesota on 8.13.21).
c US Census Bureau. December 2019. Table 1. Annual estimates of the resident population for the United States, regions, states and Puerto Rico. https://data.census.gov/cedsci/.
d 2017 Census of Agriculture. Table 1. State Summary Highlights: 2017. USDA, NASS. https://www.nass.usda.gov/Publications/AgCensus/2017/Full_Report/Volume_1,_Chapter_2_US_State_Level/st99_2_0001_0001.pdf.
e 2017 Census of Agriculture. Table 42. Organic Agriculture: 2017 and 2012. USDA, NASS. https://www.nass.usda.gov/Publications/AgCensus/2017/Full_Report/Volume_1,_Chapter_2_US_State_Level/st99_2_0042_0042.pdf.
f 2017 Census of Agriculture. Table 2. Market Value of Agricultural Products Sold Including Food Marketing Practices and Value-Added Products: 2017 and 2012. USDA, NASS. https://www.nass.usda.gov/Publications/AgCensus/2017/Full_Report/Volume_1,_Chapter_2_US_State_Level/st99_2_0002_0002.pdf.
Partial budgets
Partial budgeting methods were used to compare changes in net returns following introduction of the cover crop at research expense sites in each state. PBs are designed to capture impacts on farm income and costs from changes in operation. Fixed costs, for items such as buildings, land and equipment, are not included in PB analyses as fixed costs remain constant regardless of minor enterprise changes (Tigner, Reference Tigner2006; Dalsted, Reference Dalsted2008). However, these costs were included in the tomato enterprise budget compiled for this study.
The PB is structured as two vectors. The first vector presents any negative economic effects to the tomato enterprise that are associated with planting a cover crop in place of a winter cash crop (spinach) in KS and KY and in lieu of bare fallow ground in MN. Examples of negative economic effects in this study are the added material and labor costs of planting, maintaining and terminating a cover crop, as well as additional costs associated with any change in harvested tomato yield and increased harvest costs (harvest and post-harvest grading and packing). Reduced returns (reduced gross income) are represented by a decrease in tomato value owing to a reduction in tomato yield as well as foregone income from winter spinach sales in KS and KY. These negative effects are described as ‘added outflows’ and reduce overall profitability.
The second vector of the PB presents positive economic effects or ‘added inflows’ resulting from the introduction of the cover crop. Examples of added inflows are increased returns and reduced costs. Increased returns in this study were hypothesized to include improved marketable tomato yields as well as cover crop incentive payments offered through government conservation programs. Reduced costs also contribute to added inflows for the PB. Reduced costs in this study come from the foregone spinach crop and represent all spinach enterprise expenses as well as any reduced material and labor costs observed in the tomato enterprise. These include credits for any reduction in fertilizer costs resulting from measured cover crop N fixation. Added inflows contribute positively to overall profitability. The net difference between the two PB columns, added outflows and added inflows, indicates whether the proposed management practice (planting a winter cover crop in HTs) will have a net positive or negative effect on overall farm profitability.
Field trials
Data for marketable tomato (S. lycopersicum L.) and spinach (Spinacia oleracea) yields as well as cover crop performance come from field trials replicated in each state on certified organic university research farms during 2016–2019 in KS and KY and 2016–2020 in MN. Experimental treatments for the study included (1) a winter legume–tomato integrated rotation (IR); and (2) an intensive control (IC), consisting of a standard rotation of intensive tomato production flanked by production of cool-season spinach (KS and KY) and bare fallow (MN). Rotations were based on the most common HT practices in each region. The experimental design included four replications of each treatment (IR or IC rotation), arranged in a randomized complete block pattern within one or more HTs of the same soil type at each site. Plots varied in size from 16.72 m2 in KS to 27.87 m2 in KY and 81.76 m2 in MN.
The leguminous hairy vetch (V. villosa) used in the IR treatment was selected as a winter cover crop to optimize performance in colder climates, like MN. Each October hairy vetch was hand broadcast at a rate of 0.6 g m−2 at all sites and incorporated with a hard rake to improve seed to soil contact. Vetch seed was inoculated with N-Dure inoculant (Verdesian Life Sciences, Cary, NC, USA) by moistening seeds with a 1:4 sucrose solution, mixed with the recommended rate of inoculant, and allowing seeds to air dry overnight. Vetch seed and inoculants were valued uniformly across sites using market prices obtained from Albert Lea Seed (Albert Lea, MN, USA).
In KS and MN, overhead irrigation was used for cover crop establishment. In KY, drip irrigation was used for the cover crop. Vetch was watered as needed to maintain a moist soil surface until germination was complete and then periodically to provide approximately 1″ of water weekly until water supplies had to be turned off for winter (rainfall is excluded from the structures and irrigation provides the only source of soil moisture). Irrigation water was valued using site-specific water rates (price) and volume (gallons) obtained from research station utility receipts.
In MN, after 7–10 weeks of cover crop growth, a spun polyester floating row cover (AgroFabric, Tifton, GA, USA) was installed prior to predicted nighttime temperatures falling below 18°C. Row cover was layered above thin metal hoops to keep fabric approximately 0.5 m above the soil surface to limit contact with vetch leaves and minimize risk of frost injury at contact freeze points. KS and KY did not use floating row cover for the cover crops. No further cover crop management occurred until termination in the spring each year. Annualized low-tunnel expenses (metal hoops, spun polyester fabric, sod staples and labor) were valued uniformly at national market rates with the exception of labor which was valued regionally.
The cover crop was terminated at all sites after approximately 180 days using a walk-behind tractor with a flail mower attachment (March in KY and KS, April in MN) and incorporated with a tiller attachment. Termination-date differences among treatments were based on observed farmer practices and cover crop maturity, reflecting realistic cover crop management scenarios in each region.
For the IC treatment in KS and KY, spinach (‘Corvair’, Johnny's Selected Seeds, Orono, MN, USA) was seeded directly in the soil using a push-type seeder (Jang JP-1, Jang Automation Co, South Korea). Spinach was seeded in the IC plots at the same time vetch was seeded in the IR plots. After germination, spinach was thinned to 15 cm spacing between plants, with 30 cm between spinach rows. A floating row cover was used in KS to protect spinach during cool periods. Spinach was harvested by repeated harvest of mature outer leaves of the plant once leaves reached ‘medium marketable size (4″–8″)’ (USDA, AMS, 2006). Harvested leaves were sorted into marketable and unmarketable categories according to USDA leafy green grading standards (USDA, 2006).
After cover crop termination in the IR treatment plots, beds were formed for tomato planting and granulated organic fertilizer composed of meat, bone, feather and blood meal (NatureSafe 8-5-5; Darling Ingredients Inc., Irving, TX, USA) was applied to all plots. The IC plots received the full recommended N rate for tomato of 112 kg N ha−1 (Purdue University, 2018). IR plot fertilizer application rates were reduced proportional to the N credit from the vetch cover crop to achieve the target N rate. To this end, vetch biomass N content was estimated by determining vetch aboveground biomass percent N from a preliminary grab sample at cover crop termination. A single subsample was sent to an agronomic testing lab for nutrient analysis. The resulting percent nitrogen was applied to the harvested above ground biomass (dry weight of the biomass samples) to calculate total cover crop biomass N. It was assumed that 50% of the total cover crop biomass would be available as N. This hairy vetch N contribution was deducted from the crop N recommendation to calculate fertilizer N application rate in the IR plots. No N credit was allocated to belowground vetch biomass.
Supplemental in-season fertility was provided via fertigation as needed, based on the results of monthly foliar nitrate testing of a sample of at least 15 newly mature leaves per plot at each sampling date. Leaves were collected, and a composite of petioles per plot were passed through a plant sap press and tested using a hand-held nitrate meter (LaQua Twin Nitrate Meter, Spectrum Technologies, IL, USA).
Tomatoes were planted in both the IC and IR plots on the same dates at all sites. A determinate slicer tomato variety, common to HT producers at each site (‘BHN 589’, Johnny's Selected Seeds, Winslow, ME, USA), was selected. Determinate varieties are compact with all fruit ripening within a short period. For the research trials, tomato seedlings were grown and transplanted at 8 weeks, 14 days after cover crop termination. Tomatoes were planted 0.46 m apart within-row, and 1.5, 0.9 and 1.2 m between row in KS, KY and MN, respectively. Due to different plot sizes, a total of 24, 80 and 150 tomato seedlings were planted in KS, KY and MN, respectively, in spring following vetch termination. Crops were planted on raised beds in KY and MN with dripline irrigation and black plastic or fabric mulch used at all three research sites. In KS, the tomatoes were planted on flat ground, but the HTs themselves were built on elevated berms to promote drainage and soil warming in the spring. Tomato plants were pruned to remove suckers and trellised using the Florida weave system. Fields were scouted regularly to manage pest and disease.
Tomatoes were hand harvested for 12 weeks in KS (June 26–October 5), 8 weeks in KY (June 5–August 2) and 13 weeks each year on average in MN (July 3–October 11). Tomato yield and quality were measured by recording the number and weight of total fruit and marketable fruit (USDA grade 1 and 2). Fruit with physiological disorders including blossom end rot and green shoulder as well as other disorders common to tomato fruit in HTs such as cracking, cat-facing and yellow shoulder disorder were counted as unmarketable throughout the harvest period.
To test for statistical differences in tomato yield, we performed a linear mixed model analysis of variance (ANOVA) using R statistical software (R Core Team, 2022) and the ‘lmer’ and ‘anova’ functions from the ‘lmerTest’ package (Kuznetsova et al., Reference Kuznetsova, Brockhoff and Christensen2017). The model was fitted using restricted maximum likelihood estimation. The model structure had site-year and treatment (IC vs IR) as fixed effects, and replication nested within site-year (1|Site.year:Rep) as a random effect.
Price and cost estimates
Organic spinach was valued using 3-year average retail prices (USDA, AMS, custom reports) for organic bagged and bunched spinach. Bunched spinach was assumed to weigh 0.23 kg each. Tomatoes were valued using 3-year average fresh-market retail prices for organic varieties, including vine-ripe (Table 2). (Heirloom and vine-on varieties were excluded.) Market prices are compiled weekly by USDA from advertised prices at major retail supermarkets (USDA, AMS). A sensitivity analysis was applied using different marketing channel prices to study the impact of price variation on break-even tomato volume needed to offset cover crop expenses. A 2-year average retail price for locally grown organic slicer tomatoes was used to represent the upper bound price that growers receive when directly marketing to consumers. Locally grown tomato prices, which were collected bi-weekly via telephone surveys from two or more retailers in each state from June to October in 2017 and 2018, averaged 67–73% higher than the regional organic retail prices compiled by USDA (Table 2). The definition of ‘local’ used in the study was allowed to vary by retailer. An estimated wholesale price, valued at 50% of the USDA 3-year (2017–2019) mean retail price, was used in the sensitivity analysis as the lower bound price.
Fresh market tomato prices
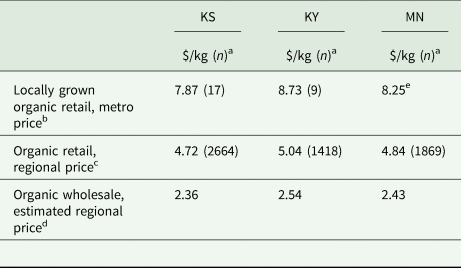
a n = number of price observations.
b Locally grown organic retail prices were compiled by research staff using a telephone survey every 2 weeks throughout the harvest seasons (June–October) in 2017 and 2018. The prices represent the retail prices displayed for locally grown organic slicer tomatoes. The definition of ‘locally grown’ was allowed to vary by store.
c Regional data compiled weekly from retail outlets by the USDA, Agricultural Marketing Service. MN and KY are represented by Midwest region data while KS uses data from the Southcentral region. Weekly median prices were calculated for the tomato harvest periods in each state and averaged for 2017–2019 in KS and KY and 2017–2020 in MN.
d Wholesale price is estimated at 50% of the regional retail price.
e Due to insufficient locally grown price data in MN, we estimated and applied a 70% premium. The estimate is based on the locally grown premiums available in the KS and KY markets.
Labor activities for establishment, management and termination activities for all crops were timed using a stop watch each year of the study in KY and MN. In KS, labor estimates were recorded using a stop watch in 2016–17 and the data were corroborated in 2019 using estimates provided by the field manager. Site-specific labor data were used in all production budget estimates, with the exception of harvest labor. Tomato harvest labor rates varied widely from site-to-site (averaging 0.06 min kg−1 in MN to 2.87 min kg−1 in KS) owing to the use of different harvest laborers and efficiencies in plot design. In Minnesota, the same student was responsible for tomato harvesting, grading and packing tomatoes throughout the study and timed harvest labor data were collected for three seasons (2017–2019). For this reason, harvest rates observed in MN (0.06 min kg−1) were assumed at the three study sites. All labor was valued using average regional hourly wage rates for field workers (Northern Plains for MN and KS and Appalachia II for KY) as compiled by the USDA, National Agricultural Statistics Service (USDA, NASS).
Results
The purpose of this study is to explore the financial efficacy of including leguminous winter cover crops in an organic HT tomato (S. lycopersicum L.) rotation in three different production regions. Overall, the hairy vetch (V. villosa) cover crop was grown successfully in HTs for three seasons (2016, 2017 and 2018 in KS and KY and 2016, 2017 and 2019 in MN). However, in KY the hairy vetch was slow to establish and, in some years, struggled to compete with chickweed and other broadleaves, resulting in relatively modest overall biomass contributions. In MN, the cover crop failed in 2018 due to poor stand establishment in the fall and low winter temperatures that led to winter kill. Consequently, the cover crop yielded no biomass or N credits in 2018. For this reason, the field experiment was conducted for a fourth year in Minnesota. Data from all years were included in the analysis.
Cover crop benefits
Average tomato yields for the field trials are reported by state and treatment in Table 3. Statistical results indicate that the cover crop did not benefit tomato yield regardless of regional production differences (Table 4). Total and marketable tomato yields were normally distributed with variances close to homogenous. Marketable tomato yield (kg m−2) differed significantly between site-years (ANOVA F = 28.7, P < 0.001), but not between treatments (ANOVA F = 0.58, P = 0.45).
Mean tomato yields by state, kg m−2
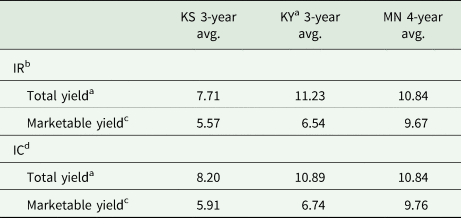
a Total yield includes tomatoes harvested prior to removal of culls.
b IR represents yields from the ‘intensive rotation’ or control plots.
c Marketable yield represents USDA grade 1 and grade 2 tomatoes after culls were removed due to size or quality. Telephone surveys conducted during summer 2017–2018 suggest that retailers purchase primarily grade 1 tomato but will buy in grade 2 tomato if there is insufficient supply for the ‘locally grown’ organic market.
d IC represents yield from the cover crop plots.
Analysis of variance with Kenward–Roger's method for marketable tomato yield (kg m−2)
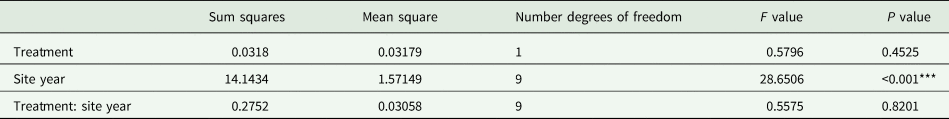
Significance value: ***0.001.
Biomass sampling indicated that the hairy vetch cover crop offset a significant amount of fertilizer in KS and MN—contributing 42% and 32%, respectively, of the tomato crop's target N needs (Table 5). In KY, the cover crop contributed 13% of the tomato crop's target N rate. With organic fertilizer valued at $1.43 kg−1, the cover crop offset direct fertilizer expenses by $0.03–$0.08 m−2 in KS, KY and MN.
Nitrogen credits for organic cover crop
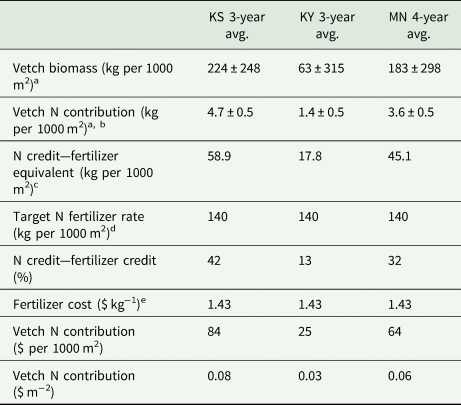
a Means ± standard deviation.
b Vetch N contribution is estimated as 50% of N contained in aboveground biomass. In 2018, vetch biomass percent N for MN and KS was estimated based on average of other years at the same site.
c Vetch N credit is converted to 8-5-5 fertilizer equivalent using a 0.08 conversion factor.
d Target fertilizer rate is 1401 kg per ha of 8-5-5 fertilizer, supplying 112 kg N per hectare.
e 2017–2019 average market value of NatureSafe 8-5-5 pelletized organic fertilizer.
Cover crop costs
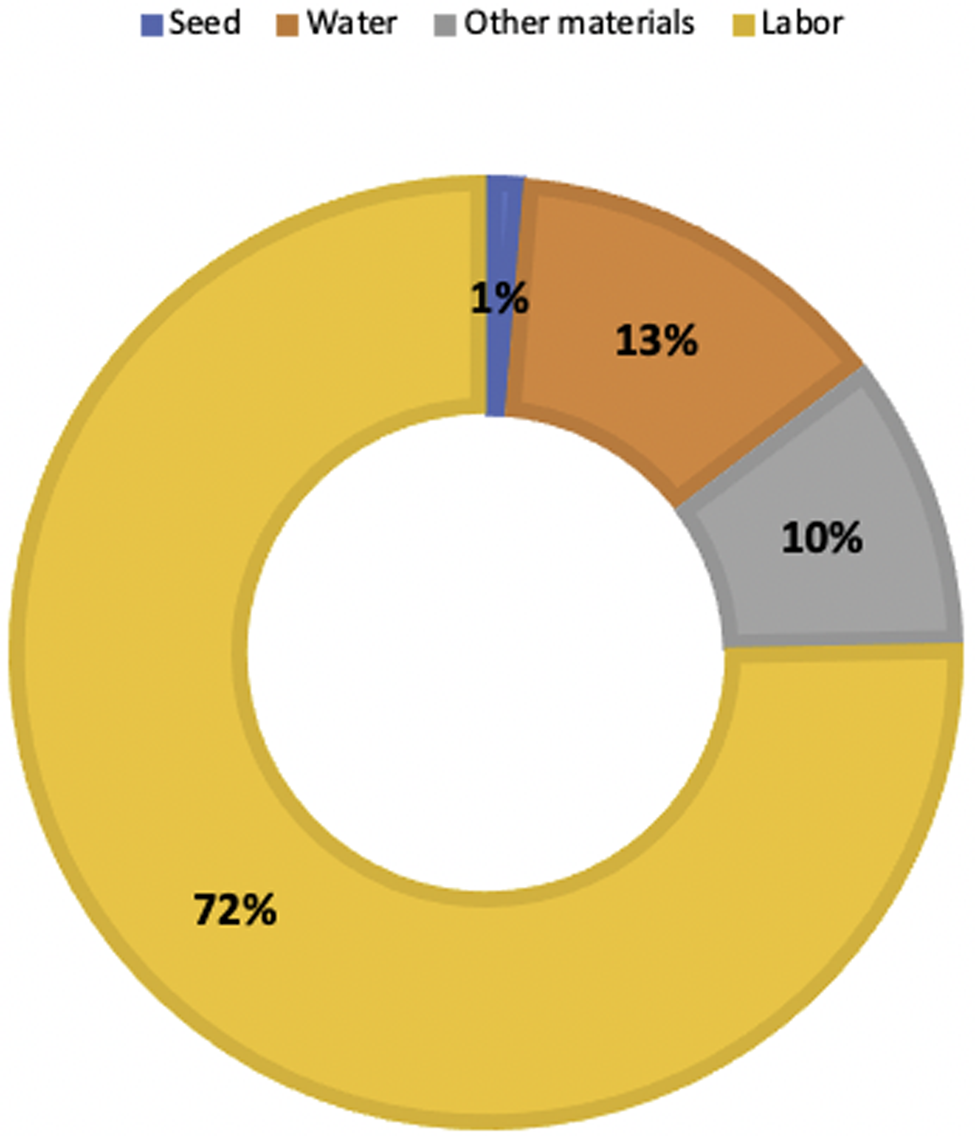
The 3-year average cost of producing the hairy vetch cover crop ranged from $2.35 m−2 in KS to $3.54 m−2 in KY (Table 6). Minnesota cover crop expenses averaged $2.98 m−2 despite additional material costs associated with low tunnels. Labor accounted for the majority of cover crop expenses, averaging 72% across all sites for the study period (Fig. 1) and was particularly high in KY where HT ventilation control was performed by hand (whereas the other sites managed ventilation using automated systems). Of the material inputs, water was the largest expense in all three states, with the exception of low-tunnel costs in MN. Certified organic seed, which has been cited by organic farmers as cost prohibitive by row crop producers (North Central SARE, 2013), accounts for only 1% or less of expenses measured in all three states (Fig. 1).
Cover crop enterprise expenses, percent of total costsa. a3-year average of expenses for all research sites: Kansas, Kentucky and Minnesota.
Enterprise budget: organic cover crop expenses, $ m−2
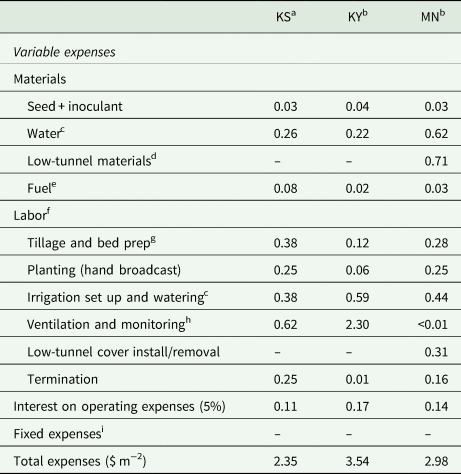
a Represents estimated expenses from 2019.
b Represents 3-year average expenses timed and recorded by field researchers from 2017 to 2019.
c Cover crop irrigated prior to germination and as needed to retain adequate soil moisture.
d Low-tunnel material costs were annualized over 3 years.
e Unleaded fuel values come from national averages compiled by the US Energy Information and Administration (www.ela.gov) for November–February in 2017 ($0.60 liter−1), 2018 ($0.72 liter−1) and 2019 ($0.67 liter−1).
f Labor values come from regional averages compiled by the USDA National Agricultural Statistics Service for field workers in January 2017–2019 ($15.39 h−1, $11.66 h−1 and $15.39 h−1 for Kansas, Kentucky and Minnesota, respectively).
g Differences in tillage and bed prep are explained by variation in plot design and accompanying labor efficiencies.
h KS and KY controlled ventilation manually, opening and closing side walls by hand as needed. In MN, HT ventilation was controlled using a pre-programed mechanized system. One-time programming labor was included.
i All fixed expenses were allocated to the tomato enterprise in MN and split equally between the tomato and spinach enterprises in KS and KY.
Similarly, tomato harvest expenses (labor and materials) varied across states, with efficiencies accruing to those sites with larger harvests (MN and KY) and savings to those with marginally lower labor rates (KY) (Table 2). Gross returns for the IR tomato plots averaged $26.29 m−2 in KS, $32.97 in m−2 KS and $46.82 m−2 in MN. The regional disparity in gross returns is accounted for largely by differences in retail tomato prices. Retail prices averaged $4.72 per kg, $5.05 per kg and $4.85 per kg in KS, KY and MN, respectively (Table 2).
Partial budget results
The PB showing the average net income effect of cover crop use on the tomato enterprise is presented in Table 7. Added outflows (additional costs and reduced returns) total $32.30 m−2 in KS, $38.04 m−2 in KY and $53.82 m−2 in MN. Added inflows (additional returns and reduced costs) total $28.65 m−2 for KS, $35.62 m−2 for KY and $50.67 m−2 for MN. Fertilizer savings from the cover crop are reflected in the PB as a reduced cost.
Partial budget summary by site, $ m−2
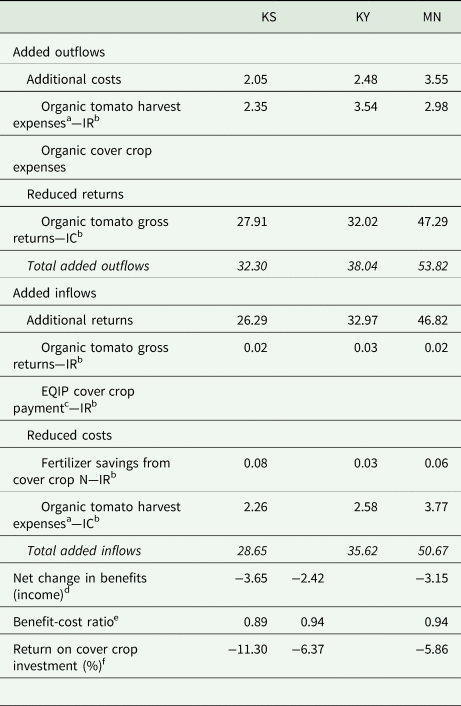
a Represents material and labor production and harvest expenses.
b The study treatments are ‘integrated rotation’ or control (IR) and the ‘cover crop’ (IC).
c Represents 4-year average organic and non-organic basic conservation payment rate, adjusted for inflation using CPI with a base year of 2019.
d Net change in income = (total added inflows) – (total added outflows). A positive number indicates a positive net change in come. A negative number indicates a negative net change in income.
e Benefit–cost ratio = (total added inflows)/(total added outflows).
f Return on investment = 1 – (benefit–cost ratio).
Subtracting the added outflows (total costs) from the added inflows (total benefits) yields a negative net change in benefits for all three regions: −$3.65 m−2 in KS, −$2.42 m−2 in KY and −$3.15 m−2 in MN (Table 7). Despite the negative net returns, the cost–benefit ratio in KY and MN of 0.94 is near break-even (1.0). In KS, the cost–benefit ratio measures 0.89, indicating a negative 11% return on the cover crop investment (Table 7). Thus, even before accounting for opportunity costs (foregone income from a second cash crop, spinach), the cover crop does not quite pay for itself in KS or KY.
After accounting for opportunity costs, the net change in income from the use of winter cover crops in KS and KY sites is further reduced to −$25.16 m−2 in KS and −$53.11 m−2 in KY (Table 8). Foregone income from the spinach enterprise accounts for 51% ($33.02 m−2) and 62% ($61.02 m−2) of total outflows in KS and KY, respectively (Table 8). The resulting cost–benefit ratios are well below break-even: 0.61 in KS and 0.46 in KY. Looking at it another way, growers in KS and KY would need to forfeit 0.50 kg m−2 (9%) and 0.70 kg m−2 (11%), respectively, of their marketable tomato harvest to break-even on cover crop expenses and opportunity costs each year when tomatoes are valued at regional organic retail prices.
Partial budget summary by site with opportunity costs included, $ m−2
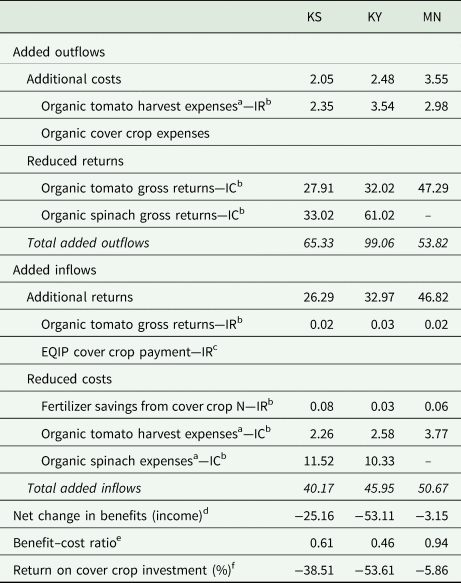
a Represents material and labor production and harvest expenses.
b The study treatments are ‘integrated rotation’ or control (IR) and the ‘cover crop’ (IC).
c Represents 4-year average organic and non-organic basic conservation payment rate, adjusted for inflation using CPI with a base year of 2019.
d Net change in income = (total added inflows) – (total added outflows). A positive number indicates a positive net change in come. A negative number indicates a negative net change in income.
e Benefit–cost ratio = (total added inflows)/(total added outflows).
f Return on investment = 1 – (benefit–cost ratio).
Sensitivity analysis
The sensitivity analysis, exploring the impact of different marketing channel prices on changes in net returns, suggests that even when locally grown price premiums are factored in (premiums equal 67–73% across sites), growers would need to produce additional tomatoes (0.30, 0.41 and 0.36 kg m−2 in KS, KY and MN, respectively) to pay for cover crop costs (Table 9). When wholesale prices are assumed, the break-even tomato volume more than triples to 1.01, 1.40 and 1.24 kg m−2 in KS, KY and MN, respectively (Table 9). Alternatively, when calculating the break-even price for tomatoes, we find that growers would need to charge an additional $0.42 kg−1 in KS, $0.54 kg−1 in KY and 0.31 kg−1 for tomatoes to pay for cover crop production expenses (Table 9).
Sensitivity analysis and tomato break-evens with opportunity costs included
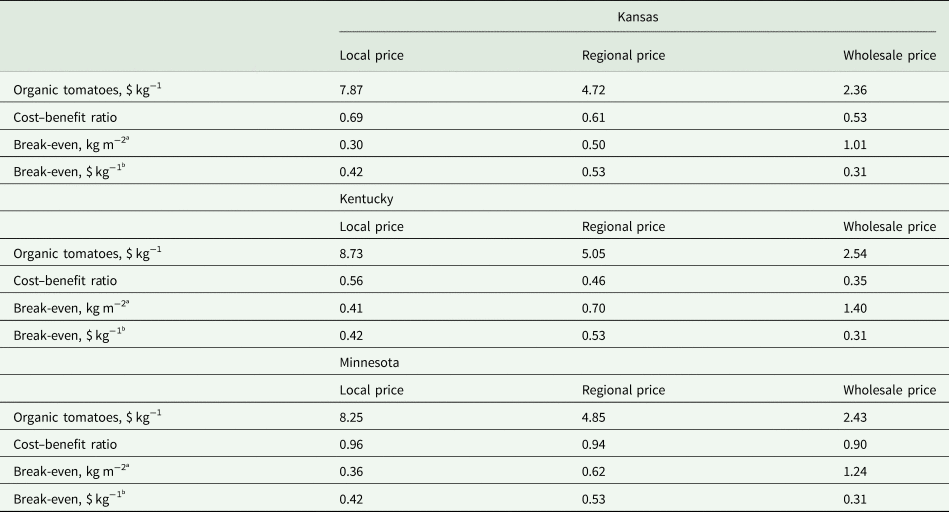
a The break-even tomato volume was calculated as cover crop cost/tomato price and represents additional tomato production needed to break-even on cover crop expenses.
b The break-even tomato price was calculated as cover crop costs/marketable tomato yield for the IR enterprise and represents additional tomato price needed to break-even on cover crop expenses.
Discussion
In this study, the hairy vetch (V. villosa) cover crop was considered financially advantageous if it generated benefits sufficient to offset expenses that accrued from the planting, maintenance and termination of the cover crop itself. Benefits considered in this study were N credits and improved marketable tomato (S. lycopersicum L.) yields.
Despite the positive hairy vetch biomass contributions and N credits observed in organic HTs, the modest conservation payments and economic benefits associated with cover crop use were not sufficient to offset the costs regardless of marketing channel used or price premiums received. In warmer climates, where the cover crop was planted in place of a second cash crop, spinach (S. oleracea), the opportunity costs well exceeded any financial benefits generated by the cover crop.
Moreover, had the cover crop produced enough biomass to replace 100% of the needed N for tomatoes at any location, the fertilizer savings would not have paid for the cost of the cover crop during the period studied. Fertilizer material and labor expenses for tomatoes in the IC plots (where 100% of fertilizer was purchased) were only equal to 9, 8 and 11% of cover crop costs in KS, KY and MN, respectively. While the fertilizer credits are dependent on fertilizer prices, we observed that fertilizer N credits produced by the cover crop account for a relatively small share of the overall tomato expenses. Unlike row crops, the benefit of N savings from hairy vetch in vegetable systems is relatively insignificant. Therefore, additional benefits, such as improved marketable tomato yield and/or significantly increased conservation payments, are required to offset the cover crop's direct costs.
Previous studies observed a range of cover crop effects on subsequent vegetable yield from positive to negative (Ngouajio et al., Reference Ngouajio, McGiffen and Hutchison2003; Tonitto et al., Reference Tonitto, David and Drinkwater2006; Hajime et al., Reference Hajime, Hane, Hoshino and Hirata2009; Rudisill et al., Reference Rudisill, Bordelon, Turco and Hoagland2015; Muchanga et al., Reference Muchanga, Hirata and Araki2017; Sánchez-Navarro et al., Reference Sánchez-Navarro, Zaornoza, Faz and Fernández2019). We found no statistically significant difference in marketable tomato number or weight between the hairy vetch cover crop treatment and the control treatment following 3–4 years of study in different production regions. Yet, we cannot attribute the negative financial impact of the cover crop to poor tomato yields in this study. Tomato yields for the experimental plots were well above industry standards for fresh market field tomatoes (Purdue University, 2018) and consistent with or numerically higher than those reported for other organic HT studies in North Carolina and Tennessee (Rogers and Wszelaki, Reference Rogers and Wszelaki2012; Sydorovych et al., Reference Sydorovych, Rivard, O'Connell, Harlow, Peet and Louws2013).
Without improvements in marketable yield from the hairy vetch, it is not surprising that the cover crop failed to confer direct financial benefits. The cover crop did not pay for itself in any of the regions studied, although it came close to breaking even in MN where the benefit–cost ratio was 0.94. The negative returns on investment in KS and KY are compounded by the opportunity costs associated with foregone income from organic spinach production: $21.47 m−2 in KS and $49.88 m−2 in KY. The same would be true in MN if a winter cash crop, such as spinach, were added to the rotation. At the time the study was designed, spinach was not grown as a winter cash crop in MN HTs, though it is now becoming more common with the aid of additional low covers. Ultimately, where double- and even triple-cropping are promoted to maximize, rapidly maturing, late summer cover crops that have minimal impact on cash crop production windows should be explored as alternatives to winter cover crops.
These results have important implications for organic vegetable growers who are looking to incorporate soil building practices, such as cover crops, as part of their rotation schedule. When exploring the trade-off between cover crop costs and benefits, government incentive programs and many decision-making tools consider only the direct costs of seed and other materials, which make up the majority of production costs in row crop systems. Environmental Quality Incentives Program (EQIP) basic cover crop incentive payments offered by the Natural Resource Conservation Service (NRCS), for example, were $16.64–$28.06 per ha (~$0.025 m−2) in 2019 across all study locations (Table 1). The valuation methods used by NRCS dramatically underestimate the costs associated cover crop planting in HT vegetable systems, where planting, irrigation and termination require considerable labor, water and fuel, as well as floating row covers (woven material placed over plants to extend the growing season by retaining heat). The full complement of direct costs will need to be considered when determining cover crop incentive payments for HT vegetable growers and when growers themselves assess the economic impact of cover crop adoption.
While this study provides a more complete accounting of cover crop expenses and related opportunity costs for organic HT vegetable growers, the changes in revenue and costs were limited to those with observable market value. The current findings, like those from Bergtold et al. (Reference Bergtold, Ramsey, Maddy and Williams2017), emphasize the importance of quantifying the indirect or long-term cover crop benefits such as improved soil health and greater yield for individual growers as well as societal benefits from reduced nitrogen leaching. According to the National Cover Crop Survey, farmers do attribute value to indirect cover crop benefits such as soil health and erosion control (USDA—Sustainable Agriculture Research and Education, 2020), though the values can differ by location and individual. When indirect benefits are at least equal to the break-even cost for cover crops, cover crop adoption may become more commonplace within and outside the organic community.
Limitations
The regions selected for the study are biophysically diverse representing different geographic and climatic conditions. Although this was desirable from a scientific perspective, it proved challenging to select a cover crop variety that would perform well in all climates.
Minnesota winters are cold yet variable, with January temperatures during the study years ranging from average highs of 0 to average lows of −23°C. This variability negatively impacts the winter survival of even the most cold-tolerant cover crops, such as hairy vetch.
Kentucky, on the other hand, is considered a horticultural ‘transition zone’ between southern and northern weeds, and thus is prone to both. Legumes, such as hairy vetch, are weak competitors with winter annual weeds. Thus, farms in warmer regions, particularly those that are rich in nutrients, may be better served by optimizing non-legume cover crops to provide other ecosystem services such as weed suppression and carbon fixation. The latter would allow farmers to reduce compost inputs due to organic matter contributions from the cover crop.
This study undertook a significant effort to track labor costs and build enterprise budgets for the hairy vetch cover crop, spinach and tomatoes. In doing so, we observed very different rates of labor needed to accomplish similar tasks. The variability in labor, as well as the differences in regional labor rates, affected overall profitability for the tomato and spinach enterprises. Moreover, the labor rates observed in the study are likely inefficient compared to commercial enterprises with professional hired labor. For example, picking rates in Florida for field tomatoes have been reported to average 0.02 min kg−1 (Guan et al., Reference Guan, Feng and Sargent2018), compared to 0.06 min kg−1 in MN. While this study makes a unique contribution to the development of cover crop production budget and labor needs for organic HTs, on-farm research is needed to produce reliable labor estimates, particularly when scaling up from research-level plots to commercial farm operations.
Finally, potential cover cropping benefits such as weed suppression, water savings and pest control were not measured in the field studies used for this economic analysis. Savings from reduced herbicide, water and pesticide use would help offset the cost of cover cropping applications. We recommend future research to incorporate additional agronomic and environmental observations so that any economic benefits from these effects can be quantified.
The data that support the findings of this study are available from the corresponding author, GD, upon reasonable request.
Acknowledgement
We would like to thank the field staff and students at Kansas State University, the University of Kentucky and the University of Minnesota for their assistance on the project. Research for this paper was funded by the USDA, National Institute of Food and Agriculture, Organic Agriculture Research and Extension Initiative, 2016-51300-25722.
Author's contributions
JG, KJ, CR and MG conducted field trials and generated efficacy data. MG conducted the statistical analysis. GD conducted the economic analysis using the field trial data and led the discussion of results that involved all authors. GD generated the initial draft. All authors reviewed the draft. GD generated the tables and Figure 1. HP, KJ and CR provided substantial feedback. GD finalized and prepared the manuscript for submission.
Conflict of interest
None.


 Open access