


1. Introduction
Pellet injection into fusion devices is useful for particle supply (fuelling) and discharge termination. It also offers unique diagnostic opportunities. From the theory standpoint, pellet assimilation in the plasma is a challenging multiscale problem of transforming the solid material into an expanding plasmoid. Pégourié (Reference Pégourié2007) presents a thorough review of both experimental and theoretical work on this topic.
The existing models of pellet ablation in a hot magnetically confined plasma involve gas shielding as an essential ingredient and predict that the ablated material is semi-transparent to the incident hot electrons. The gas cloud left by the pellet initially expands in three dimensions and then continues as a plasma in one dimension along the magnetic field after it becomes ionized. At that point, the size of the plasma cloud is still relatively small compared with the machine size, and the cloud is much denser and colder than the ambient plasma. This work investigates the subsequent evolution of such a plasmoid.
It is sensible to describe the plasmoid dynamics within a fluid model. However, the involvement of the hot ambient plasma is typically outside the applicability range of any fluid models and, therefore, requires kinetic treatment. In particular, the coexistence of the cold and hot electron populations within the plasmoid and the energy exchange between them cannot be properly described in terms of a single temperature. Related to this issue is the dependence of the ambipolar potential on both electron populations rather than on a single Maxwellian. Yet another reason for the kinetic approach is the weak collisionality and long mean free path in the rarefied ambient plasma as opposed to frequent collisions within the much denser and colder plasmoid. All these aspects call for relevant kinetic amendments to the fluid models. A comprehensive kinetic resolution to these challenges is not yet available. It is, however, possible to identify some trends in experimentally relevant situations via rigorous analysis that involves only physics-based simplifications as opposed to arbitrary assumptions. An inherent part of such an effort is to specify the applicability conditions of the identified trends and assess whether the codes at hand simulate the essential physics ingredients appropriately.
In this work, we use a hybrid (two-component) approach to study the expansion of the pellet-produced plasmoid: we simulate the cold plasmoid with a Lagrangian fluid code and describe the rarefied hot plasma kinetically. This approach was proposed by Rozhansky & Veselova (Reference Rozhansky and Veselova1994) and adopted by Parks, Sessions & Baylor (Reference Parks, Sessions and Baylor2000). The hot plasma acts as a collisional volumetric source of energy for the plasmoid. This model extends the work of Aleynikov et al. (Reference Aleynikov, Breizman, Helander and Turkin2019) by including ion heating into the picture. An immediate practical motivation for this extension is to refine theoretical predictions for pellet experiments in the Wendelstein 7-X stellarator (W7-X).
In the W7-X, pellets are used for plasma fuelling (Baldzuhn et al. Reference Baldzuhn, Damm, Beidler, McCarthy, Panadero, Biedermann, Bozhenkov, Brunner, Fuchert and Kazakov2019). One of the most prominent features observed in pellet experiments in the W7-X is a significant enhancement of global energy confinement time (Baldzuhn et al. Reference Baldzuhn, Damm, Beidler, McCarthy, Panadero, Biedermann, Bozhenkov, Dinklage, Brunner and Fuchert2020; Bozhenkov et al. Reference Bozhenkov, Kazakov, Ford, Beurskens, Alcusón, Alonso, Baldzuhn, Brandt, Brunner and Damm2020). In these experiments, the ion temperature exceeds 3 keV with 5 MW of electron heating after injection of a series of cryogenic hydrogen pellets. Although this phenomenon is attributed to the reduction of turbulent transport associated with the change of density and temperature profiles due to the pellets, the immediate plasma energy balance during pellet assimilation is also important.
We pre-empt our quantitative analysis by qualitative thoughts described in § 2 and related back-of-the-envelope estimates, which include limitations of the adopted approach. Extensions of the self-similar solution for the expansion of the plasmoid, proposed by Aleynikov et al. (Reference Aleynikov, Breizman, Helander and Turkin2019), are also discussed in § 2. Sections 3 and 4 describe our computational model. Section 5 discusses the early stage of plasmoid expansion, when the plasmoid is not yet transparent to the ambient particles and the ambient plasma needs to be treated kinetically. Section 6 is devoted to the discussion of the later stage of the expansion, when the heated plasmoid becomes transparent to the ambient particles and the ambient plasma can be treated as a uniform volumetric source of energy. We demonstrate a good agreement between the analytical and the numerical models within the appropriate applicability range.
2. General considerations
In the W7-X, one cryogenic hydrogen pellet typically contains approximately $N_{\textrm {total}} = 10^{20}$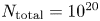 electrons, and is injected at a speed of $100\text {--}300\ \textrm {m}\ \textrm {s}^{-1}$
 by a blower gun. The pellet penetrates approximately $L_{p} = 5\text {--}15\ \textrm {cm}$
 into the plasma (Baldzuhn et al. Reference Baldzuhn, Damm, Beidler, McCarthy, Panadero, Biedermann, Bozhenkov, Brunner, Fuchert and Kazakov2019). At first, the ablated neutral material expands at the speed of sound in all three dimensions. This three-dimensional (3-D) expansion continues until the cloud becomes ionized and its pressure becomes smaller than the magnetic pressure, i.e.

where $B$ is the toroidal magnetic field, $R \approx \sqrt {T^p/m_i} t$
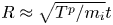 is the size of the cloud that expands with the sound speed, $T^p$
 is the plasmoid temperature and $t$
 denotes time. The cloud pressure decreases with time as $\sim 1/t^2$
 if fast ablation and ionization are assumed.
We note that the cloud temperature increases linearly in time as

where the collisional time $\nu _{ee}^a$ is given by (2.9) below. For the ambient plasma with density $n^a = 5 \times 10^{19}\ \textrm {m}^{-3}$
 , $T^a = 4\ \textrm {keV}$
 electron temperature and $B = 2.5\ \textrm {T}$
 , the cloud pressure drops below the magnetic pressure when the cloud size reaches $\approx 2\ \textrm {cm}$
 . Spectroscopic measurements of the pellet plasmoid in the Large Helical Device suggest that the plasmoid size in the direction perpendicular to the magnetic field reaches approximately 10 cm (Motojima et al. Reference Motojima, Sakamoto, Goto, Yamada and Experiment Group2010). A similar size is recorded in the W7-X experiments (Baldzuhn et al. Reference Baldzuhn, Damm, Beidler, McCarthy, Panadero, Biedermann, Bozhenkov, Brunner, Fuchert and Kazakov2019). However, after the 3-D expansion phase, the plasmoid expands along the field lines to much greater length. This expansion is driven by the ambipolar potential, which forms due to the plasmoid pressure gradient. Given the above parameters, the expected average field line integrated plasmoid density is approximately $N_l = 10^{22}\ \textrm {m}^{-2}$
 .
.
Throughout this work we assume that the pellets are very fast, so that the field-line-integrated plasmoid density remains constant after the solid pellet leaves the field line. This assumption breaks down for slower pellets that act as an ablative source on the time scale comparable to the plasmoid expansion time. Such slow pellets are considered by Arnold, Aleynikov & Helander (Reference Arnold, Aleynikov and Helander2021).
The cold plasmoid opacity is different for the ambient hot plasma electrons and ions. Because the stopping power of the hot ions on cold electrons is very high, the cold plasmoid is not transparent for the ambient ions before it is heated, while it is always transparent for the ambient electrons. In the high-performance pellet experiments in the W7-X, pellets are injected into a plasma with an electron temperature of 4 keV and an ion temperature of 2 keV (Bozhenkov et al. Reference Bozhenkov, Kazakov, Ford, Beurskens, Alcusón, Alonso, Baldzuhn, Brandt, Brunner and Damm2020). Figure 1 shows attenuation $s = \int _{-L/2}^{L/2} ({1}/{\lambda })\,{\textrm {d}x}$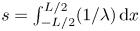 of a hot particle flux in the plasmoid of $T_{\textrm {cold}}$
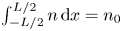
 temperature. Here, $L$
 denotes the plasmoid length, so that $\int _{-L/2}^{L/2} n\,{\textrm {d}x} = n_0$
 . The mean free path $\lambda$
 is calculated using the parallel slowing down time $\tau _s$
 as given by (18.5) from the paper by Trubnikov (Reference Trubnikov1965). The red curve indicates the attenuation of 4 keV electron flux and the blue curve shows the attenuation of 2 keV ion flux.Footnote 1 The steep rise of the ion attenuation for a colder plasmoid is due to friction on cold electrons. The plasmoid becomes transparent to the ambient ions when it reaches 100 eV.
Attenuation $s = \int _{-L/2}^{L/2} ({1}/{\lambda })\,\textrm {d}x$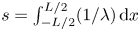 of a 4 keV electron flux (red) and 2 keV ion flux (blue) in a plasmoid of $T_{\textrm {cold}}$
 temperature.

In this work we focus on the long-term evolution of the plasmoid, so that the long mean free path of the ambient plasma particles in a heated plasmoid prevents us from treating the ambient plasma hydrodynamically. Instead, we use a simplified description of the kinetic effects. First, we consider the finite mean free path of the ambient plasma. In order to do that we solve a simplified kinetic equation for the ambient particles. The appropriate moments of the collisional integral provide energy and momentum sources in the fluid equations for the plasmoid. The kinetic model is introduced in § 4. The quantity of interest at this stage is the external pressure that hinders expansion. Second, we treat the plasmoid as being nearly transparent to the ambient electrons and ions. In this limit, the ambient plasma acts as a volumetric heating source for the pellet material. This limit is considered semi-analytically below, as well as by Aleynikov et al. (Reference Aleynikov, Breizman, Helander and Turkin2019).
In a non-conductive medium the difference between the fluxes of electrons and ions would electrically charge the plasmoid and establish an electrostatic potential that equalizes the fluxes. However, in our case good conductivity precludes formation of any significant potential. Indeed, in the unfavourable limit when the entire ambient ion flux is slowed down within the plasmoid, the potential $\phi _c$ that creates a neutralizing electron current is given by (see Lengyel et al. Reference Lengyel, Buchl, Pautasso, Ledl, Ushakov, Kalvin and Veres1999)

where $\sigma _{\|} = 1.96 ({e^2 n^p}/{m_e \nu _{ee}^p})$ is the parallel conductivity and $L_0$
 is the minimum between the plasmoid length $L$
 and the ion mean free path $\lambda$
 . The maximum $\phi _c$
 estimate is obtained for $L_0 = L$
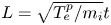
 . Assuming the sound speed expansion $L = \sqrt {{T_e^p}/{m_i}}t$
 and using (2.2) for plasmoid temperature we find
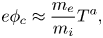
which is negligible compared with the plasmoid and the ambient plasma temperatures.
The highly collisional plasmoid electrons have a Boltzmann distribution in the ambipolar potential,

where $n^p$ and $n^a$
 are the plasmoid density and the ambient plasma density, respectively. Once the expansion becomes one-dimensional (1-D), the plasmoid density $n^p$
 evolves as

where $N_l$ is the line-integrated plasmoid density, $V$
 is the expansion speed and $\lambda ^a$
 is the hot ambient plasma mean free path. Note that the plasmoid temperature grows linearly with time as discussed by Aleynikov et al. (Reference Aleynikov, Breizman, Helander and Turkin2019). The potential is then

In order to neglect the effect of this potential on the ambient plasma, the potential has to be much smaller than the ambient plasma temperature, i.e. $e \phi \ll T^a$ . The quantity ${N_l}/({\lambda ^a n^a})$
 is of order unity under the assumption that the penetration depth of the hot electrons into the ablating pellet is roughly one mean free path within the solid material (or neutral gas shield). Of course, this is a very rough estimate and ${N_l}/({\lambda ^a n^a})$
 can differ from unity significantly. However, it follows from (2.7) that the ambipolar potential becomes significant long before the plasmoid is heated to the ambient temperature, unless ${N_l}/({\lambda ^a n^a})$
 is very small. We note that (2.7) does not take into account the reduction of the collisional heat exchange when the temperature of the cold population approaches the ambient temperature (see (2.8)). The numerical calculations discussed in the following show that the potential may actually decrease after an initial rise because of the reduced heating rate.
The calculations presented in this paper ignore the effect of the ambipolar potential on the ambient plasma, which puts a ceiling on the applicability range of this approach. Aleynikov et al. (Reference Aleynikov, Breizman, Helander and Turkin2019) discussed a self-similar solution for the expansion of the heated plasma into a vacuum. The solution relied on the plasmoid electron temperature being homogeneous along the field line and the plasmoid ions being cold. The former is an almost universally valid assumption, but the latter is not necessarily the case because of the collisional ion heating by electrons in a very dense plasmoid. The collisional coupling between the pellet ions and electrons initially keeps $T_i \approx T_e$ . However, as the plasmoid density drops, the electron temperature decouples from the ion temperature and exceeds it so that $T_i \ll T_e$
 for the most part of the expansion.
To understand the validity range of the cold ion approximation, we first note that the collisional energy transfer between the plasmoid electrons and the plasmoid ions does not change the total pressure that drives the expansion. Consequently, the ion heating can be assessed on the basis of the cold ion expansion model (Aleynikov et al. Reference Aleynikov, Breizman, Helander and Turkin2019).
For two Maxwellian species $\alpha$ and $\beta$
 with $T_\alpha / T_\beta \ll m_\alpha /m_\beta$
 and the same flow velocity, the heating per unit volume experienced by species $\alpha$
 due to $\beta$
 is given by

where we define a Braginskii-like collision frequency as

The plasma as a whole has four components: plasmoid electrons (denoted $e$ ), plasmoid ions ($i$
 ), hot background electrons ($eh$
 ) and hot background ions ($ih$
 ). We assume that the ion distribution is Maxwellian, which is justified near the origin where the plasmoid is very dense. By taking into account collisional heating of the plasmoid ions by plasmoid electrons and background ions, we obtain the following equation for the ion temperature in the plasmoid:

with $V$ , $T_{e}$
 , $n$
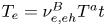
, $n$ being prescribed by the self-similar solution of Aleynikov et al. (Reference Aleynikov, Breizman, Helander and Turkin2019). Namely, $T_{e} = \nu ^B_{e,eh} T^a t$
 , $u = 3x/(2t)$
 and $n = N_l \sqrt {3m_i/(8{\rm \pi} T_e t^2)}\exp (-3m_i x^2/(8 T_e t^2))$
 , where $N_l$
 is the total line-integrated density of plasmoid material. The heating terms are given by (2.8), but the contribution from the background ions is approximate since $V\neq 0$
 . It is helpful to de-dimensionalize (2.10) by defining a time scale $(\nu ^{B}_{e,eh})^{-1}$
 , mass scale $m_i$
 and a velocity scale $\sqrt {T^a/m_i}$
 . With dimensionless equivalents of variables denoted by tildes, (2.10) becomes

where $\sigma$ is a dimensionless quantity, defined as

in CGS units. Within a factor of order unity, $\sigma$ is equal to the length of the cloud, measured in units of the mean free path of electrons with the ambient temperature, multiplied by $\sqrt {{m_e}/{m_i}}$
 .
.
Equation (2.11) may be solved by the method of characteristics combined with an integrating factor, which yields the solution:

where $\tau = \tilde {t}/\sqrt {\sigma }$ . The above quantity has its maximum at the origin, and its value is given by

Figure 2 presents the temperatures of both plasmoid species at the origin (with and without the ion–electron coupling). The ion temperature peaks when $\tau = 2.36$ , which gives a maximum value of $\tilde {T}_{i}/\sqrt {\sigma } = 0.705$
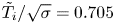 . In dimensional units, the ‘early maximum temperature’ of the ions is $T^{\max }_{i} = 0.705\sqrt {\sigma }T^a$
 at $t = 2.36\sqrt {\sigma }(\nu ^{B}_{e,eh})^{-1}$
 . For $\tau \gtrsim 5$
 , the electron–ion collisional coupling weakens and heating by the background ions takes over. As expected, collisional coupling decreases further away from the origin, which leads to lower ion temperatures in the outer regions of the plasmoid.
Evolution of the temperatures of plasmoid species at the origin. The green line shows ion temperature growth if there is no ion–electron collisional coupling.

For $\tau \lesssim 1$ , ion and electron temperatures are almost equal in the plasmoid. This is expected at early times, due to strong collisional coupling between the species. Once this coupling becomes weak, the ion temperature at the origin grows $\sqrt {m_i/m_e}$
 times slower than that of the electrons, because the remaining ion heating source is collisions with background ions. We thus conclude that the $T_i \ll T_e$
 assumption is justified, except at very early times, as long as $\sqrt {\sigma } \ll 1$
 .
.
The early maximum ion temperature at the origin may be expressed as

in CGS units. We note that this temperature is independent of the background plasma parameters. The only essential parameter involved is the line-integrated density of the plasmoid $N_l$ , which is determined by the initial condition. It is also noteworthy that this early maximum temperature is independent of the rate at which the plasmoid electrons are heated, despite the fact that energy is channelled from the plasmoid electrons to the ions.
Equation (2.15) shows that the early ion temperature maximum is in the range of a few tens of electron volts for the W7-X relevant parameters. Detailed numerical calculations discussed in §§ 3–5 confirm this conclusion.
Within the idealized cold ion approximation, the model of plasmoid expansion consists of the following three equations (continuity, momentum balance and energy balance):

where $Q(t)$ represents the per particle heating rate.
Equations (2.16) admit solutions with Gaussian density profiles and linear velocity profiles (Aleynikov et al. Reference Aleynikov, Breizman, Helander and Turkin2019; Kidder Reference Kidder1971):


This ansatz reduces (2.16) to a set of three ordinary differential equations:

Note that the plasmoid density factor $N_l$ does not appear in these equations when the heating function $Q(t)$
 is defined as the per particle collisional energy exchange, i.e. via (2.8). Hence, (2.19) describe expansion of a plasmoid of any line-integrated density.
We next consider a more general fluid model, with which we will then compare solutions of the ordinary differential equations (2.19).
3. Fluid model for the plasmoid
We consider a plasmoid of finite size, which, according to the fluid description, remains finite during the expansion, and we use a set of 1-D Braginskii equations (Braginskii Reference Braginskii1965) to describe expansion of the plasmoid along the magnetic field:

Here, the usual notation and CGS units are used and the $i$ /$e$
/$e$ subscript is omitted for brevity. The transport coefficients are those given by Braginskii (Reference Braginskii1965). The collisional heat exchange $Q_{ei} = -Q_{ie}$
 and the $S$
 -terms represent external sources and sinks, as discussed in § 4.
We apply the usual simplifications to these equations. The ion and electron momentum equations are added to cancel the electric field and mutual friction forces. The small terms of order $\propto m_e/m_i$ are neglected. We also assume quasi-neutrality (the Debye length is much smaller than the overall dimensions of the cloud), i.e. $n_i=n_e \equiv n$
 and $V_i \approx V_e \equiv V$
 . The small difference between $V_i$
 and $V_e$
 responsible for current flowing through the plasmoid is neglected.
The ambipolar electric field $E(x)$ is determined by the electron momentum balance equation, assuming fast electron temperature equilibration and neglecting electron inertia and viscosity:

With these simplifications, the set of hydrodynamic equations for plasmoid expansion reduces to

We use a Lagrangian representation to solve these equations. The Lagrangian time derivative is ${\textrm {d} }/{\textrm {d} t} = \partial /\partial {t} + V(\partial /\partial {x})$ so that the system (3.3) takes the form:

where $\varepsilon _{i/e} \equiv 3/2nT_{i/e}, \mu \equiv m_i n V$ .
.
The Lagrangian coordinates $\xi , t$ , where $\xi$
 marks the ‘fluid element’ ($\xi = x |_{t=0}$
 ), with Jacobian $J \equiv |{\partial x}/{\partial \xi } |$
 , allow us to cast (3.4) into a set of conservation laws. The evolution of the medium is described by functions $x(\xi ,t), \; V(x,t), \; n(x,t)$
 . The law of motion for each fluid element is given by

and its derivative with respect to $\xi$ is given by

Substituting this expression into (3.4), and introducing the ‘substance’ values instead of densities,

the desired form of the equations is obtained:

The source terms on the right-hand side of (3.8), due to collisions with the ambient plasma, are given by

where $St$ describes collisions between the ambient particles and the plasmoid particles, as discussed next.
In the present work, we do not model the ambient plasma self-consistently, it just determines these source terms in our model. It should be noted that in a purely hydrodynamic case (infinite collisionality of the plasmoid), these volumetric sources would degenerate to delta-functions and define therefore boundary conditions for (3.8). In our case of finite collisionality, the exchange between ambient plasma and the plasmoid is taken into account by sources (3.9), and the boundary conditions for (3.8) represent the absence of additional energy and momentum fluxes through the moving boundary,

4. Treatment of sources
The initial 3-D expansion of the ablated material makes it transparent to the ambient hot electrons, but the mean free path of the ambient ions in the plasmoid is still shorter than the plasmoid size until the plasmoid electrons warm up. This suggests that the ambient ion pressure may slow down the plasmoid expansion rate. However, this factor turns out to be of secondary importance in the parameter range under consideration. The reason is that the initial pressure inside the plasmoid is much greater than the ambient plasma pressure, and the plasmoid electrons warm up sufficiently to decrease the ion stopping power before the plasmoid pressure becomes comparable to the ambient pressure. As a result, the plasmoid quickly becomes transparent to the ambient ions and, therefore, unaffected by their pressure. In other words, the coupling of the plasmoid to the ambient hot ions diminishes quickly as its temperature rises, the collision frequency falls and the expansion changes character from hydrodynamic to kinetic.
To model this trend in the code, we treat the incident ions plasma as a half-Maxwellian beam entering the plasmoid. The plasmoid parameters are governed by (3.8). We describe the slowing down of the ion beam within the plasmoid by a 1-D quasi-steady-state kinetic equation. For simplicity, a simple model is employed that only includes collisional drag and ignores any ambipolar potential. We characterize the drag by a velocity-dependent collision frequency. This enables the code to model the energy and momentum deposition from the ambient ions, which depend on the ion mean free path, in a computationally efficient and qualitatively accurate way.
The simplified kinetic equation for the ambient ions is

where $\nu ^s$ is taken to be the slowing-down frequency (summation over the scatterer species is assumed) as given by (18.5) from the paper by Trubnikov (Reference Trubnikov1965), i.e.

where

and where the relaxation time is given by

In the limit $T^a \gg T^p$ the most important process is braking of the beam particles on the cloud. Note that this choice of collision frequency would not be appropriate for the electrons, which undergo pitch-angle scattering on the ions. However, this process may be neglected since $S_T^{ei}$
 is small compared with $S_T^{ii}$
 by a factor of $\sqrt {m_e/m_i}$
 , see table 2 in the paper by Trubnikov (Reference Trubnikov1965).
Despite the fact that the slowing down of the fast particles is calculated self-consistently, we assume that their density is insignificant, so that the particle source in the fluid model is negligible $S_n = 0$ .
.
The boundary condition for $f$ is assumed to be Maxwellian,

The distribution function for ions then obtains the form:

similar expressions for $v_\parallel < 0$ and for the electrons are straightforward.
The source terms (3.9a–c) take into account contributions of all species,

As we have mentioned above, in the present calculations we neglect the contribution of $e$ –$i$
–$i$ collisions compared with the corresponding $i$
 –$i$
–$i$ terms.
This momentum and the energy sources are calculated at each kinetic sub-step and used in (3.8).
4.1. Ambient plasma model in the limit of low collisionality
If the ambient plasma collisionality within the plasmoid is low we may treat it as being uniform there. The effects of the plasmoid on the ambient plasma can be neglected in this case. Thus, a Maxwellian distribution with $n=n^a, \; V=0, \; T=T^a$ is assumed for the hot particles within the domain $[x_L,x_R]$
 that is occupied by a colder Maxwellian plasmoid with parameters $n^p(x,t),\; V^p(x,t),\; T^p(x,t)$
 .
.
The expression for the energy exchange between two Maxwellian populations, valid for any masses and temperatures, is given in the paper by Dnestrovskii & Kostomarov (Reference Dnestrovskii and Kostomarov1985), (2.2.21):

Equation (4.8) describes electron–electron energy exchange between the ambient plasma and the plasmoid, but it is not accurate for ion–ion collisions in our case, because the pellet ions can move faster along the field lines than their thermal speed. A more accurate expression for the ion–ion energy exchange is given by (17.24) of the paper by Trubnikov (Reference Trubnikov1965),

where $u_0 \equiv \sqrt {m_i V_0^2/2 T_i^a}$ , $\tau _a$
 is the simplest time (4.4), calculated using the parameters of the ambient plasma. The corresponding expression for the braking of the pellet ions by collisions with the ambient plasma is obtained from (18.1) of the paper by Trubnikov (Reference Trubnikov1965),

Given that we treat the plasmoid as being transparent to the ambient particles, we set $S_n \equiv 0$ .
.
5. Initial opaque phase of expansion
In the experiments reported by Baldzuhn et al. (Reference Baldzuhn, Damm, Beidler, McCarthy, Panadero, Biedermann, Bozhenkov, Dinklage, Brunner and Fuchert2020) and Bozhenkov et al. (Reference Bozhenkov, Kazakov, Ford, Beurskens, Alcusón, Alonso, Baldzuhn, Brandt, Brunner and Damm2020) pellets were injected into a plasma of density $5 \times 10^{19}\ \textrm {m}^{-3}$ and approximately 4 keV electron and 2 keV ion temperature. The expected field-line-integrated plasmoid density, suggested by the experimental observations,is approximately $N_l \approx 10^{22}\ \textrm {m}^{-2}$
 . As discussed in § 2, such a plasmoid is initially not fully transparent to the ambient ions, but it is transparent to the ambient electrons. As a result, the heating profile initially is not uniform and the slowing down of ambient plasma particles (mostly ions) results in an external pressure which hinders expansion. As the plasmoid temperature increases, it becomes transparent to the ambient ions and the effects of non-uniform heating and external pressure vanish. In order to demonstrate that the finite initial opacity does not have a significant effect on the subsequent plasmoid dynamics we calculate the expansion using the two models for the ambient plasma discussed in § 4.
Figure 3 shows evolution of the central electron temperature ($T_e$ ) and the width of the plasmoid ($L_\mathrm {HWHM}$
 ), which is defined as a half-Width at half-maximum (HWHM) during the first $25\ \mathrm {\mu }\textrm {s}$
 of the plasmoid expansion. Three snapshots (at $0.1\ \mathrm {\mu }\textrm {s}$
 , at $1\ \mathrm {\mu }\textrm {s}$
 and at $25\ \mathrm {\mu }\textrm {s}$
 ) of the plasmoid density, electron and ion temperature profiles are also shown. The red curves show results of the calculations using the kinetic model for the ambient plasma, whereas the black curves are obtained using the low-collisionality ambient plasma model discussed in § 4.1.
Evolution of the plasmoid central electron temperature ($T_e$ ) and size ($L_\mathrm {HWHM}$
 ) calculated in two limits: kinetic ambient plasma with effect of ambient pressure and inhomogeneous heating (red curves) and in low-collisionality limit (black curves). Three snapshots (c–h: at $0.1\ \mathrm {\mu }\textrm {s}$
 , at $1\ \mathrm {\mu }\textrm {s}$
 and at $25\ \mathrm {\mu }\textrm {s}$
 ) of the plasmoid density profiles ($n$
 ), electron (solid) and ion (dashed) temperature profiles ($T$
 ) are shown.

These calculations demonstrate that initially the ion temperature follows closely the electron temperature in the region of high density due to very strong collisional coupling in the plasmoid, as discussed in § 2. These temperature profiles later decouple as the plasmoid temperature increases. The first two snapshots of the electron temperature profile (at $0.1\ \mathrm {\mu }\textrm {s}$ , at $1\ \mathrm {\mu }\textrm {s}$
 ) show the effect of the inhomogeneous heating, i.e. the electron temperature is elevated in the external region of the plasmoid (i.e. within the penetration depth of the ambient particles). This inhomogeneity vanishes as the plasmoid is heated, due to the increased transparency and heat conductivity (see the flat profiles on the $25\ \mathrm {\mu }\textrm {s}$
 snapshot).
It is instructive to investigate the effect of ambient pressure on the evolution of the plasmoid. Figure 4 shows the evolution of the integrated momentum source $\int _0^\infty S_V\, {\textrm {d} x}$ normalized to the ambient hydrodynamic ion pressure $n^a T^a_i$
 . It is evident that initially, when the plasmoid is not transparent to the ions, the total momentum source is approximately equal to the ambient ion hydrodynamic pressure (the electron friction contributes to $S_V$
 insignificantly). As the plasmoid is heated, the ion mean free path increases and the friction forces from the left and the right ambient fluxes start to cancel each other. The net ambient force is then reduced drastically. The subsequent evolution of the plasmoid is thus equivalent to expansion into a vacuum (Aleynikov et al. Reference Aleynikov, Breizman, Helander and Turkin2019).
Evolution of the integrated momentum source $\int _0^\infty S_V \,\textrm {d}x$ normalized to the ambient hydrodynamic pressure $n^a T^a$
 (dashed curve, left axis). Ratio of the plasmoid electron pressure to the ambient electron pressure (solid curves, right axis). Colours as in figure 3.

The solid curves in figure 4 (right axis) show the evolution of the plasmoid electron pressure normalized to the ambient electron pressure (colours are as in figure 3). It is evident that in this particular example, the plasmoid pressure is always much higher than the ambient plasma pressure, except for the later phase (after $10\ \mathrm {\mu }\textrm {s}$ ), when the actual momentum exchange is much lower than the hydrodynamic pressure. The dashed–dotted curve shows the pressure obtained from the corresponding self-similar solution (2.19) and in the paper by Aleynikov et al. (Reference Aleynikov, Breizman, Helander and Turkin2019). All three solutions agree in the later stages of expansion.
It is noteworthy that after initially different evolution of the density profiles (see the evolution of the width $L_\mathrm {HWHM}$ and the snapshots at $1\ \mathrm {\mu }\textrm {s}$
 ), the profiles exhibit a remarkable agreement in the later stage of expansion (see the snapshots at $25\ \mathrm {\mu }\textrm {s}$
 ). This is not a coincidence. Indeed, during the initial ‘cold plasmoid’ phase the heating is not homogeneous, the ambient pressure is present, and the plasmoid electron and ion temperatures are comparable so that the dynamics is governed by the full system (3.3). However, as the plasmoid is heated, these effects vanish and the long-term evolution is governed by the reduced system (2.16), which admits a self-similar solution. These solutions often act as attractors (intermediate asymptotics) for solutions with arbitrary initial conditions. It is therefore expected that ‘further’ away from the ‘cold plasmoid’ phase the solutions of the full system will agree with the reduced system (2.16) regardless of the initial conditions. In § 6 we will investigate the long-term expansion of the plasmoid.
6. Results and discussion
Here we investigate the long-term evolution of the plasmoid. It is expected that these solutions will agree with the self-similar solutions of the reduced system (2.19). The calculations are performed for the plasmoid and plasma parameters relevant to the W7-X pellet injection experiments: the ambient electron and ion temperatures are $T^{a} = 4\ \textrm {keV}$ and the ambient plasma density is $5 \times 10^{19}\ \textrm {m}^{-3}$
 . We present the results for the plasmoids of several different densities.
Figure 5 shows the evolution of the central electron ($T_e$ ) and ion ($T_i$
 ) temperatures, plasmoid length ($L_\mathrm {HWHM}$
 ), and the total plasmoid electron ($E_e$
 ) and ion ($E_i$
 ) energies. These plots result from two different calculations. The first one uses the full system ((3.8)) with the sources ((4.8)–(4.10)) (black curves). The second represents the analytical model based on (2.16) (red curves). The only heating source in the analytical model is the electron collisional coupling with the ambient plasma calculated using (4.8). The plots also show the time-dependent ambipolar potential ($\phi _\mathrm {max}$
 ) (solid curve) and normalized central density ($\log _{10}(n^p_0/n^a)$
 ) (dashed curve). In the case shown in figure 5, the ambient plasma temperature is 4 keV and the density is $5 \times 10^{19}\ \textrm {m}^{-3}$
 . The electron energy consists only of thermal electron energy, $E_e = \int _{-\infty }^{\infty } n^p T_e \,{\textrm {d} x}$
 , while the ion energy is a sum of thermal and kinetic energies, $E_i = \int _{-\infty }^{\infty } n^p T_i\, {\textrm {d} x} + \int _{-\infty }^{\infty } n^p ({m_i V^2}/{2}) \,{\textrm {d} x}$
 .
.
Evolution of the (a) central electron ($T_e$ ) and ion ($T_i$
 ) temperatures, (b) plasmoid length ($L_\mathrm {HWHM}$
 ), (c) potential at the origin $\phi _\mathrm {max}$
 , and (d) the energy of the plasmoid components ($E_i$
 , $E_e$
 ). Red curves, analytical model (2.19); black curves, full system (3.8). The line integrated plasmoid density is $N_l = 0.5 \times 10^{22}\ \textrm {m}^{-2}$
 . The ambient plasma temperature is $T^{a} = 4\ \textrm {keV}$
 and the corresponding density is $5 \times 10^{19}\ \textrm {m}^{-3}$
 .
.

As discussed in §§ 2 and 5, the plasmoid is very dense and cold initially as well as during the first few $\mathrm {\mu }\textrm {s}$ in figure 5. Consequently, the collisional coupling between cold electrons and ions is then strong enough that their temperatures are almost equal. Once the temperature increases, the coupling weakens. The analytically predicted ion temperature at decoupling, $T^{\max }_{i} \approx 50\ \textrm {eV}$
 (see (2.15)), is in good agreement with the numerical calculations (${\approx }46\ \textrm {eV}$
 ).Footnote 2
During the next stage of the expansion, the ion heating is relatively weak. The $T_e$ becomes almost homogeneous within the plasmoid, because of the high electron heat conductivity. The ions are accelerated by the pressure gradient but remain quite cold, and their heat conductivity and viscosity remain small. Although the ions are cold, their kinetic energy actually exceeds the electron thermal energy, as shown in figure 5. The black solid curve in figure 5(d) shows the ambipolar potential determined by (2.7). We note that this potential grows initially, due to the increase of the plasmoid temperature. However, the potential later decreases, as the temperature growth slows down and the plasmoid density drops. In this particular case, the potential is always significantly lower than the ambient plasma temperature (4 keV) and can, therefore, be neglected at all times.
The analytical and numerical models agree well for the majority of the expansion, except at the very beginning, where the ion and the electron temperatures are comparable, and the cold ion approximation of the analytical model is not justified. Yet, due to the relatively low decoupling temperature, the further expansion is covered accurately by both models. The calculations are terminated when the central plasmoid density, shown with a dashed curve in figure 5(d), approaches the ambient plasma density.
Figure 6 compares the profiles of density ($n$ ), flow velocity ($V$
 ), ion temperature ($T_i$
 ) and normalized mean free path at $t=50 \mu$
 s. The figure shows the results for the same models as those in figure 5 (black, ‘full’ numerical model; red, analytical). For the most part, the numerical calculations show Gaussian density profiles and linear velocity profiles, in agreement with the analytical solution. A noticeable difference is only at the edges of the plasmoid where the hydrodynamic description is problematic as discussed below.
(a) Density ($n$ ), (b) flow velocity ($V$
 ), (c) ion temperature ($T_i$
 ) and (d) the normalized mean free path profiles at $t = 50\ \mathrm {\mu }\textrm {s}$
 during plasmoid expansion. Colour codes and plasma parameters as in figure 5.

A linear velocity profile is characteristic for the expansion of plasma into a vacuum and is also seen under other conditions (Gurevich, Pariiskaya & Pitaevskii Reference Gurevich, Pariiskaya and Pitaevskii1966). Our numerical experiments show that solutions always converge to the self-similar profiles (i.e. Gaussian density and linear velocity) at the late stage of expansion.
Unlike the electron temperature, the ion temperature profile exhibits a large increase toward the edges (see $T_i$ plots in figure 6) during the expansion. This temperature increase is predominantly due to viscous ion heating, which is inversely proportional to the collision frequency and therefore progressively more important as the density of the cloud drops and the temperature increases. It reaches its maximum when the mean free path becomes comparable to the length of the cloud, at which time Braginskii's equations used in the hydrodynamic treatment of the problem breaks down (see $\lambda _c/L$
 plot in figure 6).
Similar to figure 5, figure 7 shows the evolution of the central electron and ion temperatures ($T_e$ and $T_i$
 ), plasmoid length ($L_\mathrm {HWHM}$
 ), the ratio of ion to electron energy ($(E_i^K + E_i^T)/E_e^T$
 ) and the potential at the origin ($\phi _\mathrm {max}$
 ) for plasmoids of three different densities. The dashed–dotted curves on the length plot ($L_\mathrm {HWHM}$
 ) show the actual finite size of the plasmoid. The black curves correspond to the cases in figures 5 and 6 ($N_l = 0.5 \times 10^{22}\ \textrm {m}^{-2}$
 ), whereas the blue and the green curves refer to $N_l = 3 \times 10^{22}\ \textrm {m}^{-2}$
 and $N_l = 6 \times 10^{22}\ \textrm {m}^{-2}$
 , respectively. The red curves represent the density-independent analytical prediction using (2.19).
Comparison of the evolution of the (a) central electron and ion temperatures ($T_e$ and $T_i$
 ), (b) plasmoid length ($L$
 ), (c) ratio of the ion to the electron energy ($(E_i^K + E_i^T)/E_e^T$
 ) and (d) the ambipolar potential at the origin for plasmoid with different line-integrated densities. Colour codes and the plasma parameters as in figure 5, with the addition of blue curves for $N_l = 3 \times 10^{22}\ \textrm {m}^{-2}$
 and green for $N_l = 6 \times 10^{22}\ \textrm {m}^{-2}$
 .
.

After an initial transient, excellent agreement between the analytical and the numerical models is observed for all densities. Both models use the same per particle heating source given by (4.8), except that ion–ion collisions are taken into account in the full system. This explains the somewhat higher ion to electron energy ratio ($(E_i^K + E_i^T)/E_e^T$ ) in the ‘full’ numerical model. The resulting ion temperature does not affect the expansion significantly. The decoupling temperature increases with the plasmoid density, as expected from (2.15).
The maximum ambipolar potential achieved during the expansion is higher for the higher-density cases ($\phi _\mathrm {max} = 2.5\ \textrm {keV}$ for $N_l = 3 \times 10^{22}\ \textrm {m}^{-2}$
 and $\phi _\mathrm {max} = 3.5\ \textrm {keV}$
 for $N_l = 6 \times 10^{22}\ \textrm {m}^{-2}$
 ), thus reducing the accuracy of the calculations. This maximum is achieved when the plasmoid length is approximately 50 m.Footnote 3 A more rigorous kinetic treatment of the ambient plasma is required to make quantitative calculations for the later stages of the plasmoid assimilation for such densities.
Note that the ‘black’ and the ‘green’ cases represent two distinct assimilation scenarios: in the low density ‘black’ case, the plasmoid temperature is still lower than the ambient plasma temperature when their densities equalize; in the higher density ‘green’ case, the plasmoid and the ambient plasma temperatures approach each other when the plasmoid is still very dense. The subsequent final assimilation is different in these two cases.
A noteworthy prediction of the analytical model (Aleynikov et al. Reference Aleynikov, Breizman, Helander and Turkin2019) is the 50/50 partitioning of the deposited energy between the plasmoid electrons and ions. The ions are accelerated during the expansion, which happens on the electron heating time scale. The accelerated ions subsequently thermalize with the ambient ones on the ion collisional time scale, which is much longer. This is sometimes the dominant mechanism of ion heating during pellet injection in the W7-X. The time-dependent ratio of the ion energy to electron energy ($(E_i^K + E_i^T)/E_e^T$ ) during the expansion is shown in figure 7. This ratio is higher in the full model than the analytical prediction (red curve). This is because of the finite ion temperature (neglected in the analytical model). The ratio itself grows during the later stages of expansion and generally exceeds the 50/50 partitioning for the constant heating case. It is, therefore, expected that most of the deposited energy ends up in the ions rather than in the electrons in realistic scenarios.
Figure 8 shows the evolution of the plasmoid parameters for different ambient temperatures: $T^a = 2\ \textrm {keV}$ (black), $T^a = 4\ \textrm {keV}$
 (blue), $T^a = 8\ \textrm {keV}$
 (green). The expected dependence of the plasmoid size ($L$
 ) on the ambient temperature is $L \sim \sqrt {T_e} \sim \sqrt {Q} \sim \sqrt { \nu _{e,eh} T^a} \sim (T^a)^{-{1}/{4}}$
 . Yet, for the chosen parameters, the dependence is weaker than that, because of the heating rate reduction due to the finite ${T^a}/{T}$
 ratio, i.e. $Q \sim (T - T^a)$
 . These results suggest a certain universality of the expansion dynamics with respect to different plasma and plasmoid parameters (remember that the self-similar solution suggests independence of the plasmoid density as well). Note that the effect of the ambipolar potential on the ambient plasma has been neglected in these simulations. This assumption can now be justified for the higher temperature cases. The result for $T^a = 2\ \textrm {keV}$
 (black case) should be considered as qualitative.
Comparison of the (a) evolution of the central electron and ion temperatures ($T_e$ and $T_i$
 ), (b) plasmoid length ($L$
 ), (c) ratio of the ion to the electron energy ($(E_i^K + E_i^T)/E_e^T$
 ) and (d) the ambipolar potential at the origin ($\phi _\mathrm {max}$
 ) for plasmoids with $N_l = 3 \times 10^{22}\ \textrm {m}^{-2}$
 for three different ambient plasma temperatures: $T^a = 2\ \textrm {keV}$
 (black), $T^a = 4\ \textrm {keV}$
 (blue), $T^a = 8\ \textrm {keV}$
 (green). Blue curves are the same as in figure 7.

7. Summary
In this paper, we have revisited the self-similar solution for plasma expansion into a vacuum of Aleynikov et al. (Reference Aleynikov, Breizman, Helander and Turkin2019) and compared it with a new and more complete model. For the conditions relevant to the W7-X pellet experiments, good agreement was found between the models. Both models assumed that the pellet ablation is much faster than the expansion, i.e. no external particle sources were taken into account. This assumption is well justified for fast pellets (${>}1000\ \textrm {m}\ \textrm {s}^{-1}$ ), but is problematic for slower pellets.
The presented results show that over 50 % of the energy given to the pellet (mostly by electrons) ends up as ion kinetic energy. This effect may help to explain the ion temperature observations during pellet injection in the W7-X experiments (Baldzuhn et al. Reference Baldzuhn, Damm, Beidler, McCarthy, Panadero, Biedermann, Bozhenkov, Dinklage, Brunner and Fuchert2020; Bozhenkov et al. Reference Bozhenkov, Kazakov, Ford, Beurskens, Alcusón, Alonso, Baldzuhn, Brandt, Brunner and Damm2020), where no significant loss of the ion temperature was observed during the injection of a pellet sequence despite a considerable rise in density.
We have also demonstrated two significant limitations of the hydrodynamic approach to the problem of plasmoid expansion: first, the plasmoid ions need to be treated kinetically at the later stages of expansion, because their mean free path becomes comparable to the plasmoid size; and second, an accurate calculation of the power deposition from the ambient plasma would require accounting for the ambipolar potential.
Acknowledgements
The authors are grateful to Alexey Mishchenko and Håkan Smith for helpful comments.
Editor Troy Carter thanks the referees for their advice in evaluating this article.
Funding
The work of B.N.B. was supported by the U.S. Department of Energy Contract Nos. DEFG02-04ER54742 and DESC0016283.
Declaration of interests
The authors report no conflict of interest.


 Open access

