
IntroductionFootnote 1
Social salience is the association of a social category (e.g., age, gender, socioeconomic class, or ethnicity) with linguistic variables (phonological, lexical, morpho-syntactic, or discourse-pragmatic). The most enduring categorization of social salience has been Labov’s (Reference Labov1972) “stereotypes,” “markers,” and “indicators,” where “stereotypes” are variables explicitly associated with social categories in a speech community and therefore have the strongest salience; “indicators” pattern according to social groups but are below the level of awareness in the community; and “markers” lie in between, where speakers have limited awareness of the salience of a variable but adjust usage to different social situations or levels of formality. One of the interests in social salience is its connection with language evolution. Many people predict that variants with higher social salience, that is, “stereotypes” or “markers,” will have greater rates of change in language evolution (e.g., Baxter et al., Reference Baxter, Blythe, Croft and McKane2009; Hinskens, Reference Hinskens1996; Kerswill & Williams, Reference Kerswill, Williams, Jones and Esch2002; Labov, Reference Labov1972:178-179, Reference Labov1994:78; Rácz, Reference Rácz2013; but see Trudgill, Reference Trudgill1986 for a different perspective).
Before we can test this prediction, we first need to be able to rank variables according to their relative social salience within a speech community. Perception experiments have been used to determine the degree to which a variable has social salience by assessing the extent to which listeners from a speech community converge on an association of a variant with a social category. Most of these experiments have involved tests of individual variables, such as matched guise tests (cf. Lambert et al., Reference Lambert, Hodgson, Gardner and Fillenbaum1960). Other rating tasks ask participants to listen to linguistic stimuli, mostly individual variables, and indicate their response on a scale (e.g., a Likert Scale or Visual Analog Scale) (see Drager, Reference Drager2018). In order to test the relative salience of linguistic variables, however, tests of multiple variables are required. We review some existing studies in the following section which provide gradient and relative measures of the salience of multiple variables. We argue that they are limited due to the issue of pair-wise bias in the experimental setups which forces participants to choose one social category or another in response to linguistic stimuli.
In this study, we present a new approach—Salience Categorization Test (Sali-CAT)—to model the social salience of multiple variables in the Gurindji speech community of northern Australia. The community is undergoing a shift between the heritage language (Gurindji) and a newer contact language (Kriol). Specifically, we address the issue of pair-wise bias by adopting a three alternative forced choice (3AFC) perception paradigm to test the relative association of multiple variables with different generations of speakers. We focus on the social category of “generation” because it is meaningful for this community given the sociohistorical setting and ongoing language shift. We start with an existing production dataset that allows us to select words that have variants showing biased usage across generations. This allows us to test whether community members recognize language usage bias and identify those language variants as socially salient with respect to the social category of generation. We use a 3AFC task to avoid pair-wise bias by giving participants three choices: whether a given variant is used by “elder,” “youth,” or “everyone.” The “everyone” choice is important because it allows participants to say that a variant does not distinguish “generation.” We summarize participant responses to a word variant as how often participants choose “elder” or “youth” compared to “everyone.” To detect a significant association between a word variant and “generation,” we compare participant responses to a baseline, which is the response to word variants that are used by “everyone,” not biased toward a particular generation. We set this baseline using responses to five words that have only one variant which is used by all members of the community. We then explain each step of Sali-CAT in detail, starting from word selection, then moving to the design and execution of the 3AFC task and the use of the results of the 3AFC task to quantify salience and test significance by comparison to the baseline.Footnote 2
For each variant, Sali-CAT produces Sali-RAT scores which are a ratio measure of relative social salience across the multiple variants in the speech community. One of the potential advantages of Sali-CAT is that we can ultimately test whether salience influences rates of uptake and loss across time. The extent to which Gurindji or Kriol features are associated or not associated with the social category of generation, that is, social salience measured as Sali-RAT, may affect rates of uptake and loss in an evolutionary model, an idea we take up in a subsequent study. In this paper, we focus on the methods (Sali-CAT) for establishing relative ratio measures of social salience across multiple variables (Sali-RAT).
Tests of social salience across multiple variables
Before we introduce Sali-CAT, we review some existing approaches to measuring salience across multiple variables. These studies show that the perceptual salience of variables can be gradient (not simply categorically “salient” or “not salient”) and relative (more or less “salient” compared to other variants).
An early study of the perceptual social salience of multiple variables is Graff et al.’s (Reference Graff, Labov, Harris and Sankoff1986) examination of the relative association of two vowel variables, /aw/ and /o/, with Black or White speakers of American English (their terms). Their starting point was production studies where both vowels were found to be fronted by White American English speakers and backed by Black American English speakers. Graff et al. (Reference Graff, Labov, Harris and Sankoff1986) then created a set of synthesized /aw/ and /o/ vowels, varying in front and back pronunciations, and embedded them in two sentences produced by White speakers and Black speakers. Participants rated each sentence from 1 to 7, where 1 was “sounds very Black” and 7 was “sounds very White.” Three times as many participants positioned the fronted /aw/ variant on the “sounds very White” end of the scale as on the “sounds very Black” end of the scale. On the other hand, front and back /o/ produced no significant difference in rating of Whiteness or Blackness. These results indicate that /aw/ is more socially salient than /o/ for identifying perceived ethnicity.
In another study of American English, Fridland et al. (Reference Fridland, Bartlett and Kreuz2004) tested whether participants from Memphis (Tennessee) associated the formants of seven vowels /ɪ, i, e, ɛ, u, ʊ, ow/ with either Southern or Northern speakers. They found that the social salience of vowels varied in their association with these two groups, with /o/ the most salient and /i/ the least. Other studies include Levon’s (Reference Levon2014) modified matched-guise paradigm, which tested the social salience of three phonetic variables and intersecting categories of gender, sexuality, and social class among men in the United Kingdom, and MacLeod’s (Reference MacLeod2012) study of the effect of social salience on phonetic accommodation between Spanish speakers on six variables.
Llamas et al. (Reference Llamas, Watt and MacFarlane2016) attempted to solve the problem of pair-wise bias by measuring both the association and non-association of a variable with different social categories. They created an experimental paradigm called the Social Category Association TestFootnote 3 to assess the relative salience of four variables in English-speaking communities in the border zone between Scotland and England: /r/ in coda position; tapped or approximant realizations of /r/ in onset position; short or long realizations of fleece; and front or back realizations of goose. Variables were chosen for their differences in production by Scottish and English speakers. Forty participants heard a variant and categorized it according to “England/Not England” in one run, then “Scotland/Not Scotland” in another run. Participants were shown to respond faster (response time) and more consistently (categorical choice) to highly salient variants than to low salience variants. Although Llamas et al.’s (Reference Llamas, Watt and MacFarlane2016) test of association and non-association of variables with social categories attempted to avoid pair-wise bias by allowing for non-association, that is, by using “Not England” and “Not Scotland” as options, the results suggest that the association with one social category (e.g., Scotland) implies the non-association with the other social category (e.g., English). For example, they found a high degree of agreement between participants in the categorization of variants of the two /r/ variables as both “England/Not Scotland” and “Scotland/Not England,” and no variants which had “Not Scotland” or “Not England” as salient, that is, salience ultimately only related to consensus around association, not non-association.
In Sali-CAT, we avoid this pair-wise bias by using a 3AFC task so participants are not forced to choose between two social categories. The three choices in the task contain pictures of two target social categories, “youth” and “elder,” and a third choice, “everyone.” Because we are avoiding a pair-wise bias, a single variant can have multiple kinds of salience. For example, if a variant is often selected as being used by “youth” or “elder,” then it has “positive association” with “youth” or “elder” (i.e., it is recognized as being used by youth or elders). If a variant is rarely selected as being used by “youth” or “elder,” then it has “negative association” with “youth” or “elder” (i.e., it is recognized as not being used by youth or elders). If a variant is often selected as being used by “everyone,” then it has a “lack of association” with a specific generation (i.e., it is recognized as being used by both “youth” and “elder”). The notion of a single variant having multiple kinds of salience is demonstrated with the variable ‘fire’ and its variants warlu (from Gurindji) and faya (from Kriol). Quantification and significance tests for each of these kinds of salience are described in the following sections.
The 3AFC task asks participants to assign linguistic variants to discrete social categories. Our analysis produces gradient and relative measures of social salience for each variant (Sali-RAT score). Each of the 74 participants assesses the social salience of the variants three times (with some variants being assessed once) (Appendix A). Gradience is achieved by pooling results of trials and participants (i.e., each variant is assessed 222 times, with some variants 74 times). Therefore, each variant has a different Sali-RAT score which can then be compared with other variants, producing a relative measure of salience. This gradient and relative measure ultimately allows a more nuanced modeling of the rate of uptake and loss of linguistic variants in evolutionary models according to their level of salience.
Finally, we note that different groups of speakers within the same community may judge certain variants as salient whereas others may not, which might depend on the characteristics of individual speakers; that is, there might not always be community consensus on which variants are salient and which ones are not. In a following section, we test whether a speaker’s age or gender impacts their assessment of word variant salience or whether the entire community tends to converge on perceptions of salience.
Generation as a social category in Gurindji language change
In this paper, we are considering the relative salience of variables in relation to the social category of “generation,” which are labeled “youth” and “elder” in the 3AFC perception task. The use of “generation” as a social category—in the same way as gender, social class, ethnicity, etc.—requires some justification because generation is often used in apparent time studies of language variation and change to map change over time (Bailey et al., Reference Bailey, Wikle, Tillery and Sand1991; Labov, Reference Labov1963). Generation has rarely been studied as a social category (e.g., Eckert, Reference Eckert and Coulmas1997). In this section, we show that generation has a socio-historical reality for Gurindji people and that many linguistic variables pattern according to generation.
Gurindji people mostly live in northern Australia, in Kalkaringi, which has a mostly Gurindji population of around 600 people. In the community, there is a shift underway from Gurindji, the traditional language of the region from the Pama-Nyungan language family, to Kriol, the English-lexifier Creole spoken across much of northern Australia. Code-switching between Gurindji and Kriol has also led to the emergence of the mixed language Gurindji Kriol. This complex language ecology is the result of recent socio-historical circumstances. Gurindji Country was colonized by the British from the 1860s onwards to establish cattle stations, including Wave Hill Station. After a period of massacres, which continued into the early 20th century, Gurindji people were brought to work on Wave Hill Station. The working and living conditions were harsh, and in 1966, Gurindji people walked off Wave Hill Station in protest and established a new community at Daguragu and later Kalkaringi. This history has resulted in generational differences in language usage.
Generation 1 (born ∼ 1940s-1960s) This group is the generation who grew up on Wave Hill Station and walked off the station in 1966, establishing their own community. They also spearheaded the return of part of Gurindji Country in 1975 (symbolically) and 1986 (legally). For this generation, Gurindji identity was highly salient in the land rights and labour union movements. They are bilingual in Gurindji and Kriol, and frequently code-switch between the languages. Only some of this generation had access to formal education in English.
Generation 2 (born ∼ 1970s-1990s) This group was the first generation to grow up in the new community, away from station life. They are the generation who “created” Gurindji Kriol from the code-switching practices of the previous generation and the first generation who had sustained and equitable access to English-based schooling.
Generation 3 (born ∼ 2000s-2010) This group is the second generation of Gurindji Kriol speakers. They have received English-based schooling.
Across three generations of Gurindji people, there has been a shift towards a higher use of Kriol lexicon and morpho-syntax, and a narrowing of variation both within and between speakers (Bromham et al., Reference Bromham, Hua, Algy and Meakins2020; Meakins et al., Reference Meakins, Hua, Algy and Bromham2019). In this respect, generational differences are representative of language change, as per the apparent time hypothesis. Nonetheless, generation is also a social category. In Hua et al. (Reference Hua, Meakins, Algy and Bromham2022:104), we argued that generation is “reflected in a social reality, in the historical events which led to the establishment of the Gurindji communities.” In that study, we analyzed 185 variables (with 357 Gurindji and Kriol variants) and showed that clusters of variables pattern according to generation, rather than simply patterning with participant age, which is indicative of apparent time. The variables used in this study are drawn from the set of variables that show generational clustering in the Hua et al. (Reference Hua, Meakins, Algy and Bromham2022) study.
Association of words with different Gurindji generations
Methods
This section describes our 3AFC experiment. We first detail the selection of linguistic variables for the experiment and then describe the creation of the stimuli and the interface and procedures involved in presenting the experiment to the participants. We then provide demographic information relating to the participants and detail how the data was analyzed. Finally, we define the measure of salience (Sali-RAT) in this analysis.
How variables were chosen
Variables were chosen as stimuli for the 3AFC task for their significant differences in language production by three generational groups in the Gurindji Kriol dataset, plus five control words that do not differ in usage among generations. Lexical variables were chosen over grammatical variables due to ease of illustration, that is, each audio stimulus was accompanied by a picture to aid the participant (see Fig. 1).
(A) Image of ‘lightning’ presented with the audio of either laitning or janginyina (Kriol and Gurindji for ‘lightning,’ respectively) followed by (B) response options (left B) karu ‘youth,’ (center B) Everybody ‘everyone,’ and (right B) Pulka ‘elder.’

The original Gurindji Kriol dataset contains 185 variables (with 357 variants) as used by 78 speakers. In Hua et al. (Reference Hua, Meakins, Algy and Bromham2022), we performed a Discriminant Correspondence Analysis to assess which social factors are most important in clustering Gurindji speakers’ use of 185 variables. Generation was the strongest factor of the five social factors tested. In this study, we test the association between linguistic variables and the social category of generation, so we selected variables that speakers from different generations use differently in the production data according to Hua et al. (Reference Hua, Meakins, Algy and Bromham2022). This resulted in a dataset of 34 lexical variables (with 75 word variants). Because these variables are chosen for how they pattern by generation in the production data, we need a comparison against which to test their relative salience. Therefore, we also include five control words which have only one form used in this community, so everyone uses them (i.e., they do not pattern by generation). Because there is no variation in the use of these words, we use responses to control words to set the baseline, that is, the degree of “scatter” of responses for words that have no usage bias in the community. This baseline is important because it allows us to identify significant departures from observed variation in responses to detect variants with a significant positive or negative association with a social category. The full dataset consists of the 34 words that show different patterns of variant usage across generations and the five control words that are used by everyone (a total of 80 word variants).
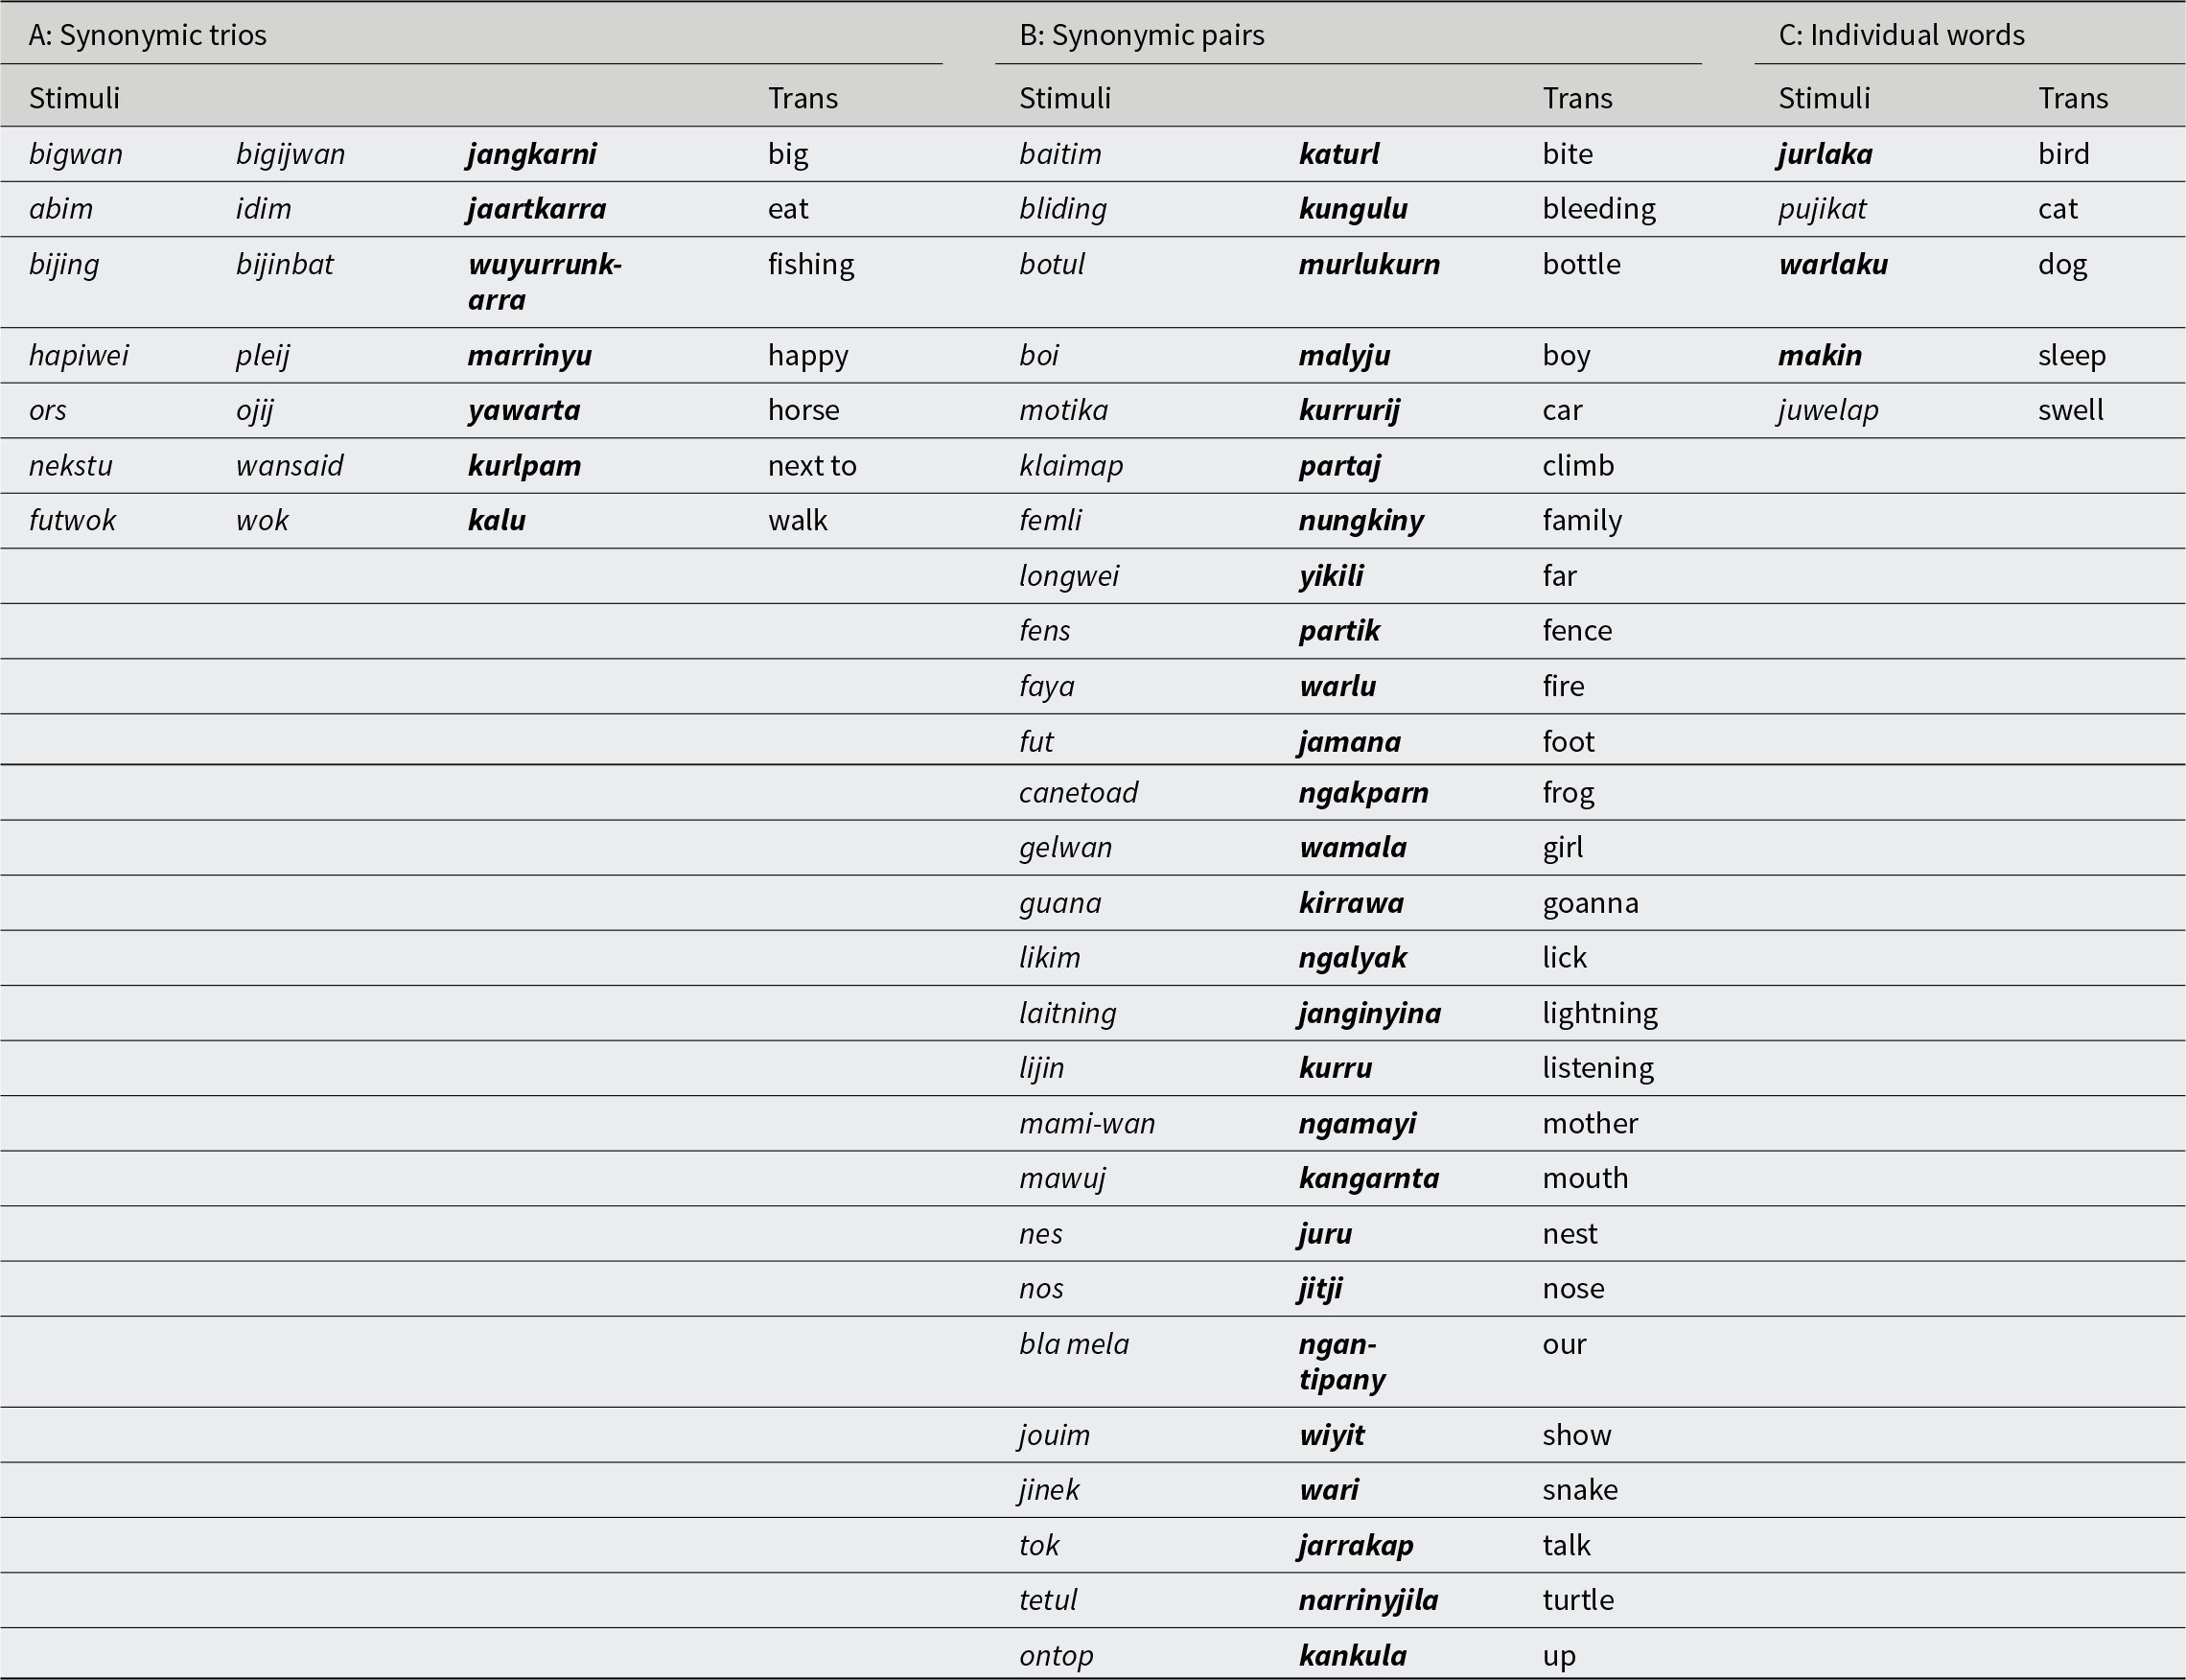
In all, 44 word variants were of Kriol origin, and 36 were of Gurindji origin (see Table 1). There were 27 synonymic pairs differing by language of origin (e.g., Kriol-origin ontop ‘up’ and Gurindji-origin kankula ‘up’) and seven synonymic trios involving two Kriol-origin words and one Gurindji-origin word (e.g., Kriol-origin nekstu ‘next to,’ Kriol-origin wansaid ‘next to,’ and Gurindji-origin kurlpam ‘next to’). Five control words are singletons that are used categorically by the entire Gurindji community.
Experimental stimuli (Gurindji-origin words bolded)

Creation of stimuli
To gather perception data for our experiment, we created audio recordings of 80 Gurindji and Kriol words produced by a single female speaker from Generation 2. A Generation 2 speaker was chosen as the most “neutral” voice rather than an older woman from Generation 1 or a girl from Generation 3, which would have skewed participant choices, since two of the response pictures were of an older woman (“elder”) and a girl (“youth”) (see Fig. 1). All participants recognized the speaker but this should not affect the results since there was no Generation 2 target picture. Words were recorded using an Edirol R09 portable digital recorder with a Sony lapel mic (40-20,000 Hz response) at a sample rate of 44.1 kHz.
3AFC identification task experiment
The experiment was designed and presented in MS PowerPoint and programmed using Visual Basic for Applications to capture participant information and responses. A PC with a touch screen was used to run the experiment.
Participants were first asked to input their name, age, and gender. The next slide started the orientation phase of the experiment. This involved 10 practice examples where the participants were told in a pre-recorded helper phrase by Algy, a female speaker of Gurindji Kriol from Generation 2, how to complete the tasks. These slides were identical to the actual experiment but did not capture participant responses and presented participants with the phrase target word, Wijan-tu tok nyununy? ‘target word, Which person is talking to you?’ During this phase, the researcher informed the participants that they would hear a word and they were to associate it with a specific generation (if any) based on their intuitions. Participants were also informed that they would hear each word more than once throughout the experiment. The three response options included karu ‘youth’ (i.e., this is a word that children tend to use), ebribodi ‘everyone’ (i.e., this is a word that all generations use), and pulka ‘elder’ (i.e., this is a word that older people tend to use). Both the terms karu and pulka are gender neutral. Pictures of a girl (“youth”) and an older woman (“elders”) were used because the stimuli were spoken by a woman, so we were aiming to minimize any gender effects. Participants were asked to touch the image of their choice on the touch screen to register their response.
Once the orientation phase was complete, the experiment began with the helper phrase removed and responses recorded. Each task involved an image of a given stimulus on a slide, followed by a 2,000 ms delay before a corresponding audio sample played. After the audio sample concluded, the presentation automatically transitioned to the following slide after 1,000 ms to present the participant with three possible response options: karu ‘youth;’ ebribodi ‘everyone;’ and pulka ‘elder,’ with corresponding images (Fig. 1). Images were mostly drawn from Australian Indigenous Languages Image Bank (AILIB) (Kral et al., Reference Kral, Disbray and Green2022) and were colorized by a graphic designer to make them more engaging for participants. The participants were given the opportunity to hear the word again by touching the speaker icon and to return to the previous slide to see the image again, if they chose to. However, during the orientation phase, researchers urged participants to go with their first instinct. Response times were not measured, only the choice.
The experiment had three repetitions of each variant. Therefore, participants listened to 240 audio samples (80 words × 1 or 3 repetitions). Participants completed this as one block which took around 20 minutes. The order of the stimuli was randomized then adjusted to make sure repetitions of the same word did not follow each other. Adults were paid $25 to participate and children’s caregivers were paid $25 for their participation.
Participants
Seventy-four Gurindji people participated in this experiment. They included 54 women/girls and 20 men/boys from four generations (Table 2). There was some crossover with the 78 participants from the production data (discussed in a previous section). Note that Generations 1, 2, and 3 reflect Generations 1, 2, and 3 in the production data, but they have since aged. Therefore, a child from the production data may now be an older teenager but remains Generation 3 because we treat “generation” as a social category. We now have a fourth generation, Generation 4, who were not represented in the production data because they were not born or were too young to participate.
Participants by generation and gender
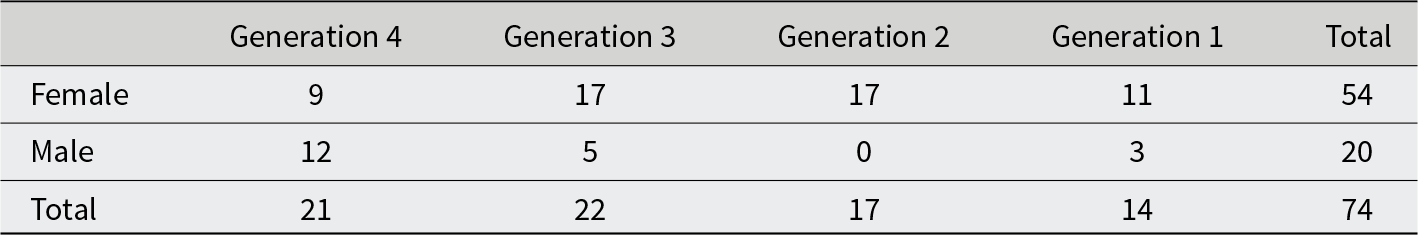
The researchers who conducted the experiment are both women (Algy and Meakins), which resulted in the paucity of adult male participants due to cultural taboos involving the interaction between adult men and women of the same age.
Controls—single variant words
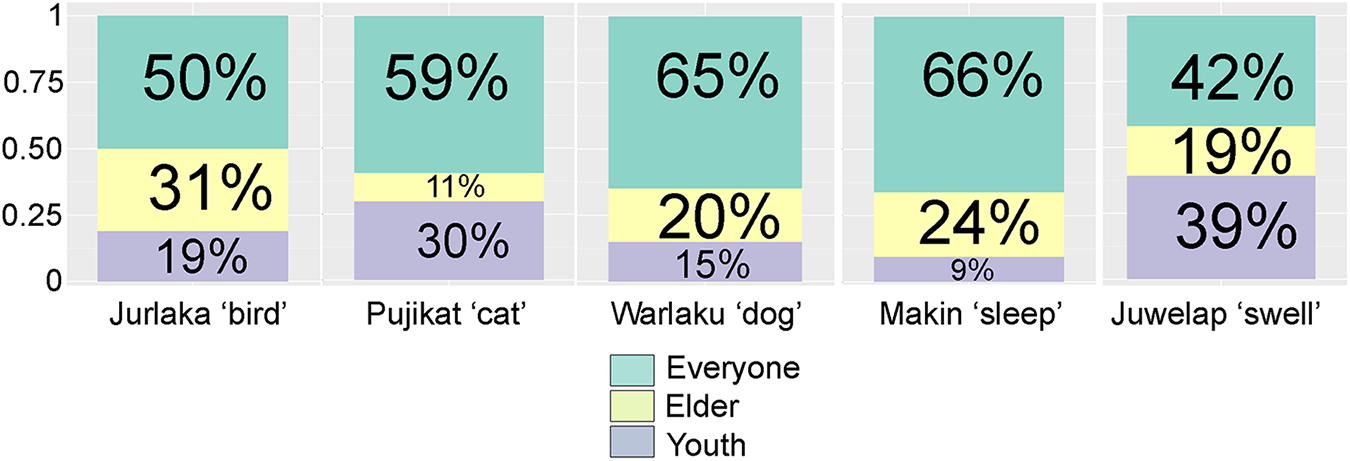
As introduced earlier, five words under analysis are singletons that do not have synonymic pairs or trios. Three are from Gurindji (jurlaka ‘bird,’ makin ‘sleep,’ warlaku ‘dog’); two are from Kriol (pujikat ‘cat,’ juwelap ‘swell’). These words are used without variation by all of the Gurindji community, regardless of generation. We use these five words as an experimental control to independently establish a baseline in responses for word variants that do not have a bias in usage with respect to the social categories “elder” or “youth.” Participants’ answers to these five words are summarized in Figure 2.
Percentage of participant responses (y-axis) to five control words which have no variants (x-axis).

Figure 2 confirms both the functionality of the 3AFC task and the importance of setting a baseline for responses. Everyone in the community uses these words, and the most frequent response was that these words are used by “everyone;” however, there is a lot of scatter around the “everyone” response in Figure 2. In particular, Figure 2 shows that people tend to associate Kriol variants with “youth” and Gurindji variants with “elder” even for these control words that do not have a generational usage bias in the community. This suggests the presence of an overall participant bias in the community, which becomes important to our analysis.
Analysis
To identify word variants that are significantly salient, we compare them against a baseline using the control words so that we can identify word variants that have a greater association with “elder” or “youth” than would be expected by chance. Use of baseline words, used by everyone in the community, allows us to detect the “signal” of salience (association with a social category) above the “noise” of participant responses (tendency to pick different categories even when there is no difference in usage).
We built a multinomial logistic regression model to test how participants’ answers to each of the 75 word variants differ from the five control words using the mlogit function from the mlogit package (which is appropriate for datasets with more than two levels in the response variable) (Croissant, Reference Croissant2020). The response variable is how often participants answer “elder” or “youth,” with “everyone” set as the reference level because this answer is what we expect for a non-salient word.
We use participants’ answers to the five control words to set up the baseline for two purposes. First, we use all of the answers to the five control words to estimate two intercept parameters, one for “elder” and one for “youth,” in our regression model. These intercept parameters give the log probability of a participant answering “elder” and “youth” for a word variant that is not biased in its generational usage. Then, for each word variant, two additional coefficients are introduced in our regression model, one for “elder” and one for “youth.” Summing the “elder” intercept and the “elder” coefficient gives the log probability of the “elder” answer to the corresponding word variant, and the same for the “youth” intercept and coefficient. Since these coefficients describe how much increase or decrease in the log probability of “elder” and “youth” answers to the word variant, compared to the five control words, the significance and sign of these coefficients indicate a significant positive or negative association of word variants with “elder” or “youth” beyond the baseline. We estimate the coefficient of each of the five control words in order to capture the overall participant bias and use the smallest p-value of these coefficients as the significance level for the coefficient of each of the 75 word variants. This ensures that any statistically significant association between a word variant and a social category is above and beyond any community-level bias toward associating Kriol variants with “youth” and Gurindji variants with “elder.”
To quantify if a participant has a tendency to choose “elder,” “youth,” or “everyone” more often (hereafter referred to as an individual participant’s bias), we also include in our regression model two parameters for each participant, one for giving the response “elder” to a test stimulus and one for giving the response “youth.” These parameters model each participant’s specific bias in answering “elder” and/or “youth,” compared to “everyone.” Similar to the coefficients for a word variant, we need to set one participant as the control to interpret the coefficients for any other participant. Ideally, this control participant should understand the purpose of the 3AFC task so that they will answer only based on the word variant they hear. Because Algy was not involved in the design of the 3AFC task and had no exposure to the task before completing it herself (i.e., the same as any other participant in the task), we use her as the control participant.
This completes our regression model, which is a full model, as it includes specific coefficients for each word variant and each participant. By modeling an individual participant’s bias, we could identify four participants who gave very different answers from the other participants. We run all our analyses with and without these four participants. Results with and without the four participants are qualitatively the same, so here we report the results with the four participants included.
In addition to this full model, we built a model to test the effects of three factors, and their full interactions, on the probability of a participant answering “elder” or “youth” to a given word variant. One factor is a property of word variants (Origin), and two factors are properties of participants (Gender and Age). This model is fit to control words and to the 75 word variants separately.Footnote 4 Origin is a binary variable (Gurindji or Kriol). Gender and Age are participant-specific and Age is a continuous variable. Since Origin and Gender are categorical variables, we set female participants’ responses to Kriol-origin variants as the reference level. Similar to the full model, each of these factors and interactions has two coefficients, one for the response “elder” and one for the response “youth.” For example, a significant negative “youth” coefficient for the age effect in females’ responses to Gurindji-origin variants suggests that older participants tend to answer “youth” less often when given a Gurindji-origin word variant, compared to a Kriol-origin word variant. The model is fit to the five control words and the 75 word variants separately for two different purposes. First, the model is fit to the control words to test if participants of the same gender or age have similar response bias to word variants with Gurindji or Kriol origin, regardless of salience. Second, the model is fit to the 75 word variants in order to test if participants of different ages or genders associate a Gurindji-origin word variant with “elder” or “youth” speech differently from a Kriol-origin word variant. We are interested in this because particular word variants are associated with the social category of generation among Gurindji speakers in the production data, and so we want to explore whether these associations might influence participant response patterns in the perception data.
Sali-RAT—measuring salience
The regression model gives the log probabilities of “elder” and “youth” answers to a word variant relative to “everyone.” Using the softmax function, we calculate the final probabilities of a participant answering “elder” and “youth” relative to “everybody” for each word variant. This is similar to calculating the ratio between the number of participants answering “elder” (and “youth”) and the number of participants answering “everybody” except that the estimated log probabilities are less influenced by an individual participant’s bias. Similarly, we calculate these two final probabilities using intercepts only, which gives the baseline for the final probabilities of “elder” and “youth” answers relative to “everybody” relative to the control words that are not biased in usage across generations. To give a relative measure of salience (Sali-RAT score), we divide the final probability for “elder” of a word variant by its baseline, calculated from the control words. Similarly, we divide the final probability for “youth” of a word variant by its baseline. This gives us two Sali-RAT scores for each word variant under analysis: how much greater, relative to the baseline, is the probability of a participant answering “elder” to the word variant, and how much greater than the baseline is the probability of a participant answering “youth” to the word variant. For example, in Figure 3, a Sali-RAT score of 1.0 along the “elder” axis and 2.0 along the “youth” axis means the word variant has equal probability to the control word of eliciting the response “elder” but it has double the probability of eliciting the response “youth” as the control words, indicating that the word variant has a positive association with younger generations. However, if the Sali-RAT score is 0.1 along the “youth” axis, then the probability of a “youth” answer for the word variant is only one-tenth of that for the control words, so the word variant has a negative association with younger generations. Similarly, a Sali-RAT score of 0.1 along the “elder” axis and 2 along the “youth” axis suggests that the word variant may have a negative association with older generations while having a positive association with younger generations.
Results from our full multinomial logistic regression model based on response patterns (axes plotted on log scale). A Sali-RAT score that is greater than 1.0 along the “elder” axis suggests stronger positive association between the word variant and “elder,” while a Sali-RAT score that is lower than 1.0 along the “elder” axis suggests stronger negative association between the word variant and “elder.” The same applies to the “youth” axis and association between the word variant and “youth.” Confidence intervals along the “elder” or “youth” axis are plotted as a bar for a word variant if the “elder” or “youth” coefficient of the word variant is more significant than any of the five control words. In general, variants with significant coefficients have confidence intervals that do not go across 1.0 along the axis corresponding to the coefficient. The only situation where significance may not agree with confidence intervals is when participants answer “everyone” significantly more or less often than the control words. In this situation, confidence intervals not going across 1.0 allow us to identify salient word variants.

However, there is a question of how many times higher than the baseline in the probability of an “elder” or “youth” answer is high enough for a word variant to be considered as positively associated with older or younger generations, and how low is low enough to be considered negatively associated with “elder” or “youth.” This requires a significance test on the coefficients in the full model for each word variant. In Table 3, we summarize our test for these different kinds of salience. To avoid arbitrarily setting a significance level, we include the five control words in the model as if they were word variants under test and use the lowest p-value of their coefficients as the significance level, which is about 0.001. In this way, we can identify word variants that have significantly more “elder” or “youth” answers than any of the control words, relative to “everybody.” This is particularly important here, because there is a bias across participants in response to the control words, that is, people identify Gurindji variants with “elder” and Kriol variants with “youth” even when they are used by “everybody.” Setting the significance level by control words allows us to control for this overall participant bias so that significance in salience for a word variant cannot be explained by the overall participant bias alone.
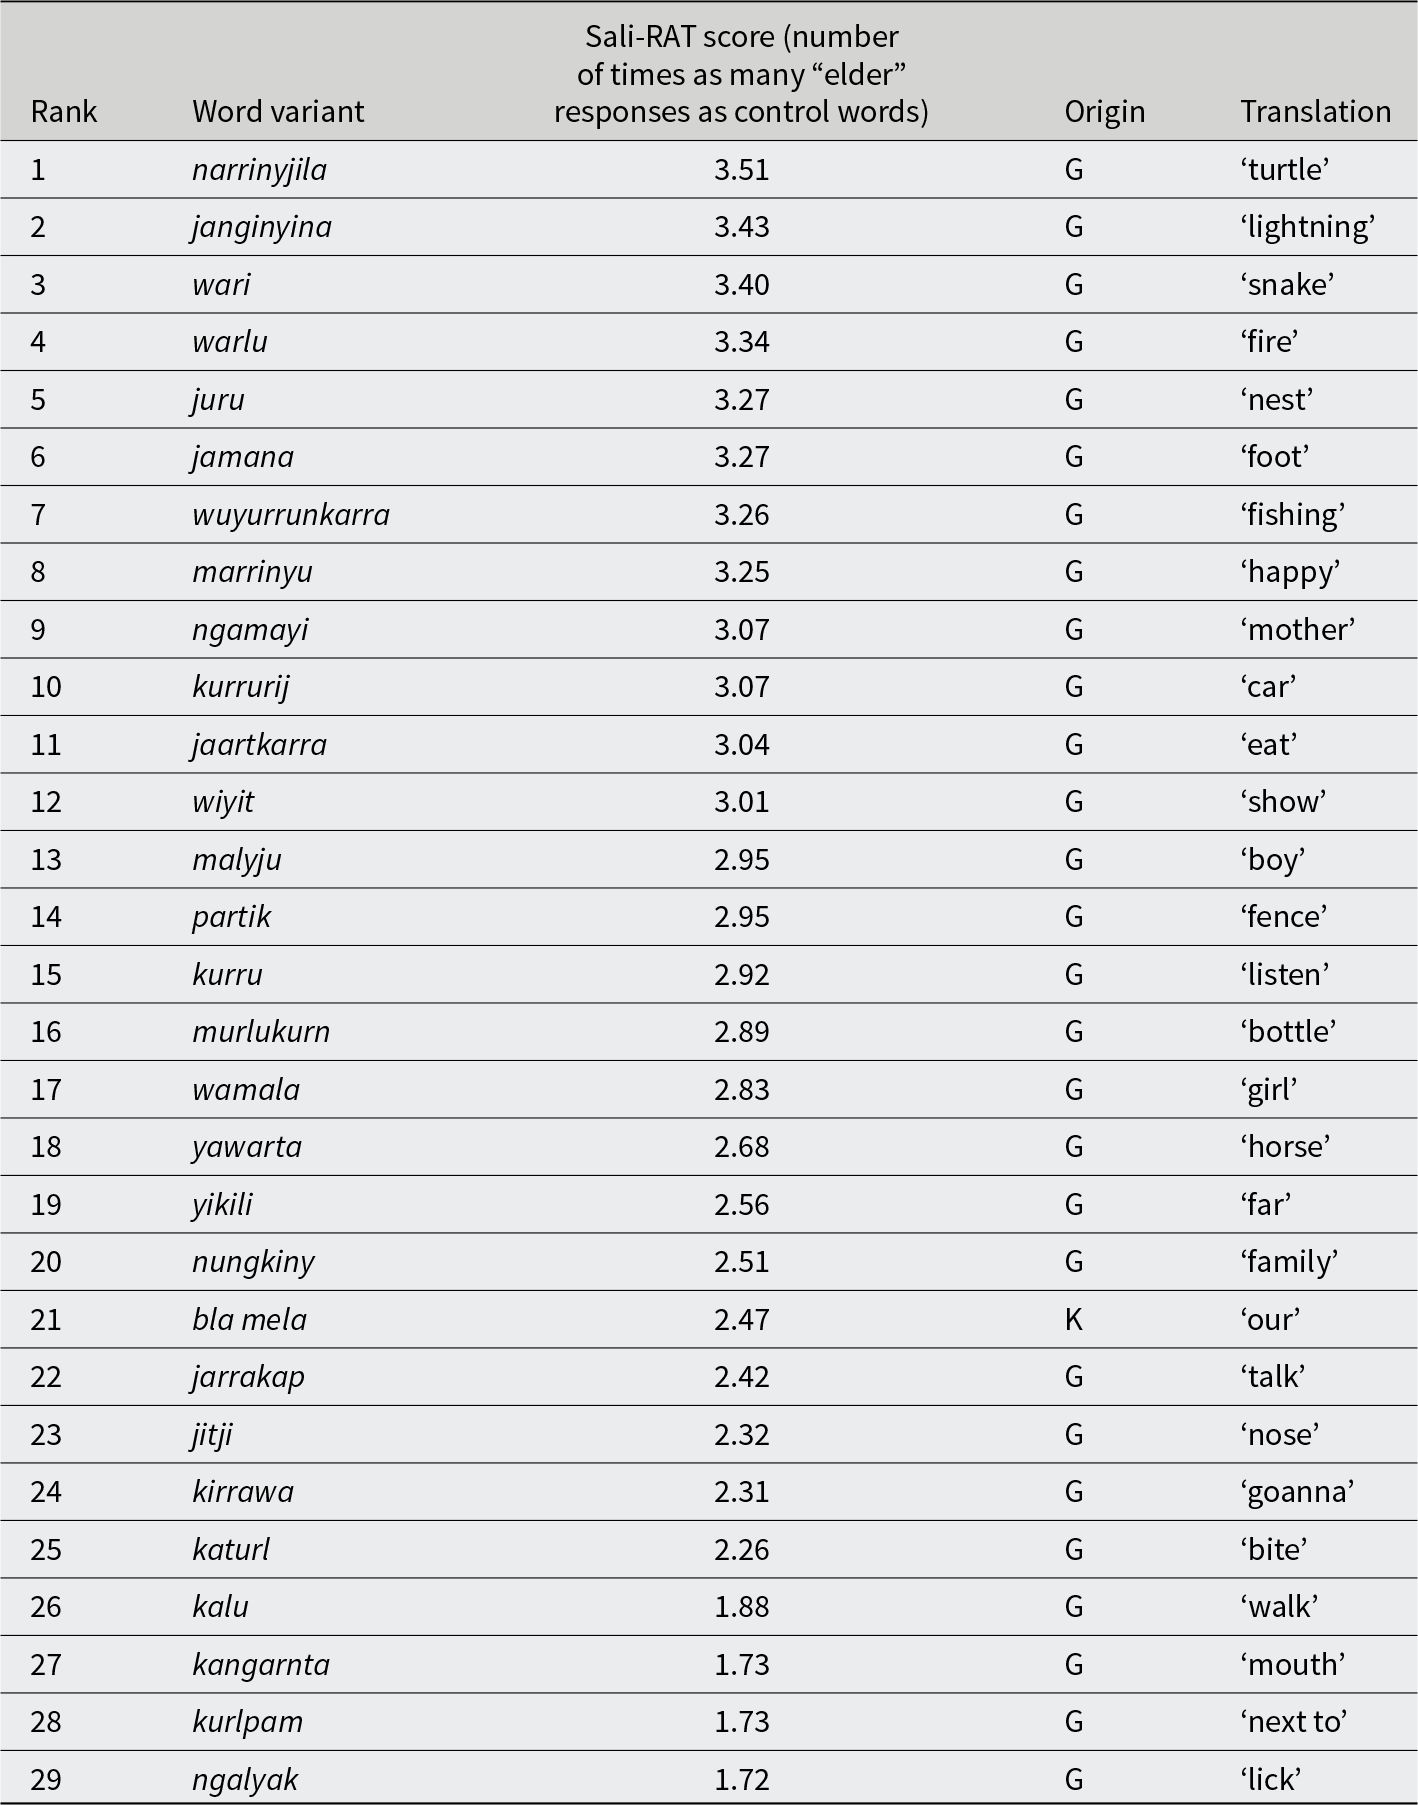
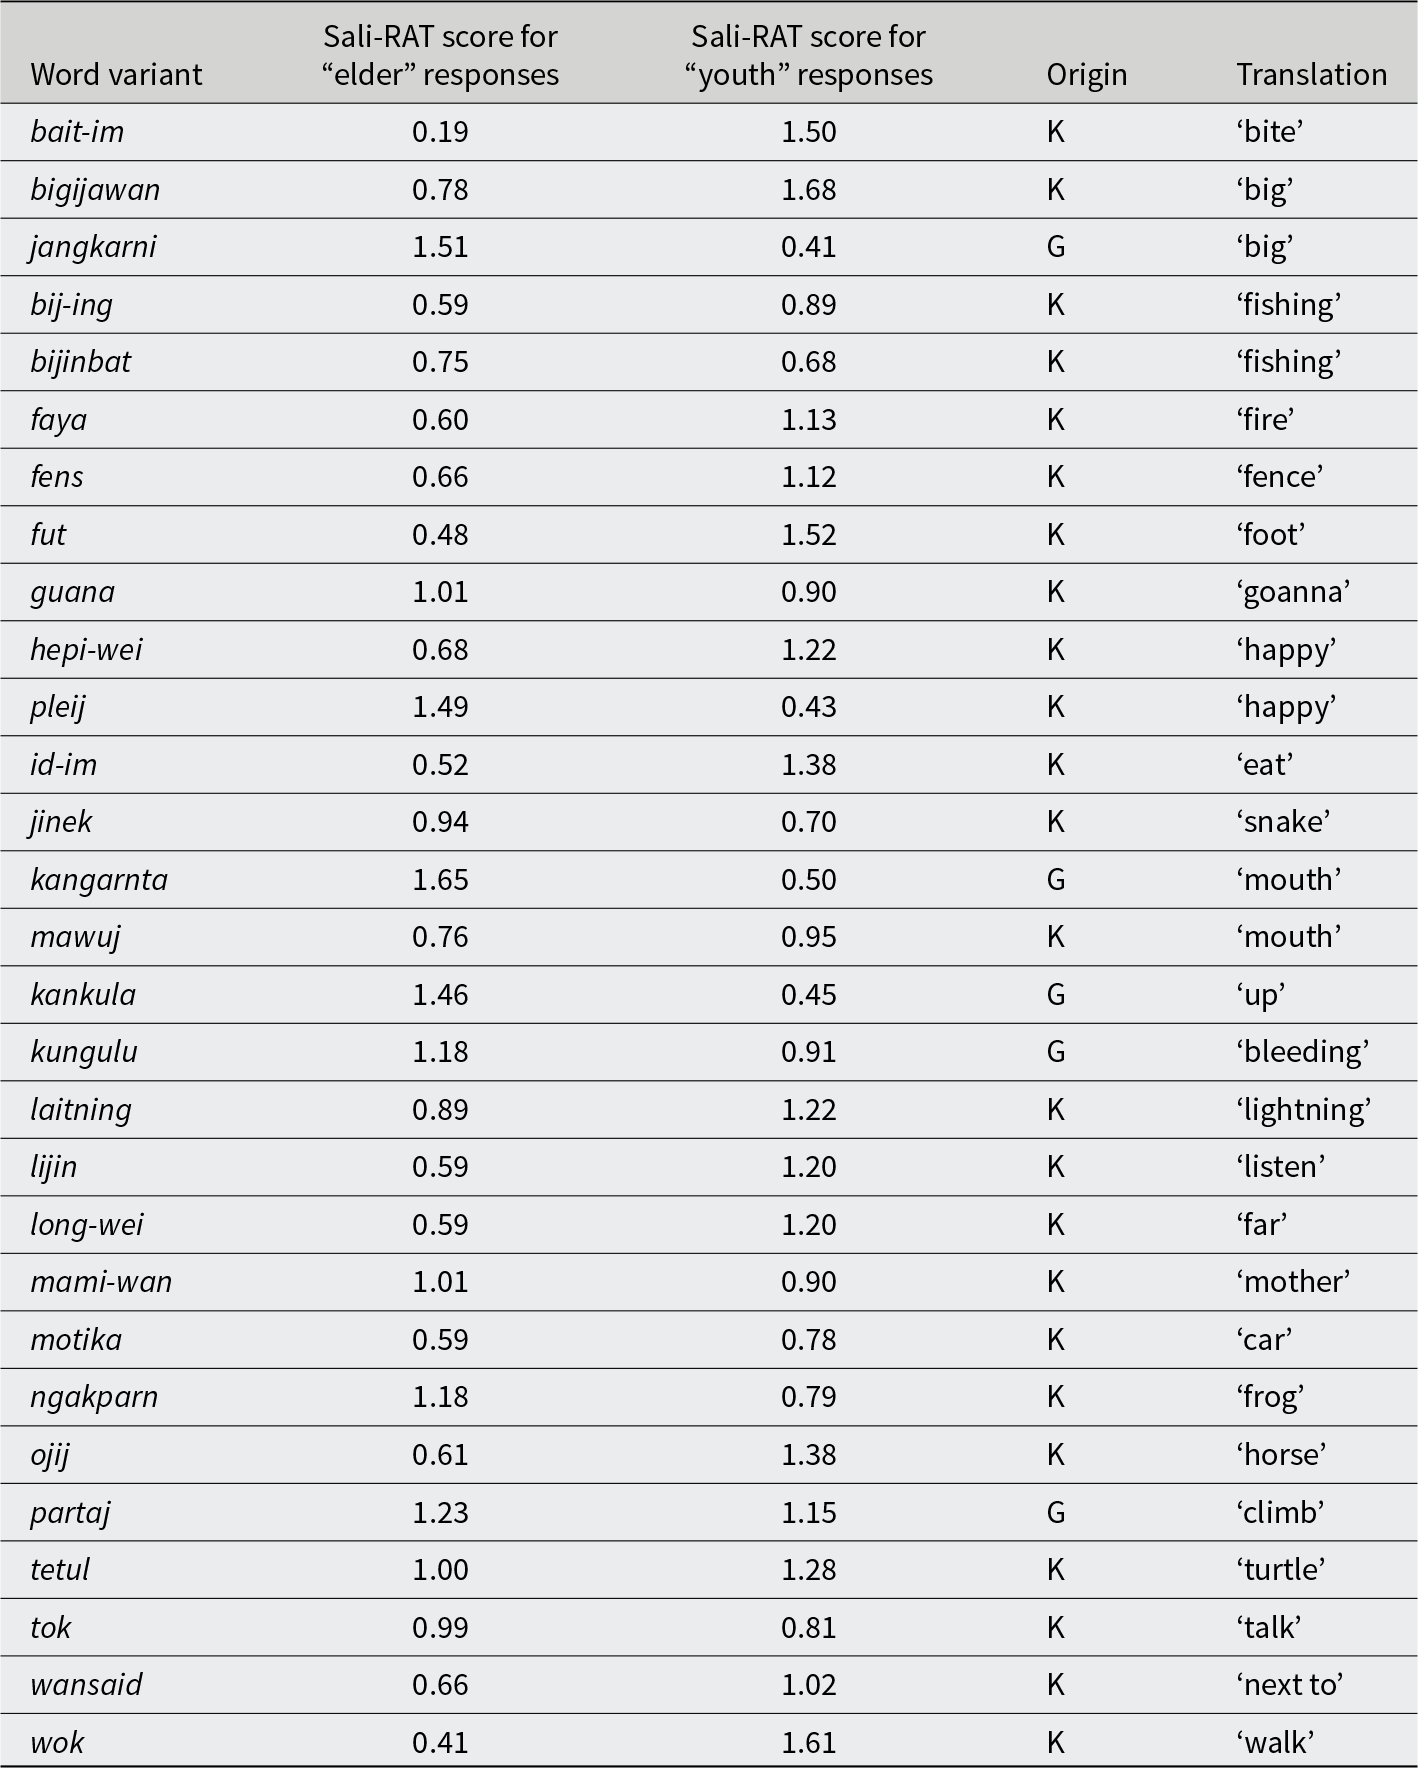
Word variants that are significantly positively associated with “elder.” The position of a word variant along the “elder” axis in Figure 4 represents the number of times as many “elder” responses as received by control words, calculated from our full regression model as the ratio between the estimated probability of “elder” answers for the word variant and the estimated probability of “elder” answers for the control words (Sali-RAT score). Significance level is determined by the minimum p-values of coefficients for the five control words in the full model
Results
This section is divided into three subsections. We first examine the degree of salience of individual word variants. Then, we summarize the results and rank word variants by their degree of salience. Finally, we investigate differences in response patterns based on the gender and age of the participant.
Salience results
Results from our full model, which includes specific coefficients for each word variant and each participant, are presented in Figure 3. This figure represents our interpretation of salience, with the x-axis representing “elder” (i.e., the probability of a participant answering “elder” to the word variant compared with the baseline), and the y-axis representing “youth” (i.e., the probability of a participant answering “youth” to the word variant compared with the baseline). A Sali-RAT score that is greater than 1.0 along the “elder” axis suggests a positive association between the word variant and “elder,” while a Sali-RAT score that is lower than 1.0 along the “elder” axis suggests a negative association between the word variant and “elder” (Table 3). Similarly, a Sali-RAT score that is greater than 1.0 along the “youth” axis suggests a positive association between the word variant and “youth,” while a Sali-RAT score that is lower than 1.0 along the “youth” axis suggests a negative association between the word variant and “youth” (Table 3). Confidence intervals along the “elder” or “youth” axis are plotted as a bar for a word variant if the “elder” or “youth” coefficient of the word variant is significant (i.e., word variants without bars have nonsignificant coefficients). Two word variants, jouim and wamala (both located in the top right-hand corner of Fig. 3), have significant positive coefficients for both “elder” and “youth,” suggesting that they received significantly fewer “everyone” answers than the control words. In other words, more participants respond that the word variants are not used by everyone in the community compared to the control words. However, confidence intervals for jouim along both the “elder” and “youth” axis contain 1.0, suggesting that a similar number of participants respond “elder” and “youth.” Therefore, there is no community consensus on whether jouim is associated with the older or younger generation. In contrast, the confidence interval for wamala along the “elder” axis does not contain 1.0, suggesting that more participants respond “elder” than “youth,” so wamala is associated with the older generation.
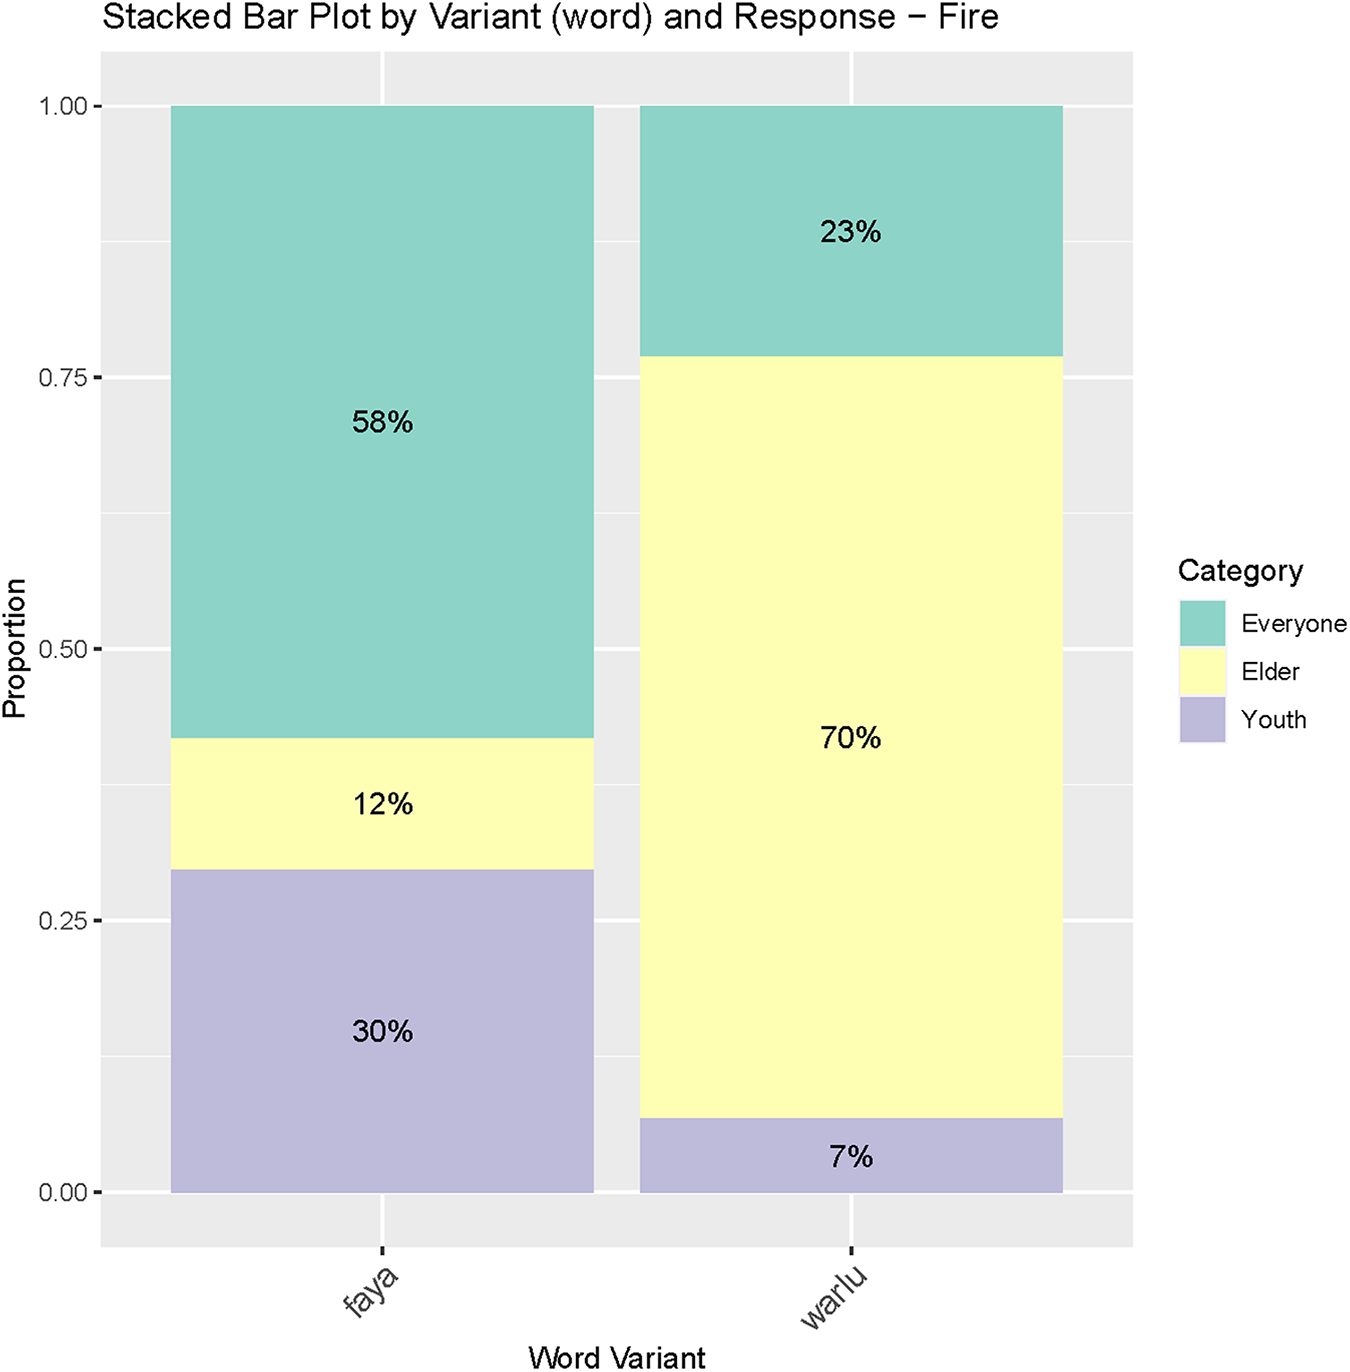
Each word variant has multiple Sali-RAT scores in relation to its association with “youth” or “elder.” For instance, warlu ‘fire’ (Gurindji-origin), positioned at 3.34 on the “elder” axis in Figure 3, showed a significantly higher number of responses positively associated with “elder” compared to the “elder” responses to Gurindji-origin control words (compare Fig. 2 and Fig. 4). In contrast, faya ‘fire’ (Kriol-origin), positioned at 0.56 on the “elder” axis in Figure 3, did not show significantly fewer “elder” responses compared to the Kriol-origin control words (compare Fig. 2 and Fig. 4). These results could be interpreted as a positive association between warlu and “elder,” but no significant negative association between faya and “elder” (positioned at 0.56 on the “elder” axis). Conversely, both warlu and faya showed nonsignificant results for “youth” (Sali-RAT scores of 0.37 and 1.17, respectively, on the “youth” axis in Fig. 3). This implies that, overall, participants did not strongly positively or negatively associate either warlu or faya as being specifically associated with “youth.” Thus, warlu is the only variant of ‘fire’ with demonstrated social salience because it is positively associated with “elder,” whereas faya does not have significant social salience because it shows no significant association with either “youth” or “elder.”
Participant responses to faya ‘fire’ (left) and warlu ‘fire’ (right).

Salience rankings
Since all word variants are compared to the same control words in Figure 3, Sali-RAT scores are gradient and relative, ranking word variants according to their degree of positive, negative, or no association with “youth” or “elder.” For instance, comparing katurl ‘bite’ (2.26 on the “elder” axis) with jamana ‘foot’ (3.26), jamana could be considered more salient than katurl, because jamana received 3.26 times as many “elder” responses as the control words, while katurl received 2.26 times as many “elder” responses as the control words. Numerical positions of all the word variants are provided in Appendix B. Table 3 gives Sali-RAT rankings for word variants that are positively associated with “elder.” No word variants have a significant negative association with “elder,” meaning there are no variants that are perceived as not being used by elders. Table 4 gives the Sali-RAT rankings for word variants positively associated with “youth” and negatively associated with “youth.” Table 5 lists word variants that are not significantly associated with “elder” or “youth” and are therefore not considered significantly salient; 24 of these words are from Kriol, and five are from Gurindji.
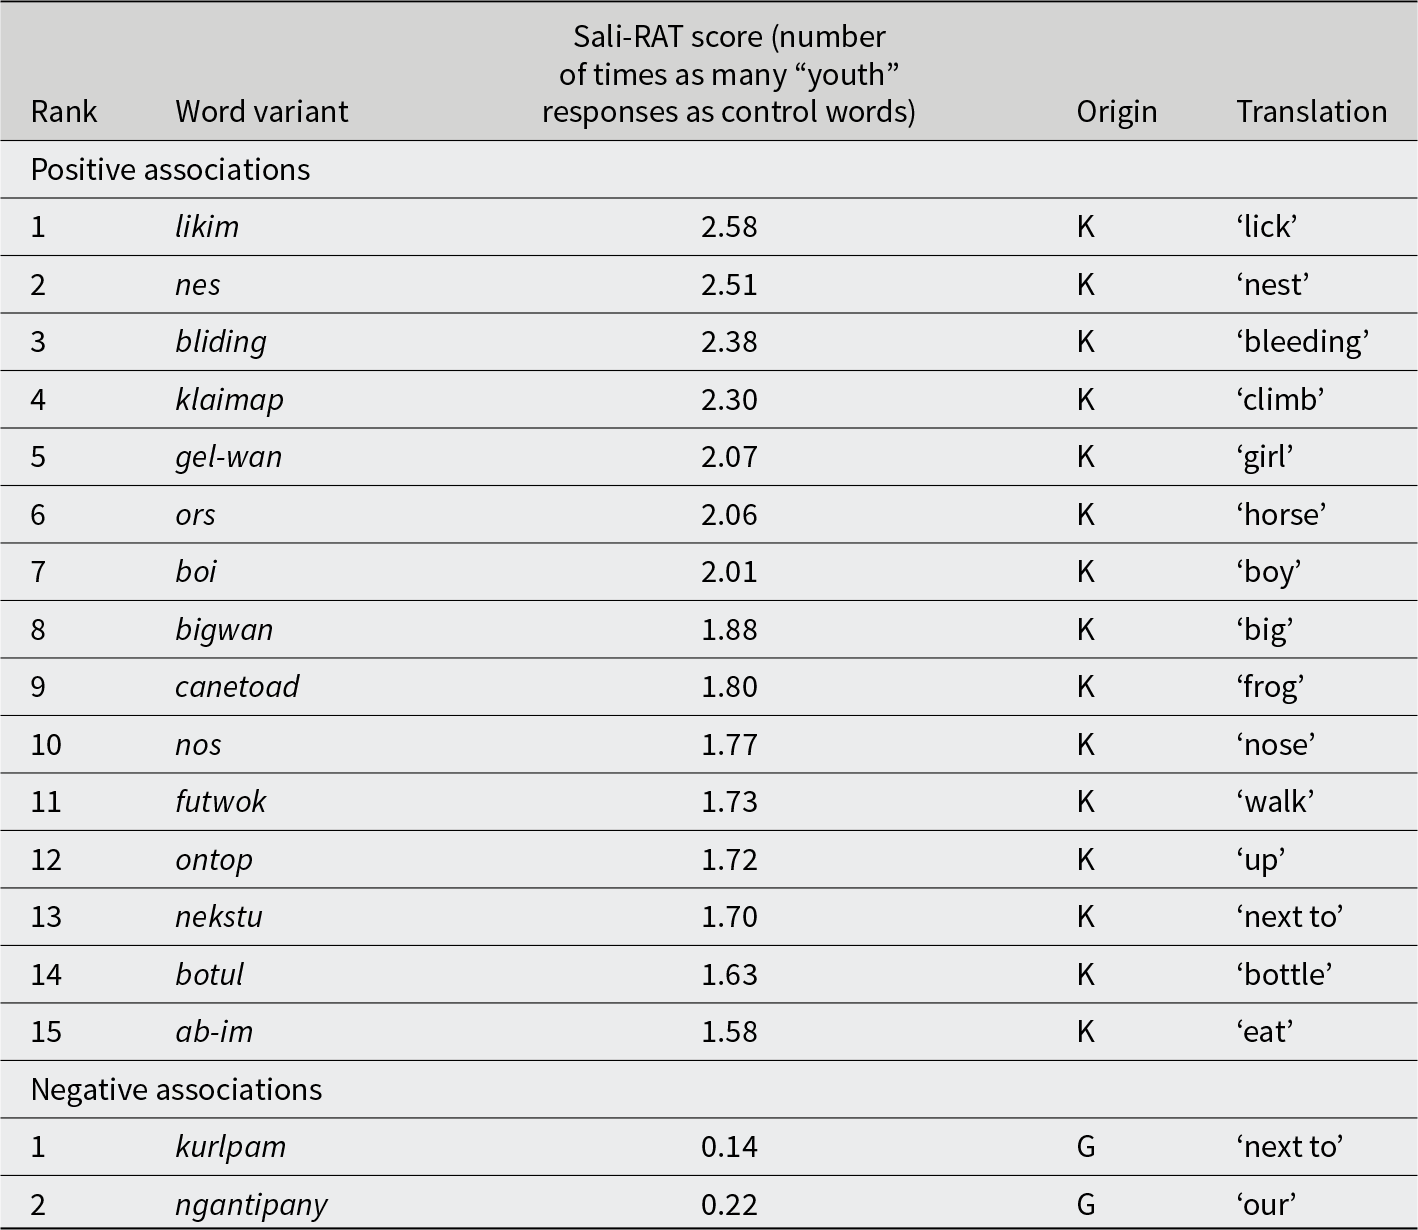
Word variants that have significant positive and negative associations with the “youth.” Number of times as many “youth” responses as control words is the position of a word variant along the “youth” axis in Figure 4, calculated from our full regression model as the ratio between the estimated probability of “youth” answers for the word variant and the estimated probability of “youth” answers for the control words (Sali-RAT score). Significance level is determined by the minimum p-values of coefficients for the five control words in the full model
Word variants which show no significant association with “youth” or “elder.” ‘Mouth’ is the only variable of which no word variants are salient
Participant responses
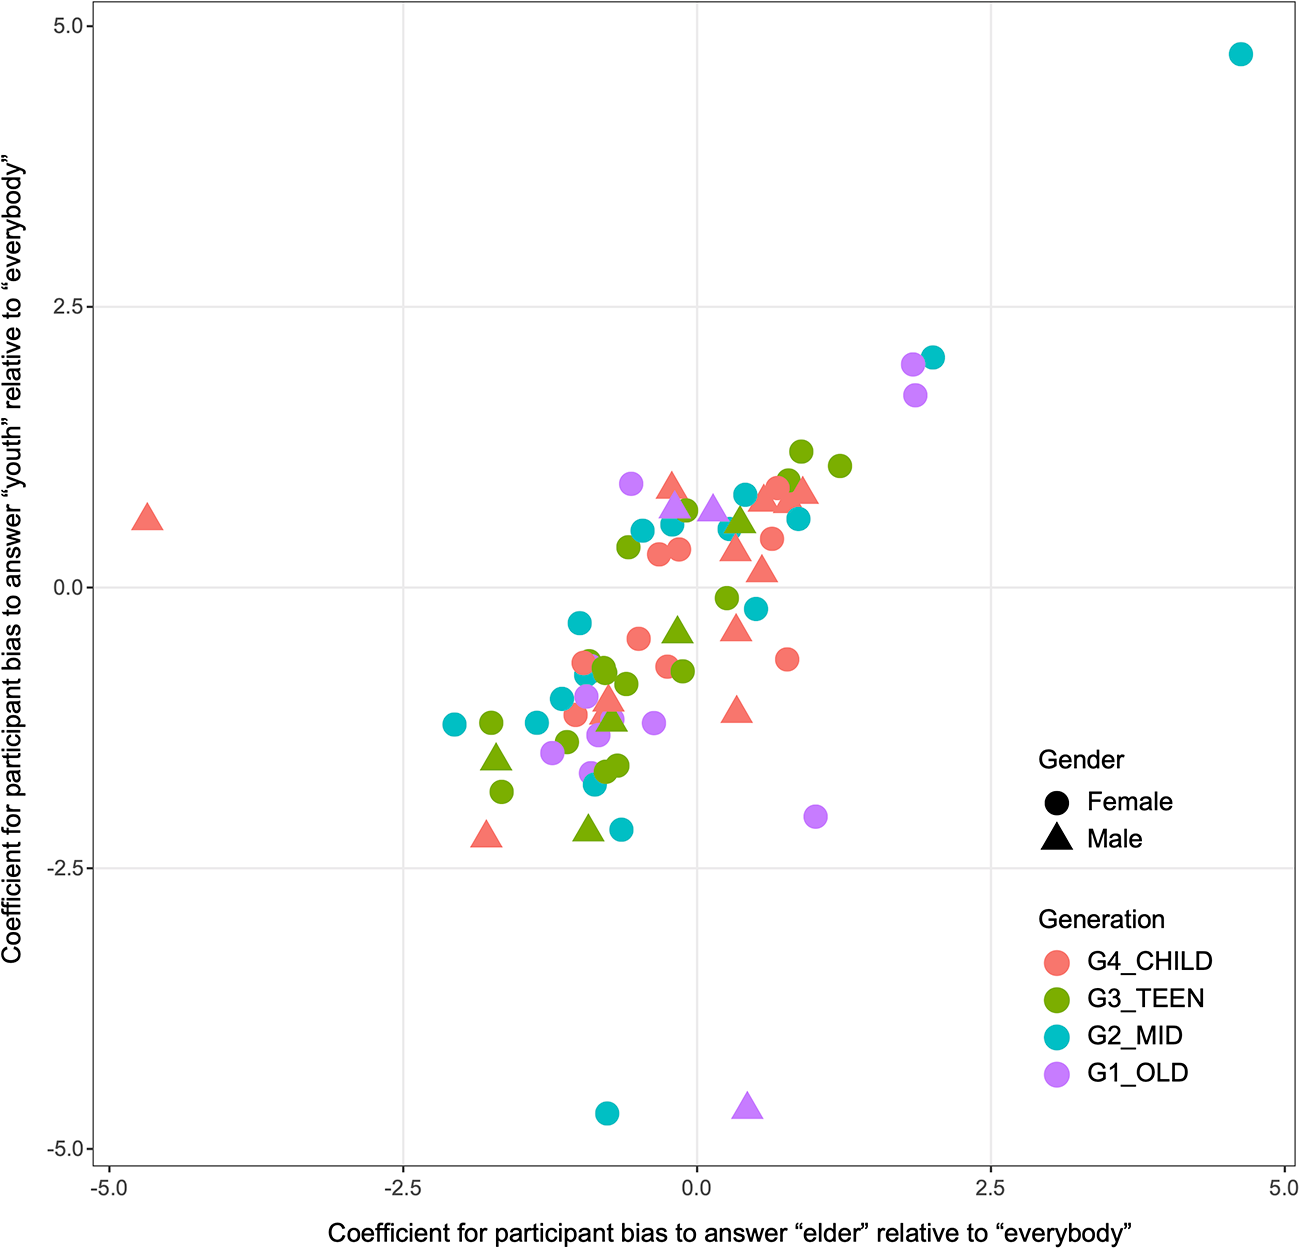
Figure 3 shows a high degree of community agreement on the social salience of word variants. In addition to this community agreement, we want to know how participants respond differently from each other. We first present individual participant bias in Figure 5, which shows how a participant’s response deviates from the overall response across participants, averaged over the 75 word variants. In Figure 5, participants located closer to each other have more similar responses. Figure 5 shows no clear clustering of participants with the same gender or in the same generation, suggesting that the variation in individual participant bias in responses is idiosyncratic. To validate this result, we fit a model to the control words to test the effects of gender and age on a participant’s response. Results show no significant effect of gender or generation on a participant’s response to control words of either Gurindji or Kriol origin (Table 6). Note that in Table 6, the reference level has a significant negative coefficient for “elder,” suggesting that female participants answer “elder” significantly less often than “everyone” for Kriol-origin words. In contrast, they do not answer “youth” more or less often than “everyone.” Taken together, these results confirm the overall participant bias and suggest that this participant bias is mainly due to the negative association between Kriol words (pujikat and juwelap in Fig. 2) and “elder.”
Participant bias estimated from our full multinomial logistic regression model. A larger positive value along the “elder” axis suggests that the participant answers “elder” more often than the control participant, while a negative value along the “elder” axis suggests the participant answers “elder” less often than the control participant. The same applies to the “youth” axis and how often participants answer “youth.” Participants who are located closer to each other have more similar responses. Both axes are square-rooted while keeping the sign in order to spread out data points. Four participants were located far from the center cluster, so we reran all our analyses, removing these four participants.

Effects of gender and age on a participant’s response to the control words. Since gender and origin are categorical variables, an age effect (including intercept and slope) is estimated for each of four partitions of the data: female responses to Kriol words; female responses to Gurindji words; male responses to Kriol words; and male responses to Gurindji words. None of the four slopes is significantly different from zero, suggesting no age effect on participants’ responses to control words. These slopes also do not depend on gender or word origin. The intercepts use female responses to Kriol-origin words as the reference level, so, for example, the intercept for female responses to Gurindji-origin words shows how female responses to Gurindji-origin words differ from those to Kriol-origin words. None of the three intercepts is significantly different from zero, suggesting no gender effect on participants’ responses to control words that have either Gurindji or Kriol origin

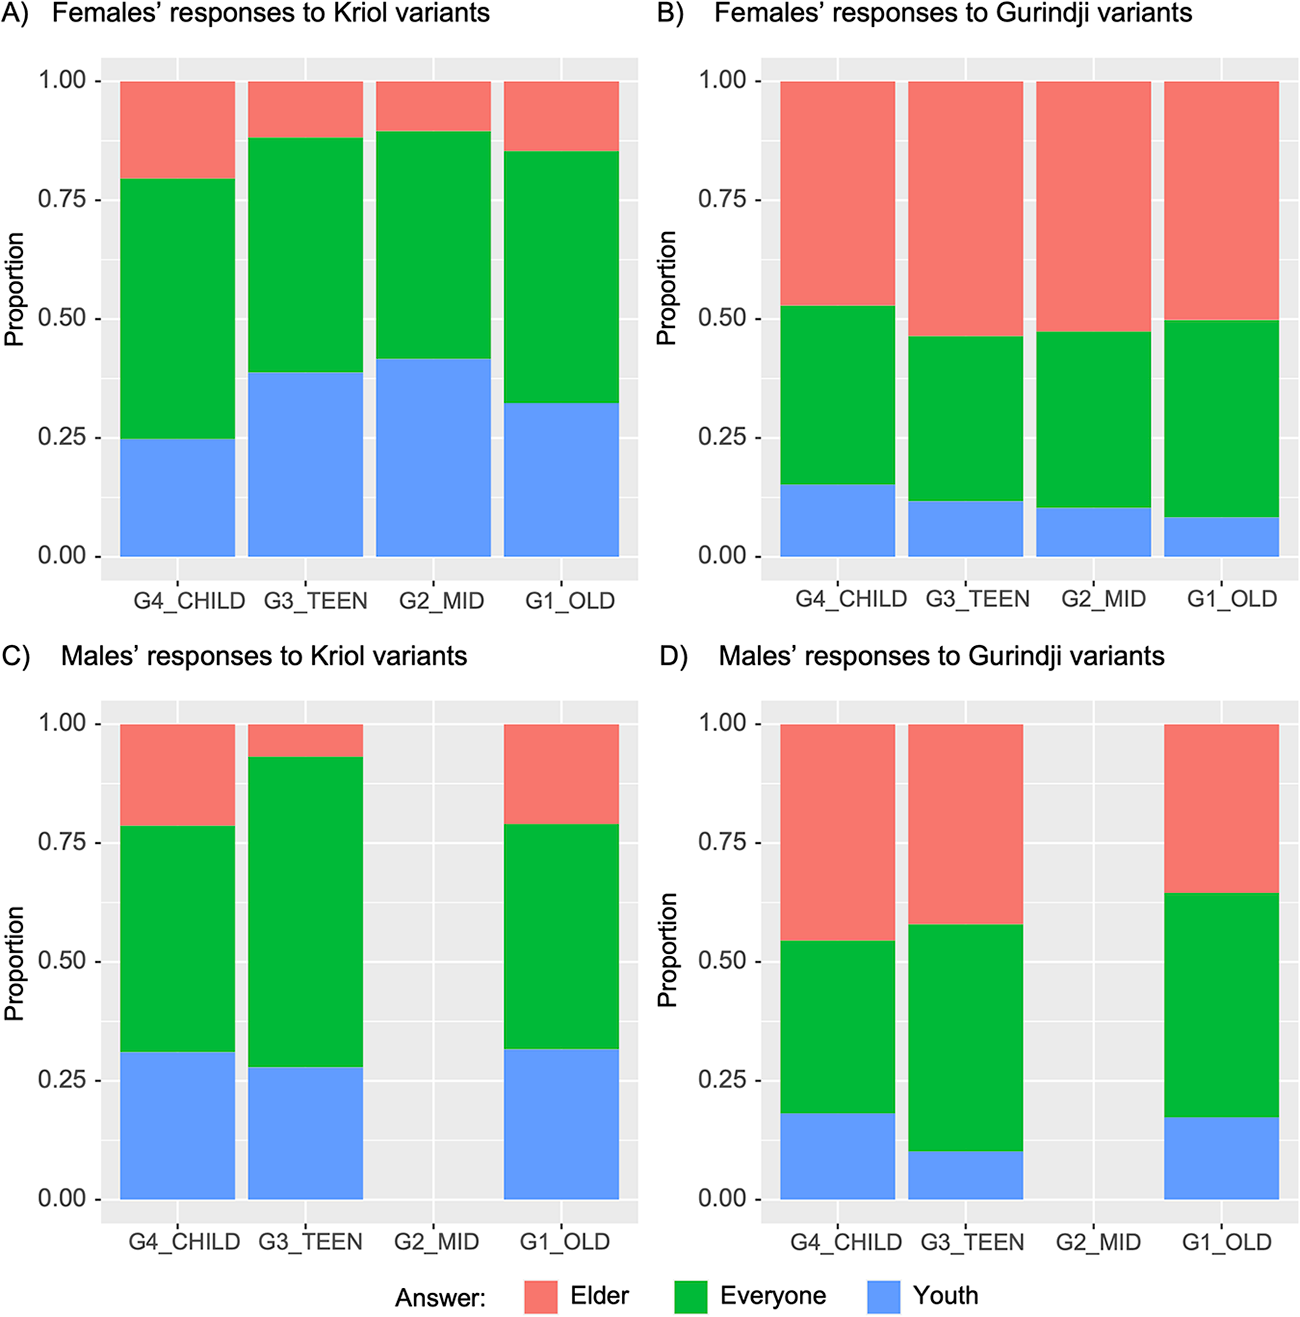
We then test the effects of gender and age on a participant’s response to 75 word variants, considering the variant origin. We do this because, in the production data, there are associations of particular groups of variants with the social category of generation, and we want to explore whether these associations might influence participants’ responses in the data generated by the 3AFC task. For instance, a Generation 1 participant might associate a Kriol-origin word with “youth” while a Generation 4 participant could associate the same word with “elder.” Figure 6 summarizes the responses of female and male participants of different generations to Kriol-origin and Gurindji-origin words. Both female and male participants show the general trend of choosing “elder” for Gurindji-origin words and choosing “youth” for Kriol-origin words (Fig. 6). This confirms the high degree of community agreement on the social salience of word variants (Fig. 3). Older females seem to choose “youth” more often and “elder” less often for Kriol-origin words (Fig. 6A), while choosing “youth” less often for Gurindji-origin words (Fig. 6B). In contrast, there is no clear age effect on male participants’ response to Kriol-origin words (Fig. 6C), and older males seem to choose “elder” less often for Gurindji-origin words (Fig. 6D). Note that the majority of male participants are from Generation 4, so the absence of an age effect on male participants is likely due to low sample size in older generations.
Proportion of “elder,” “everyone,” and “youth” answers by participants of specific generations (G1 = Generation 1, G2 = Generation 2, G3 = Generation 3, G4 = Generation 4) and genders to word variants with Kriol origin and Gurindji origin.

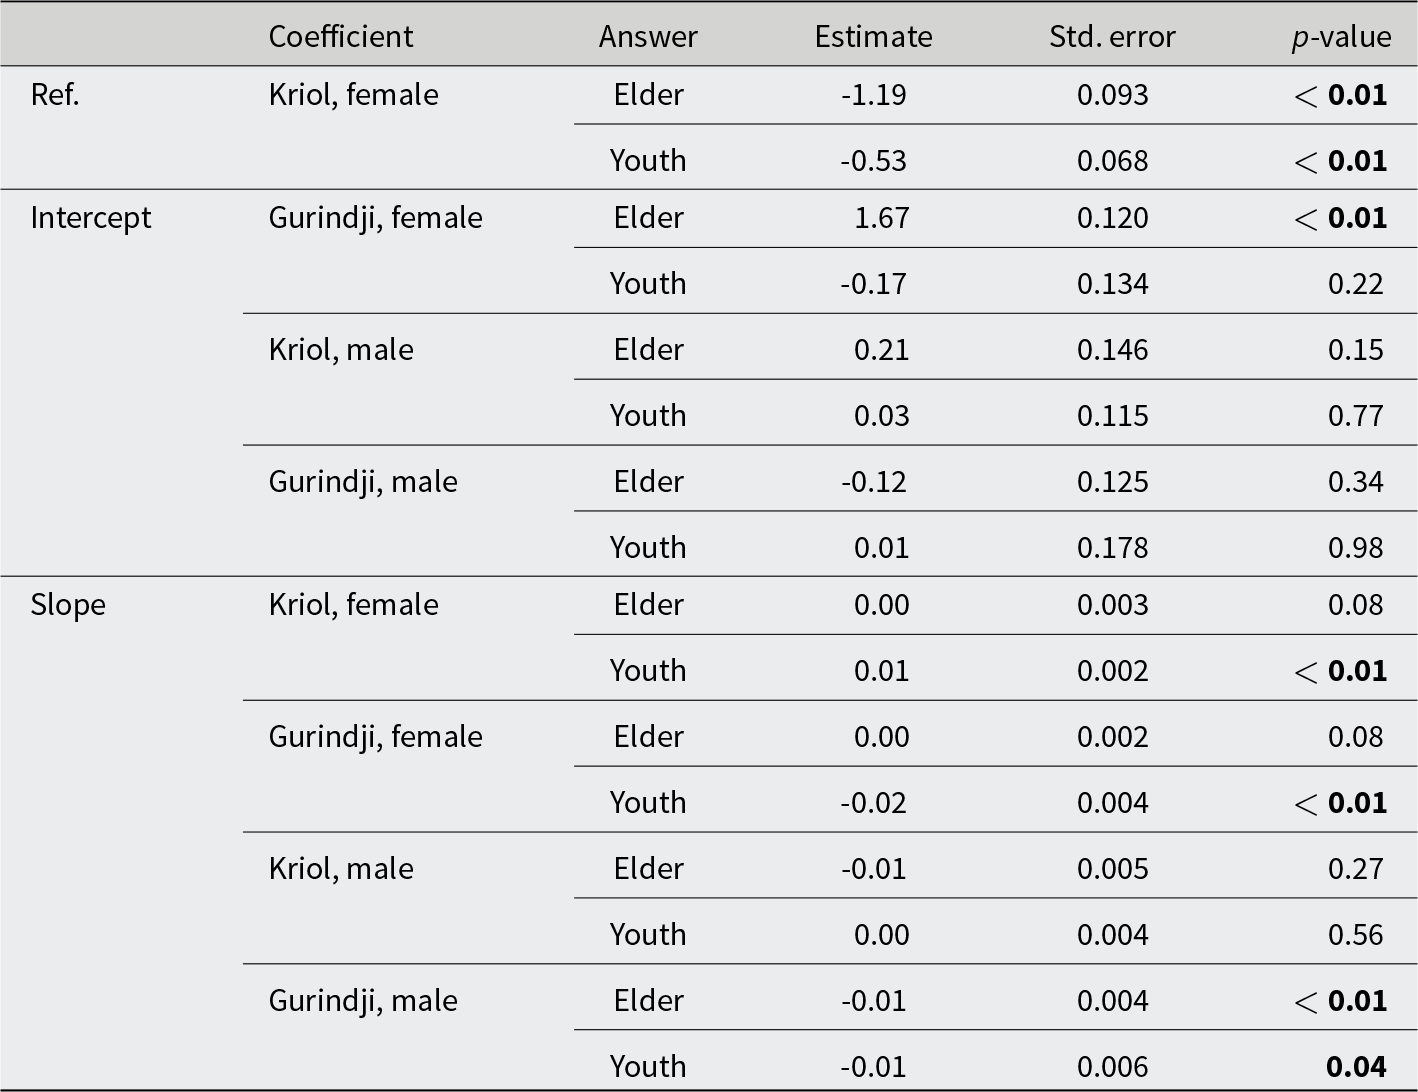
To test if any gender effect and generational effect on a participant’s response is statistically significant, we fit the model to the 75 word variants using age instead of generation because we have too few male participants in Generation 1 and 2. Since gender and origin are categorical variables, female responses to Kriol-origin variants are used as the reference level in the model. Results confirm that females choose “youth” more often for Kriol-origin words, because the coefficient for “elder” in females’ responses to Kriol variants (Kriol, female in Table 7) is significantly lower than that for “youth.” Male responses to Kriol variants do not differ from female responses (nonsignificant intercepts for Kriol, male). Similarly, females choose “elder” more often for Gurindji-origin words than for Kriol-origin words (significantly positive intercept for Gurindji, female, elder in Table 7), but this trend in males is not significant. Results in Table 7 also confirm that older females choose “youth” more often for Kriol-origin words (significantly positive slope for Kriol, female, youth in Table 7), but they do not choose “elder” less often for Kriol-origin words (nonsignificant slope for Kriol, female, elder in Table 7). In contrast, there is no significant age effect on male participants’ response to Kriol words, which is at least partly due to the low number of male participants in older generations. To Gurindji words, both older males and females choose “youth” less often (significantly negative slope for Gurindji, male, youth in Table 7), but they also choose “elder” less often (significantly negative slope for Gurindji, male, elder in 7; significantly negative slope for Gurindji, female, elder in Appendix F), suggesting that older participants choose “everyone” more often for Gurindji-origin words. In summary, females are more likely to assign word variants to generation categories than males by associating “elder” with Gurindji-origin words, and older females are more likely to associate “youth” with Kriol-origin words.
Effects of gender and age on a participant’s response to the 75 word variants. Similar to Table 6, an age effect (including intercept and slope) is estimated for each of four partitions of the data: female responses to Kriol-origin words; female responses to Gurindji-origin words; male responses to Kriol-origin words; and male responses to Gurindji-origin words. Since gender and origin are categorical variables, the intercepts use female responses to Kriol-origin variants as the reference level, so, for example, the intercept for Gurindji, female compares female responses to Gurindji-origin variants to females’ responses to Kriol-origin variants
Discussion
In this paper, we have developed a new experimental and analytical approach, Sali-CAT, to rank word variants according to their degree of association with a social category, which gives us Sali-RAT scores. We demonstrate the approach by testing the relative association of multiple variables with different generations of speakers in the Gurindji speech community. These Sali-RAT scores are measured against a baseline that is based on an analysis of five control words that do not vary in their use in the community. This meant that we were able to identify word variants that have a greater association with “elder” or “youth” than would be expected by chance.
The analysis of the control words allows us to recognize community-wide bias in responses. We found that there is a tendency in the community to associate Gurindji words with “elder” and Kriol words with “youth.” This is not surprising given the ongoing language shift in this community but it is important to recognize and account for this bias in the analysis. We used this overall participant bias to provide our multinomial regression model with a baseline against which to measure participant responses to the 75 word variants. Results of the analysis capture both general trends and specific patterns of word variant usage. Consistent with the general tendency to associate Kriol variants with youth, 15 out of 44 Kriol variants are considered to index younger generations. However, not all Kriol variants are socially salient, with 24 Kriol word variants not having a significant association with generational categories. Similarly, 28 out of 36 Gurindji variants are significantly associated with the “elder” category and not “youth,” but five Gurindji variants do not have a significant association with either “elder” or “youth.” Proportionally, more Gurindji word variants are considered by Gurindji people to index different generations than Kriol variants. This potentially suggests that Gurindji people have a higher level of agreement about who uses Gurindji word variants than who uses Kriol variants.
The results from the analysis of the individual participants based on their age and gender suggest that there is a high degree of community consensus across generations and genders on the perception of who uses what words (regardless of the origin of words in Gurindji or Kriol). In this respect, the social salience of linguistic variation can be thought of as a collective property of the speech community. Note that we did find that females associated “elder” with Gurindji-origin words more often than males. This result cannot be fully explained by the lower number of male participants than female participants, because we also found that males and females do not differ in how they respond to Kriol-origin words. This aligns with our previous findings that women maintain Gurindji variants across generations in language production more than men, which we speculated indicated a higher awareness of the social meaning of variants by women (Meakins et al., Reference Meakins, Bromham and Hua2024).
Sali-CAT is generally applicable to other languages and communities. The first step is to select words (or grammatical or phonetic features) that have variants showing biased usage among speakers categorized by the social factor under test. Ideally, the biased usage would be tested from a production dataset against a set of controls that do not vary in production. The second step is the 3AFC task, which can be generalized to social groups with more than two categories but balanced with the length of the task. The third step is the multinomial regression model. The key to the analysis is to use appropriate control variants. In the absence of these, researchers can simply use zero as the intercepts in the model and use the conventional significance level of 0.05.
Conclusion
In this paper, we present Sali-CAT, a new approach to ranking word variants of multiple lexical variables according to their association with social categories (Sali-RAT score). The approach includes a customized experimental paradigm (3AFC) and statistical analysis. The use of the 3AFC paradigm addresses some of the issues with previous studies, which forced participants to choose one of two social category statements in response to a linguistic stimulus. In our experiment, participants could simply say that “everyone” in the speech community uses the word variant, rather than being forced to choose a social category. Our analysis of the data from the perception task also allowed us to identify word variants that are salient with respect to the social category of generation. Each word variant potentially had more than one Sali-RAT score; that is, it may have a significant positive or negative association or no significant association with “elder” or “youth.” Our Sali-RAT scores are also relative, that is, some word variants are more salient than others based on our measures. An innovation of Sali-CAT was to compare the way that participants associated these word variants with the social categories against a baseline by using the control words, which do not vary in their use in the community and therefore do not distinguish generations in practice. This means that we were able to identify word variants that have a greater association with social categories than would be expected by chance.
The ability to provide a relative measure of multiple variants in a speech community is an important first step in modeling the potential role of social salience as a driver of language evolution. On the basis of our modeling of salience, we might expect that word variants with Sali-RAT scores that show a positive or negative association with generation (i.e., “elder” or “youth”) could show differences in the rate of uptake or loss compared with the word variants that show a non-association with generation. These former variants can be likened to Labov’s (Reference Labov1972) “stereotypes” or “markers.” On the other hand, we may expect the non-salient variants to show random patterns of change if they are not deliberately used or avoided. This hypothesis remains the subject of further study.
Supplementary material
The supplementary material for this article can be found at https://doi.org/10.1017/S0954394526100659.


 Open access