


Changes in lifestyle, including improvement in dietary patterns and increased physical activity, may reduce the risk of chronic diseases(1, 2). To that end, public health strategies aimed at improving consumer food choices have emerged(2). In an effort to help consumers make healthy food-buying decisions, nutrition labelling on food packaging is an informational tool(Reference Cowburn and Stockley3). In recent years, new forms of food labelling on the front of packages have been designed, providing simplified information on nutritional content at a glance(Reference Cowburn and Stockley3, Reference Grunert and Wills4), along with back-of-pack detailed energy and nutrient content information.
Various front-of-pack (FOP) nutrition labelling formats now exist. Previous studies showed that they differed in terms of market penetration, consumer acceptability and understanding, factors which might affect their use(Reference Grunert and Wills4–Reference Storcksdieck Genannt, Celemin and Larranaga9). Some works showed that, compared with simple formats like health logos, detailed FOP labels (i.e. ‘multiple traffic lights’ and ‘Guideline Daily Amounts’) appear to be well accepted by consumers, probably due to more rapid and easier identification and use, along with more complete information(Reference Grunert and Wills4, 10, 11). In addition, previous studies suggested that most FOP labels are clearly understood(Reference Borgmeier and Westenhoefer5–Reference Grunert and Wills7).
In general, perception of nutrition labels found on the side, back or front of packages (labels with graphics, with minimal numerical information or with descriptive adjectives, calories labels, health logos, ‘traffic lights’, etc.) varies considerably across population subgroups. Acceptability, understanding and ensuing use are lower among men, the elderly, persons having low socio-economic status and individuals with little nutritional knowledge(Reference Cowburn and Stockley3, Reference Grunert and Wills7, Reference Campos, Doxey and Hammond12–Reference Grunert, Fernandez-Celemin and Wills14). Other features, including price, brand name, claims and ingredient lists, compete with nutrition labels for the attention of the consumer during purchasing; perception of nutrition labels thus differs according to consumer attention to such features(Reference Cowburn and Stockley3, Reference Campos, Doxey and Hammond12, Reference Grunert, Fernandez-Celemin and Wills14–Reference Vyth, Steenhuis and Vlot16).
Since FOP labels are potential tools for improving the dietary patterns of populations, elucidation of the most equitable, effective and eye-catching formats for increasing awareness of healthier choices, particularly in groups at high risk of nutrition-related disease, could potentially change dietary behaviour. Previous studies compared acceptability and understanding of FOP label formats according to sociodemographic and economic factors, nutrition knowledge and interest in other characteristics of packaged foods(Reference Grunert and Wills4–Reference Grunert and Wills7, Reference Campos, Doxey and Hammond12, Reference Grunert, Fernandez-Celemin and Wills14, Reference Gorton, Ni and Chen17). However, they did not take into account dimensions constituting acceptability so as to more accurately define profiles of label perception and elucidate their relationship with individual characteristics.
The first aim of our study, using a multidimensional approach, was to identify patterns of perception of FOP labels by clustering individuals into groups according to understanding and aspects of acceptability, such as liking, attitude, attractiveness and perceived cognitive workload. Next, we determined whether sociodemographic and economic factors, nutrition information and knowledge or attention paid to other features on packages were associated with cluster membership.
Methods
Study population
We used data from the NutriNet-Santé Study, a large web-based prospective observational cohort launched in France in May 2009 with a scheduled follow-up of 10 years (recruitment planned over a 5-year period). It was implemented in a general population targeting Internet-using adult volunteers aged 18 years or more. The study was designed to investigate the relationship between nutrition and health (incidence of IHD, cancers, overall mortality, etc.), as well as determinants of dietary behaviour and nutritional status. Design, methods and rationale have been described elsewhere(Reference Hercberg, Castetbon and Czernichow18). Eligible participants were recruited by different means. At launch, a vast multimedia campaign (television, radio, national and regional newspapers, posters and Internet) called for volunteers and provided details on the study's specific website (http://www.etude-nutrinet-sante.fr). Then, multimedia campaigns were repeated every 6 months. Further information is being maintained on a large number of websites (national institutions, city councils, private firms, web organisations). A billboard advertising campaign is regularly updated via professional channels (doctors, pharmacists, dentists, business partners, municipalities, etc.). In order to be included in the cohort, participants have to fill in an initial set of questionnaires assessing dietary intake, physical activity, anthropometry, lifestyle and socio-economic conditions along with health status. Each month, they are invited to fill in complementary questionnaires related to determinants of food behaviour and nutritional and health status. The study is conducted according to guidelines laid down in the Declaration of Helsinki, and all procedures have been approved by the International Review Board of the French Institute for Health and Medical Research (IRB Inserm no. 0000388FWA00005831) and the Commission Nationale Informatique et Libertés (CNIL no. 908450 and no. 909216). Electronic informed consent is obtained from all participants.
We assessed participant acceptability and comprehension of FOP labels using an original web-based questionnaire administered to participants recruited into the cohort from September 2009 to January 2010. Sociodemographic and economic data were collected at enrolment in the study.
Front-of-pack labels
Description of formats
Five FOP labels were tested (Fig. 1). They differed in that they entailed either a simple positive opinion of the product or else positive, neutral and negative opinions of the product as a whole or of individual nutrients. The logo of the French Nutrition and Health Programme (Programme National Nutrition Santé; PNNS) is used for certification of actions and documents of any kind aimed at improving nutrition in the population(Reference Hercberg, Chat-Yung and Chauliac19). Certification is based on agreement with objectives, principles and benchmarks of the PNNS. At present, it cannot be used on manufactured products, but it has been widely used for media campaigns launched by the French Ministry of Health and therefore is fairly well identified by the general population. The ‘Green Tick’ (Fig. 1), specifically designed for the present study, was inspired by the ‘Green Keyhole’ symbol developed by the Swedish Food Administration(Reference Larsson, Lissner and Wilhelmsen20) and by the ‘Pick the Tick’ programme introduced by the Heart Foundation in Australia and New Zealand(Reference Young and Swinburn21). The PNNS logo and the Green Tick simply indicate overall positive evaluation of a product. Finally, the ‘simple traffic lights’ logo (STL) developed in the UK by the Food Standards Agency proposes either a positive, neutral or negative judgement, plus advice relating to consumption frequency(10).
(color online) Front-of-pack nutrition labels studied (translation of French words: Programme National Nutrition Santé = National Nutrition and Health Programme; Respecte les recommandations des nutritionnistes = follows nutritionist recommendations; Manger à volonté = eat plenty; Manger avec moderation = eat in moderation; Manger occasionnellement = eat sparingly; Sucre ajouté = added sugar; Matières grasses saturées = saturated fat; Sel = salt)
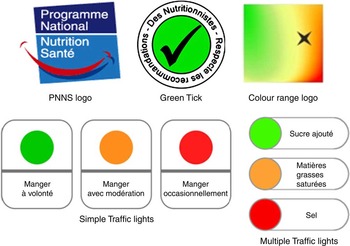
The ‘colour range’ or CR logo was specifically designed for our study (Fig. 1). It enables positioning of a product on a colour scale of nutritional quality for food products, and thus does not provide a categorical judgement. It uses a continuous colour gradation from green to red, passing through orange and yellow intermediate areas. Contrary to the other labels giving a combined evaluation of the nutrient content of packaged foods, the ‘multiple traffic lights’ (MTL) symbol, also recommended by the UK Food Standards Agency(10), provides a separate evaluation of several nutrients (positive, neutral or negative) and, in our case, of added sugar, saturated fat and sodium.
Achievement criteria for labels
We used the ‘SAIN LIM’ system based on the nutrient content of each soup product so that use of the tested logos could be defined. The SAIN LIM system, previously published(Reference Darmon, Vieux and Maillot22), classifies foods into four nutrient categories according to five ‘positive’ nutrients (protein, fibre, vitamin C, calcium and iron) and three ‘unfavourable’ nutrients (sodium, added sugar and saturated fatty acids). This is why we used added sugars (instead of total sugars) and saturated fatty acids (instead of total fat) in the MTL label. Vegetable soup had the most favourable nutrient profile (class 1)(Reference Darmon, Vieux and Maillot22), while boiled chicken soup characterised foods with the least favourable nutrient profile (class 4). Chinese soup corresponded to class 3, intermediate in terms of nutritional quality (high nutrient density, high content of unfavourable nutrients). Class 2 (low nutrient density and low content of unfavourable nutrients) was not represented in our study.
In our introduction to the questionnaire, we briefly explained the various label formats tested and their theoretical use. Participants were informed that the PNNS logo and Green Tick were given only to the healthiest foods (class 1), and the PNNS logo was certified by the French Ministry of Health, whereas the Green Tick meant that nutritionists guaranteed the nutritional quality of foods. STL consisted of a green (‘eat plenty’), amber (‘eat in moderation’) or red (‘eat sparingly’) symbol depending on how food was classified: classes 1, 3 and 4, respectively. The CR logo was one hypothetical representation of the SAIN LIM system for classifying and positioning foods on two continuous scales for ‘positive’ and ‘unfavourable’ nutrient contents(Reference Darmon, Vieux and Maillot22). Axes were not drawn so as to avoid weighing down the design. We explained to participants that the closer the star came to the green area (upper left), the healthier the nutrient profile of the product (class 1). Conversely, the closer the star came to the red area (bottom right), the less healthy the nutrient profile of the product (class 4). An example was given (Fig. 1). For MTL, green, amber and red indicated low, moderate and high contents, respectively, of added sugar, saturated fat and sodium based on thresholds defined by the SAIN LIM system for these unfavourable nutrients(Reference Darmon, Vieux and Maillot22).
Data collection
The web-based questionnaire initially measured self-estimated nutritional knowledge and information level and the frequency of reading nutrition facts found on food products. We also asked participants whether they approved the idea of FOP labels on products in general. The questionnaire next evaluated strengths and weaknesses of each FOP label in comprehension and acceptability. The latter was based on several criteria: attitude, liking, visual attractiveness and perceived cognitive workload needed for interpreting it. These dimensions were inspired by the framework of system acceptability developed by Nielsen and used in information and communication technology(Reference Nielsen23). A within-subjects design was used and all questions concerning acceptability and understanding were repeated for each logo and for each participant. The order of presentation of the label formats was as follows: first, the Green Tick, then STL, the CR logo, the PNNS logo and finally MTL. Participants would not be able to find any logical reason for this order.
Comprehension and acceptability of front-of-pack labels
Objective comprehension. To assess comprehension, participants were asked to evaluate the ‘healthiness’ of each given product. They were shown photographs of the three soup variants described above, unbranded, with no information on nutrition facts. For each label, participants had to determine, among three corresponding photographs, whether five statements were true or false or whether the label did not enable a judgement. Statements were as follows: ‘It is inadvisable to eat boiled chicken soup’ (correct answer: ‘False’), ‘Chinese soup is less salty than boiled chicken soup’ (correct answer: ‘The label does not allow me to answer’, except for the MTL, for which the correct answer was ‘False’), ‘Vegetable soup has a good nutritional profile’ (correct answer: ‘True’), ‘Vegetable soup is the one that contains less salt’ (correct answer: ‘The label does not allow me to answer’, except for the MTL, for which the correct answer was ‘True’) and ‘Only vegetable soup should be eaten’ (correct answer: ‘False’). A comprehension score was calculated and classified into three levels: high (four or five correct answers), medium (three correct answers) and low (two, one or no correct answers).
Attitude. For each FOP label, participants chose the statement best reflecting their attitude toward that label, i.e. their intent to use the label. Rejection was reflected in the sentence ‘I am not influenced by this label’. Participants were considered confused if they chose the statement ‘I no longer know what to choose’. The statement ‘This label is helpful, but I would rather form my own opinion on nutritional facts’ indicated lack of interest. Acceptance was measured by statements such as: ‘I would choose certain food products based on this label’. Finally, ‘I would choose all my food products based on this label’ reflected total acceptance.
Liking. Liking was evaluated by the question ‘Would you like to see this FOP label on food products?’ for each label. Moreover, at the end of the questionnaire, FOP label formats were compared for liking by asking participants to choose their preferred label, the one they least appreciated, the one that most influenced them, the one they wanted to see on the front of packages and the one that best helped them choose healthy products.
Attractiveness. Attractiveness of the label format grouped together measures of perception of the potential qualities of a format. It was evaluated by its perceived contribution to information, ease of identification and reliability. Perceived contribution to information was measured by statements such as ‘This FOP label provides me with the information I need’, ‘This FOP label gives too much information’ or ‘This FOP label does not give enough information’. Ease of identification was evaluated by the statement ‘This FOP label is easy to identify’. Finally, reliability was measured by the statement ‘This FOP label provides reliable information’. These indicators were assessed by individual questions on a 5-point rating scale, from ‘fully agree’ to ‘fully disagree’. They were classified into three categories according to data distribution. At the end of the questionnaire, we asked participants to select the most informative and reliable label.
Perceived cognitive workload. Perceived cognitive workload grouped together a set of measurements of perception of potential format defects. It was assessed by three indicators: complexity of understanding, time span needed for interpreting the logo and discomfort occasioned by the message. The complexity level of understanding was evaluated by the following statements: ‘This FOP label is too complex for understanding’ and ‘This FOP label is easy to understand’. Perceived time span needed for interpretation was measured by the statements ‘This FOP label takes too long to understand’ and ‘This FOP label permits rapid understanding of the information’. Finally, perceived discomfort was measured by the statement ‘This FOP label makes me uncomfortable’. These were measured using 5-point rating scale questions, from ‘fully agree’ to ‘fully disagree’. These three indicators were classified into three categories according to data distribution. At the end of the questionnaire, FOP label formats were compared for perceived cognitive workload. We asked participants to choose, among the five formats, the most complicated label, the one requiring the longest time span for interpretation and the label that made them feel most uncomfortable.
Assessment of nutrition knowledge, information and food purchasing habits
The questionnaire also presented measurements of self-estimated nutrition knowledge, information and food purchasing habits. To evaluate the latter, we measured the frequency of reading nutrition facts on food products. For nutrition knowledge and information levels, participants self-estimated their levels and chose among four statements from ‘I know quite a bit about nutrition’ to ‘I don't know anything about nutrition’ and from ‘I'm very well informed about nutrition’ to ‘I'm poorly informed about nutrition’. Nutritional knowledge and information levels and reading habits were classified into three categories. We also asked participants whether certain food packaging characteristics attracted their attention during purchasing: price, brand, package layout, food preparation instructions, claims, nutrition facts, ingredient list, guarantee of quality labels and geographic origin.
Assessment of sociodemographic and economic characteristics
Sociodemographic and economic factors studied included gender, age, marital status, having at least one child or not, educational level and occupational category.
Statistical analysis
The present analyses focused on participants included in the NutriNet-Santé cohort study who had completed the questionnaire measuring perception of FOP labels and who had no missing sociodemographic or economic data (n 38 763).
Since ‘acceptability’ was comprised of various complementary but overlapping dimensions, overall perception of FOP labels was not captured using traditional multivariate techniques. We used cluster analysis to identify patterns of perception of FOP labels by grouping participants into distinct groups according to acceptability and understanding of FOP label formats(Reference Aldenderfer and Blashfield24). Because of the large amount of data, the two-step cluster analysis procedure was used to identify different label perception clusters based on the fifty-eight variables relating to acceptability and understanding of each FOP label and comparisons between FOP labels(Reference Bittmann and Gelbard25, Reference Everitt, Leese and Landau26). Although there is no universally valid solution for the optimal number of clusters, criteria exist that seem to perform reasonably well. We used the pseudo-F statistic for estimating the appropriate number of clusters(Reference Milligan and Cooper27). The higher the value of this statistic, the greater the separation between groups.
For external validation and the description of perception patterns, characteristics of each cluster were described, comparing variables of acceptability and understanding of responders between clusters. The relationships between cluster membership and sociodemographic and economic characteristics, responses to nutrition knowledge and information and food purchasing habits were examined using χ 2 tests.
Weighting was calculated separately for each gender according to national census data on age, educational diploma, area of residence and whether or not the household included at least one child, using the iterative proportional fitting procedure(28). Two-sided tests and P value <0·05 were used for statistical significance. Data management and statistical analyses were performed using the SAS statistical software package version 9·1 (SAS Institute, Inc.).
Results
Description of perception patterns
Acceptability and understanding of FOP labels by perception clusters are presented in Table 1. Cluster analysis yielded four patterns: (i) the ‘favourable to MTL’ group (63·8 %); (ii) the ‘favourable to Green Tick and PNNS logo’ group (22·4 %); (iii) the ‘favourable to STL’ group (10·1 %); and (iv) the ‘favourable to CR logo’ group (3·7 %). In the overall sample, more than half of the participants declared preferring the MTL label, followed by the Green Tick and the STL (Table 1). Overall, the MTL label more often obtained a positive assessment, but not necessarily the highest degree of understanding. As clusters were constructed from numerous variables, the description of clusters in Table 1 presents only variables best enabling distinction between clusters.
Acceptability and understanding of FOP labels by perception cluster, n 38 763 (NutriNet-Santé study, 2009–2010)

FOP, front-of-pack; MTL, multiple traffic lights; PNNS, French Nutrition and Health Programme; STL, simple traffic lights; CR, colour range.
Cluster 1 (‘favourable to MTL’ group) was shaped by a greater liking for and higher attractiveness of the MTL compared with the other labels. It was also characterised by a greater dislike of and a higher perceived cognitive workload involved in the CR logo. This cluster also showed better understanding of all labels.
Cluster 2 (‘favourable to Green Tick and PNNS logo’ group) was shaped by a greater liking for and higher attractiveness and better understanding of the Green Tick and, secondarily, of the PNNS logo. It was also characterised by a high percentage of individuals who thought that no label should be present on the FOP (21·4 %) and that none of them provided the necessary information (25·0 %).
Cluster 3 (‘favourable to the STL’ group) was shaped by a higher liking for and greater attractiveness of STL, and a higher perceived cognitive workload for the CR logo. Moreover, in this cluster, a higher number of persons better understood the simple logos, i.e. the Green Tick, STL and PNNS logos.
Cluster 4 (‘favourable to CR logo’ group) was shaped by a higher liking for and greater attractiveness of the CR logo and a stronger dislike of the PNNS logo. It was also characterised by a high percentage of individuals who felt that none of the labels tested, including the MTL, required a high cognitive workload. Finally, this cluster included numerous individuals who only poorly understood the MTL, whereas a higher level of understanding was found for the Green Tick and PNNS logos.
Association of perception patterns with sociodemographic and economic factors
Given the large size of our sample, significant differences between clusters were observed for all sociodemographic and economic factors (Table 2).
Sociodemographic and economic profiles of perception clusters, n 38 763 (NutriNet-Santé study, 2009–2010)

MTL, multiple traffic lights; PNNS, French Nutrition and Health Programme; STL, simple traffic lights; CR, colour range.
Compared with the other clusters, the ‘favourable to STL’ group included higher percentages of women and younger persons (<30 years), while more men and more elderly persons (>60 years) were found in the ‘favourable to CR logo’ group. More individuals who had at least one child at home were present in the ‘favourable to MTL’ and ‘favourable to STL’ groups.
Regarding economic factors, the highest percentage of individuals having a low education level (elementary +secondary and high school) was found in the ‘favourable to STL’ group and the ‘favourable to Green Tick and PNNS logo’ group, while the highest percentage of individuals with a high education level (college graduate and advanced degree) was observed in the ‘favourable to MTL’ and ‘favourable to CR logo’ groups. The highest percentages of employees and manual workers were found in the ‘favourable to STL’ group, whereas more self-employed persons, farmers and managerial staff were present in the ‘favourable to CR logo’ group.
Association of perception patterns with nutrition knowledge and information and food purchasing habits
The differences in perceived nutrition information and knowledge levels between clusters were not clear-cut (Table 3). The ‘favourable to STL’ group included the highest proportions of persons with little nutritional knowledge and who only occasionally or never read information, whereas the percentage of individuals with high nutritional knowledge and who systematically read nutritional facts on food packages was higher in the ‘favourable to MTL’ group.
Nutritional information and knowledge, frequency of reading nutrition facts and food purchasing habits according to perception clusters, n 38 763 (NutriNet-Santé study, 2009–2010)

MTL, multiple traffic lights; PNNS, French Nutrition and Health Programme; STL, simple traffic lights; CR, colour range.
Clusters were also shown for characteristics of packages that attracted consumers during purchasing (Table 3). The highest percentages of consumers concerned by price, brand name, packaging look and cooking instructions were observed in the ‘favourable to STL’ group. More individuals who paid attention to the ingredients list and nutritional facts were found in the ‘favourable to MTL’ and ‘favourable to CR logo’ groups. The highest percentage of individuals who cared about nutritional claims was found in the ‘favourable to Green Tick and PNNS logo’ group. The proportion of persons who sought a guarantee of quality label during food purchasing was higher in the ‘favourable to CR logo’ and ‘favourable to Green Tick and PNNS logo’ groups. Individuals who paid attention to the geographic origin of food products were more frequently present in the ‘favourable to CR logo’ group.
Discussion
The originality of our study lies in the comparison of different FOP labels via capture of multidimensional information on acceptability. The advantage of measuring all these acceptability aspects is that they differ, but may overlap; consequently, they are complementary to each other, enabling better understanding of the acceptability mechanisms of label formats. Moreover, our theoretical approach provides useful information complementary to experimental works on FOP label use and its impact on proposed purchasing behaviour(Reference Borgmeier and Westenhoefer5, Reference Kelly, Hughes and Chapman8, Reference Vyth, Steenhuis and Vlot16), by exploring individual factors related to perception of FOP labels. Our study distinguishes four distinct groups: the ‘favourable to MTL’ group, the ‘favourable to Green Tick and PNNS logo’ group, the ‘favourable to STL’ group and the ‘favourable to CR logo’ group.
Our study highlighted the fact that each perception cluster had specific sociodemographic and economic characteristics. The literature has shown that women and young or middle-aged adults are more likely to report understanding and using nutrition labels than men or the elderly(Reference Campos, Doxey and Hammond12). This suggests that groups which preferred the CR, Green Tick and PNNS logos, with a higher percentage of men (only for the CR logo) and the elderly, could be considered target populations for implementation of FOP labels. Moreover, the ‘favourable to STL’ group and the ‘favourable to Green Tick and PNNS logo’ group were composed of less well educated individuals, while lower occupational categories were more frequent in the ‘favourable to STL’ group. Numerous previous studies highlighted the fact that people with low socio-economic status had difficulty in understanding nutrition labels and were less likely to use labels for making food choices(Reference Cowburn and Stockley3, Reference Grunert and Wills4, Reference Campos, Doxey and Hammond12, Reference Gorton, Ni and Chen17). Since socio-economic characteristics are strong determinants of unhealthy dietary patterns and nutrition-related diseases(Reference Giskes, Avendano and Brug29), implementation of simple formats such as the STL, Green Tick or PNNS logos, more easily accepted by persons in low socio-economic categories, would appear to be the strategy best adapted to improving the diet of these populations.
In the theoretical framework presented by Grunert and Wills, other determinants of label perception, such as interest in and knowledge of nutrition, are correlates of sociodemographic and economic factors(Reference Grunert and Wills4). The weakest nutrition knowledge and the lowest frequency of reading nutritional facts on packages were observed for the group which favoured the STL label, whereas the ‘favourable to MTL’ group had better knowledge and a higher frequency of reading package information compared with the other clusters. Our results were consistent with previous studies showing that individuals with poor nutrition knowledge and who never read nutritional information had more difficulty understanding detailed FOP labels, but more easily understood simple logos(Reference Grunert and Wills4, Reference Feunekes, Gortemaker and Willems6). Since nutrition knowledge and reading habits have been associated with dietary quality and healthy food choices during purchasing(Reference Beydoun, Powell and Wang30–Reference Satia, Galanko and Neuhouser32), simple FOP labels giving an overall evaluation of a product could be more useful for helping consumers with no basic nutrition knowledge to make an informed choice.
It should be borne in mind that real-life consumers suffer from an overload of information, among which FOP labels are only a part. The importance of package attributes noted by consumers may affect use of nutritional labels because of their competitive effect on food-buying decisions(Reference Drichoutis, Lazaridis and Nayga15). Not surprisingly, the group which favoured the more detailed format, i.e. the MTL label, were most interested in aspects of packages offering comprehensive information on the nutritional composition of foods (nutrition facts and ingredients list). Those characteristics also attracted the group which preferred the CR logo. The ‘favourable to Green Tick and PNNS logo’ group seemed particularly interested in signs of certified approval, including claims and guarantees of quality. Although this group was composed of a high percentage of individuals who thought no label should be present on the front of packages, they might attach importance to simple FOP labels such as the Green Tick and PNNS logo if the latter were officially endorsed, as tested in our study. Finally, the group which preferred the STL label was less attentive to nutritional information on packages, but was more attracted by price and marketing characteristics (brand and packaging appeal). Previous works showed that interest in price was negatively correlated with self-reported label use(Reference Grunert and Wills4, Reference Drichoutis, Lazaridis and Nayga15). Many consumers use trusted brands as a shortcut to perceived quality and product integrity(Reference Garret33). Since price, brand name and visual impact of a package compete with FOP labels for consumer attention, STL could be the most suitable FOP label for rapid easy identification in populations less strongly aware of nutritional issues in their purchasing choices.
Participants were volunteers in a nutritional cohort study and may have shown greater interest in nutritional issues and healthy lifestyle than the general population; thus, results relating to nutrition knowledge were probably biased. Caution is therefore needed when interpreting and generalising results. However, findings relating to frequency of reading nutritional facts on food packages and self-estimated nutrition information level in a general population showed that percentages were equivalent to those in our study due to weighting(Reference Escalon, Bossard and Beck34). Moreover, although the study population was relatively homogeneous in terms of health and nutritional considerations, distinct patterns of acceptability and understanding of FOP labels were nevertheless observed. Another limitation was that self-reported data in our virtual study might not be an accurate reflection of actual label use in real-life settings. For instance, measures of understanding in our study probably do not accurately duplicate real-life purchasing situations that involve time pressure and distracting factors forming part of marketing strategies(Reference Vyth, Steenhuis and Vlot16, Reference Rayner, Boaz and Higginson35, Reference Sacks, Rayner and Swinburn36). However, use of web-based self-administered tools introduces a distance between the investigator and the participant, thereby encouraging the latter to provide evaluations with the benefit of hindsight(Reference Joinson37). Besides, it would be useful to carry out equivalent surveys using other types of manufactured products, since soups are generally perceived as healthy foods, which may have partially biased participant answers. However, the statements we tested resulted in correct answers not directly related to a preconceived ‘healthy’ view of each soup (for instance, the salt content of vegetable soup), thus probably limiting this bias.
One limitation of the study was that the MLT was not compared with a label format providing more detailed information, such as the Guideline Daily Amount (GDA). The GDA includes the amount, in grams and percentages of standard energy intake, of calories, sugar, total fat, saturated fat and salt per typical serving(10). Previous research highlighted the fact that while the GDA provides more information and seems less coercive due to the numbers that serve as points of reference, MTL labels are simpler and easier to use and are more accurate at identifying nutrient levels and making comparisons between products(Reference Grunert and Wills4, Reference Borgmeier and Westenhoefer5, 38). In 2008, at the time of the survey preparation, we chose not to include this label (it was endorsed by the European Union in 2010), as GDA was the least preferred system in the exploratory study conducted among 400 persons for selecting a maximum of five label formats to be tested. Another weakness of our survey was its within-subject design. This may have induced carryover effects wherein responses to the label format might be influenced by the previous formats seen, especially in terms of understanding. However, the latter did not increase with the label rank of presentation, which reasonably let us think that only limited bias would have been found in participant answers. Moreover, the within-subject design was specifically chosen so as to control individual differences in participants and to reduce error variance associated with them(Reference Keppel and Wickens39).
Although detailed FOP labels such as MTL are usually best appreciated by the general population(Reference Grunert and Wills4, Reference Feunekes, Gortemaker and Willems6, Reference Gorton, Ni and Chen17), our study indicates that perception of FOP labels varies across population subgroups, with better acceptability and understanding of simple formats such as the STL, Green Tick or PNNS logos among persons with low socio-economic status and little nutritional knowledge. These findings provide useful information on the most appropriate FOP label formats so as to efficiently target subgroups with low socio-economic status and poor nutritional knowledge, and who are thus at higher risk of diet-related chronic diseases than other segments of the population(Reference Grunert and Wills4, Reference Campos, Doxey and Hammond12). Moreover, our results indicate that simple formats may be most effective in increasing awareness of healthy eating among consumers less attentive to nutritional information on packaged foods. However, these results must be confirmed by studies assessing observational use of FOP labels in real-life settings. Further work exploring variations in labelling perception according to factors such as healthiness of dietary patterns is needed to facilitate development of appropriate and effective formats for aiding consumers in targeted subgroups to make healthier food choices.
Acknowledgements
This study was supported by the French National Agency of Research within the PNRA 2007 programme (ANR-07-PNRA-018). The authors declare that they have no competing interests. C.M. designed the study, supervised the statistical analysis, interpreted the data and drafted the manuscript. P.M. performed the statistical analysis and participated in drafting the manuscript. S.P. was involved in the design of the study and interpretation of the data, and helped draft the manuscript. S.H. designed and coordinated the study cohort and helped draft the manuscript. K.C. coordinated the study cohort, supervised the study, was involved in the interpretation of data and participated in drafting the manuscript. All authors critically reviewed the paper and approved the final version submitted for publication. The authors thank the scientists, dietitians, technicians and assistants who helped carry out the NutriNet-Santé study, and all dedicated and conscientious volunteers. They especially thank Victorine Viard for development of the questionnaire, Gwenael Monot (computer scientist) for coordinating computer aspects of the NutriNet-Santé Study and Aurélie Malon for help in the coordination of data collection; Voluntis (a healthcare software company) and MXS (a software company specialising in dietary assessment tools) for developing the NutriNet-Santé web-based interface according to guidelines; and Jerri Bram for English editing of the manuscript.



