


Introduction
Ice cliffs are a common occurrence atop and at the margins of glaciers around the world (e.g. Winkler and others, Reference Winkler2010; Watson and others, Reference Watson, Quincey, Carrivick and Smith2017a; Herreid and Pellicciotti, Reference Herreid and Pellicciotti2018), and possibly beyond (Dundas and others, Reference Dundas2018). They are a particularly notable feature of debris-covered ablation zones of mountain glaciers, where debris-covered ice resides both above and below the ice cliff. In these cases ice cliffs are usually readily identified by steep slopes and lack of supraglacial debris cover (Fig. 1), although it can be challenging to define nascent or decaying features (Herreid and Pellicciotti, Reference Herreid and Pellicciotti2018). Due to the surface characteristics of ice cliffs, their energy balance and ablation differs substantially to that of the surrounding terrain (e.g. Sakai and others, Reference Sakai, Nakawo and Fujita2002; Han and others, Reference Han, Wang, Wei and Liu2010; Reid and Brock, Reference Reid and Brock2014). It was thus recognised in early observations that these ice cliffs represent ‘hotspots’ of ice ablation within the otherwise debris-covered ablation zone (e.g. Inoue and Yoshida, Reference Inoue and Yoshida1980; Sakai, Reference Sakai1998).
Glacier-based ice cliff on a debris-covered glacier in the Tien Shan, top (image credit: Mayer), and a land-based ice cliff at the edge of the northern ice field, on the summit of Kibo, Tanzania, with weather stations on the upper surface indicating the scale, bottom (image credit: Nicholson).

Contemporary interest in ice cliff ablation processes stems from the observation that ice cliffs are the cause of a significant portion of a glacier's mass loss (e.g. Brun and others, Reference Brun2018; Anderson and others, Reference Anderson, Armstrong, Anderson and Buri2021; Buri and others, Reference Buri, Miles, Steiner, Ragettli and Pellicciotti2021). Estimates for surface mass loss due to ice cliffs have included: 40% of the ablation from the debris-covered portion of Ngozumpa Glacier, Nepal (Thompson and others, Reference Thompson, Benn, Mertes and Luckman2016); 24% of the meltwater from the debris-covered portion of the Lirung Glacier, Nepal (Immerzeel and others, Reference Immerzeel2014) and 12% of the subdebris melt from the Koxkar Glacier, Tien Shan (Juen and others, Reference Juen, Mayer, Lambrecht, Han and Liu2014) – this being despite the fact that ice cliffs account for a very small proportion (typically 1–2%) of the overall ablation zone surface area (Steiner and others, Reference Steiner, Buri, Miles, Ragettli and Pellicciotti2019). The local enhancement of ablation at exposed ice cliffs compared to that of the surrounding debris-covered ice is due primarily to the contrasting ablation rates of exposed and heavily debris-covered ice (Steiner and others, Reference Steiner, Buri, Abermann, Prinz and Nicholson2022), which in a global assessment is consistently 2–3 times higher than melt rates of the surrounding debris-covered ice (Miles and others, Reference Miles, Steiner, Buri, Immerzeel and Pellicciotti2022), and can be exacerbated by the specific ice cliff orientation to the sun.
Ice cliffs can be initiated by three distinct facets of a glacier: from the side of a glacier's steep medial moraine or margin (M-type); from a crevasse (C-type); from the wall of a water channel or melt pond (H-type) (Reid and Brock, Reference Reid and Brock2014; Mölg and others, Reference Mölg, Ferguson, Bolch and Vieli2020; Kneib and others, Reference Kneib2023). Consequently, their distribution over the glacier surface is conditioned by glacier dynamics and hydrology (Steiner and others, Reference Steiner, Buri, Miles, Ragettli and Pellicciotti2019; Sato and others, Reference Sato2021; Kneib and others, Reference Kneib2023). Once initiated they retreat by backwasting the rearward ice away, thus causing the debris on top of the cliff to fall to the bottom and reform the debris layer there. They can exist across a whole range of size scales, with slope faces up to several tens of metres in length and widths in excess of 100 m (Steiner and others, Reference Steiner2015). Many of the observed ice cliffs are approximately planar (see Fig. 2), for example up to 80% of cliffs in the Langtang catchment of Nepal are identified as this type (Steiner and others, Reference Steiner, Buri, Miles, Ragettli and Pellicciotti2019). Typical ice cliff slope angles on debris-covered glaciers are ~40–50° (Brun and others, Reference Brun2016), although cliffs can exist well outside this range too. Superimposed on this general planar shape, smaller scale features such as water runnels, steeper/shallow sections and curvature, particularly due to supraglacial water action, can also affect the local cliff morphology (Reid and Brock, Reference Reid and Brock2014). For example, the influence of adjacent melt ponds can steepen the slopes of the lower 1–2 m of adjoining ice cliff due to additional heat sources and thermal erosion by the water, for example Miles and others (Reference Miles2016); Watson and others (Reference Watson, Quincey, Carrivick and Smith2017a).
Near-planar debris-based ice cliff from Tien Shan (Mayer).

Ice cliffs on debris-covered glaciers can persist for several years (Reid and Brock, Reference Reid and Brock2014; Thompson and others, Reference Thompson, Benn, Mertes and Luckman2016; Brun and others, Reference Brun2018; Kneib and others, Reference Kneib2021), demonstrating that they can be quasi-stable features on multi-annual timescales. Yet it is evident from satellite imagery that ice cliffs do not persist indefinitely, as their number and total area change over time (Thompson and others, Reference Thompson, Benn, Mertes and Luckman2016; Watson and others, Reference Watson, Quincey, Carrivick and Smith2017a; Buri and Pellicciotti, Reference Buri and Pellicciotti2018; Sato and others, Reference Sato2021). For example, a decadal catchment study by Steiner and others (Reference Steiner, Buri, Miles, Ragettli and Pellicciotti2019) indicated that only ~10% of the original ice cliffs persisted. Ice cliff termination can occur as a result of the ice cliff backwasting into ice that diminishes in height rearwards of the cliff. Ice cliff termination has also been suggested to be due to ice cliff flattening (e.g. Sakai and others, Reference Sakai, Nakawo and Fujita2002; Reid and Brock, Reference Reid and Brock2014; Buri and Pellicciotti, Reference Buri and Pellicciotti2018), whereby the slope of the ice cliff reaches a critical angle at which debris can no longer fully slide down the face (suggested as 40° by Reid and Brock (Reference Reid and Brock2014) and 30° by Sakai, Reference Sakai1998), causing the cliff face to be progressively buried by debris delivered from the upper glacier surface (Thompson and others, Reference Thompson, Benn, Mertes and Luckman2016).
Data relating to ice cliffs on debris-covered glaciers has typically come from only a small population of direct and remote observations (see Kneib and others, Reference Kneib2023 for a recent exception), making it challenging to distinguish site-specific processes from generalised behaviours. In this paper we seek to help bridge this gap by creating a new model of a canonical ice cliff. Particular attention is given to debris-based ice cliffs, that is ice cliffs whose lower part of the face adjoins debris-covered ice (unless stated otherwise, we now simply refer to these as ice cliffs). This sheds broad light on the key driving processes behind ice cliff dynamics, thus hopefully allowing for better understanding of them and paving the way to better modelling their future evolution, and including their effects in larger scale regional glacier modelling. Published data from the Baltoro Glacier in the Karakoram Range, Pakistan, are then applied to the modelling to see how well it predicts and explains as-of-yet unpublished observations. Once developed, we explore how the modelling and implications can be applied to land-based ice cliffs which exist at the margins of glaciers, where the bottom of the ice cliff adjoins solid land.
Reassessments
There appear to be at least three notable points concerning ice cliffs within the literature that require reassessment, and were integral in motivating our study.
The first concerns the comparability of ice cliff retreat rates determined from field measurements. The horizontal rate of retreat of an ice cliff (referred to as the backwasting rate, and we likewise use this terminology) can be measured as the rate of change in horizontal distance between the top of the ice cliff and an object fixed in the debris surface (e.g. Han and others, Reference Han, Wang, Wei and Liu2010), see Figure 3. Alternatively, cliff retreat rate has been determined by drilling measurement stakes perpendicularly into the surface of the ice cliff and then taking a horizontal component of the measured melt rate, for example Reid and Brock (Reference Reid and Brock2014) and Steiner and others (Reference Steiner2015). In formulating our model we identified a discrepancy between these types of measurements concerning how they account for the melt rate of the surrounding debris-covered portion of the glacier itself, which acts as a vertically moving coordinate system, which we elaborate in the first part of our Results section.
Schematic diagram of a planar ice cliff (see Fig. 2) melting between the times t 1 and t 2. The direction of action of the melt rates ($\dot {m}_{\rm i},\; \, \dot {m}_{\rm ia},\; \, \dot {m},\; \, r$ ) are represented by the associated arrows. The backwasting rate r can be directly measured from distance observations of marked debris on the upper surface, here represented by the red dot. The dashed line represents a stake drilled perpendicularly into the ice, highlighting that such measurements actually have a downslope velocity.

The second is the idea that poleward-facing ice cliffs are steeper than their equator-ward counterparts (Sakai, Reference Sakai1998; Sakai and others, Reference Sakai, Nakawo and Fujita2002; Buri and Pellicciotti, Reference Buri and Pellicciotti2018). However, out of the four Northern Hemisphere studies which present slopes angles versus orientation for individual cliffs (Sakai and others, Reference Sakai, Nakawo and Fujita2002; Watson and others, Reference Watson, Quincey, Carrivick and Smith2017a; Reid and Brock, Reference Reid and Brock2014; Brun and others, Reference Brun2018), only one of them shows northern-facing cliffs to be steeper, on average, than the southern-facing slopes (Table 1). This is also the case for average cliff slopes derived from photogrammetric surface models of debris-covered Langtang Glacier (Central Himalaya, Nepal) (Buri and Pellicciotti, Reference Buri and Pellicciotti2018), for which cliffs in the north-facing quadrant have slope angles of 43$^\circ$ compared to 46$^\circ$
 for the opposing south-facing quadrant. Rather than slope angle, the most notable distinguishing aspect of poleward-facing cliffs is that they appear to be consistently more prevalent in the available datasets than other, especially equatorwards, aspect orientations (Thompson and others, Reference Thompson, Benn, Mertes and Luckman2016; Watson and others, Reference Watson, Quincey, Carrivick and Smith2017a; Buri and Pellicciotti, Reference Buri and Pellicciotti2018). This is possibly due to the improved survivability of the slower melting poleward-facing ice cliffs.
Mean slope angles of sets of ice cliffs as presented within the literature

They have been separated into northern slopes (west to east through north) and southern slopes (east to west through south), where the bracketed numbers reflect the number of ice cliffs within each averaged quantity.
The final point we reassess is the notion that ice cliff flattening, below the critical angle for debris to slide down the ice cliff, is a cause for their eventual demise through debris burial (e.g. Sakai and others, Reference Sakai, Nakawo and Fujita2002; Reid and Brock, Reference Reid and Brock2014). This has, in particular, been highlighted as a mechanism for termination for equator-facing ice cliffs by Buri and Pellicciotti (Reference Buri and Pellicciotti2018). They noted that surface energy-balance studies and modelling suggest the difference between high energy receipts at the top of an ice cliff and lower energy receipts at the base of an ice cliff are most pronounced for equator-facing ice cliffs, and this would lead to more pronounced flattening than for other aspects. While we do not oppose the observation that ice cliff burial can occur, field evidence does not support an aspect control on the ice cliffs where slope relaxation was observed. Watson and others (Reference Watson2017b) and the model results in Buri and others (Reference Buri2016) (their Fig. 11) predict flattening in all aspects, suggesting that the simulated burial of the equator-facing ice cliffs arises due to the faster ablation rate, and specifics of the burial parameterisation implemented, rather than the proposed explanation.
As these three issues attest, aspects of ice cliff modelling warrant a reanalysis so as to clarify them and investigate the consequences. It is tempting to seek a rectification through a heavy computational approach. Yet such an approach is only sensible if set upon firm scientific and methodological foundations where all of the key physics is identified – as a minimum benefit, a simplified approach gives a way in which the results of numerical models can be robustly checked. But as we shall show, these discussed points do not require such a numerical approach to elucidate their resolution, as they can largely be dealt with by creating an ice cliff model which incorporates the melt of the surrounding glacier.
A simple ice cliff model
Here we present a model of a canonical ice cliff. The model and underlying geometry of the ice cliff are intentionally simple. In so doing, we neglect many commonly observed considerations, such as non-planar geometry, melt ponds, complex local terrain, etc. We exclude such considerations so as to extract the physics fundamental to ice cliff dynamics, without being distracted by local idiosyncrasies. We consider the situation shown in Figure 3, in which a planar, glacier-based ice cliff is backwasting. The model is technically in 3-D, and thus so as our findings. However we do not include any variations in the cross-slope (into the page) direction, so the model describes the cliff's 2-D cross section. It represents a quasi-steady-state situation in which the slope angle, θ, remains uniform as the ice cliff retreats. The surrounding upper and lower debris layers are taken to be horizontal, with a downwards melt rate $\dot {m}$ (although if they were inclined, one could simply consider the vertical component of it). We use the declining glacier surface as the frame of reference. As the ice cliffs retreats, the debris at the top of the slope moves downslope, joining the debris layer at the bottom. In so doing, debris thickness at the top and bottom are assumed to be close enough for their respective melt rates to be considered the same. We note that differing debris thicknesses/melt rates at the top and bottom would lead to a time-varying slope length. This does not pose any significant issues, and we consider an extreme case of this within our land-based ice cliff analysis.
Geometry of ablation
By comparing the melt rates in Figure 3, one can see that the apparent vertical melt rate, $\dot {m}_{\rm ia}$ , can be constructed via two separate geometric links used together with the slope angle: the first from the tangential melt rate $\dot {m}_{\rm i}$
 , and the second from the melt rate of the debris layer, $\dot {m}$
 and the backwasting rate, r. Equated together, this gives

The geometric argument of Figure 3 does not preclude the cliff from melting to the right. However since debris cannot independently move along a horizontal surface, we need to impose this constraint upon the direction of the backwasting rate. And so we must restrict the model to only considering the positive (i.e. leftwards) contributions of the backwasting rate, r +. We thus obtain an energy balance equation linking the tangential melt rate of the ice cliff with the (horizontal) backwasting rate:

We note that this equation can also be derived via a full system conservation of energy approach, which produces the same result but with far more mathematical effort.
Determining slope angle
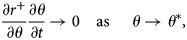
We next require a condition for the slope angle, θ, to be determined endogenously. To achieve this we first note that field observations show ice cliffs to be quasi-stable structures with only slow variations in their geometry. Converting this to our quasi-steady model with fixed geometry, we simply require the backwasting rate to converge to a steady state, where the (site-specific) slope angle which achieves that is the endogenously determined slope angle, θ*, that is

This condition makes intuitive sense, for otherwise it would be the equivalent of expecting the model's backwasting rate and slope angle to vary in time for perpetuity, even when the model's incoming energy flux (and debris geometry) were held as constant.
As one can see from Eqn (2), and noting that $\dot {m}_{\rm i}$ and $\dot {m}$
 are daytime-averaged quantities, we have that r + is a function of slope angle only. Through use of the chain rule the above steady state criteria then becomes
meaning that either ∂r +/∂θ or ∂θ/∂t must tend to zero. At first glance it is tempting to take ∂θ/∂t = 0, meaning the slope angles are set by their initial conditions. Yet a slope angle fixed by initial conditions would be hard to wrestle back to reality, as there are always small local variations in slope angle along an ice cliff. An initial angle condition would not allow such variations along the slope to smooth away in time, and instead all manner of large, sharp corners and geometries could emerge along the ice cliff surface: this would contradict the initial slope angle condition (i.e. the slope angles would not remain those set by initial conditions), and contradict the model's geometry which considers a flat slope (even if this geometry is an idealised version of a steady-state ice cliff, all elements must be consistent with one another). Instead, we require a condition which is self-consistent within the modelling, consistent with observations and consistent with the early stages of slope evolution (even if we don't explicitly consider it here). And so from Eqn (4) we use the condition

We explore a broader physical meaning of this particular condition in the discussion section of this paper, and see how it might be applied to more general ice melting processes (i.e. how it may be applicable to far less rigid geometries than we consider here).
Making use of the above condition and applying it to the backwasting rate Eqn (2), we obtain the full mathematical form of the second condition:

The root of this equation, θ*, is that which endogenously selects the steady-state slope angle. With the two mathematical elements of our modelling now defined, Eqns (2) and (6), we can proceed towards solving and interpreting our model.
Ablation rates
To estimate a value for the preferential slope angle (which may be achieved via a simple root-seeking approach) one must first provide functional forms to $\dot {m}_{\rm i}$ and $\dot {m}$
 . Here we choose to utilise the energy-balance model provided in Evatt and others (Reference Evatt2017) which was developed to model ice sails, which are large pyramid ice structures that protrude from the surface of a small number of high elevation debris-covered glaciers in the Karakoram and Himalaya. The fact that the energy-balance model considers each face of the ice sail in turn (each of which was modelled as a planar surface), makes it an ideal model for our purpose here. The mathematical basis of Evatt and others (Reference Evatt2017) was developed from a study into the Østrem curve of ice ablation rate as a function of overlying debris thickness by Evatt and others (Reference Evatt2015), which provided a highly tractable equation for estimating the melt rate of ice below a debris layer, and we note that the energy-balance aspects of the ice sail model were themselves consistent with the ice cliff model developed in Han and others (Reference Han, Wang, Wei and Liu2010), which also considered a planar ice cliff.
For ease of exposition, we do not derive the energy balance from first principles and instead re-write the mathematical energy balance felt by a planar ice surface as derived in Evatt and others (Reference Evatt2017) and Evatt and others (Reference Evatt2015):

where H is the thickness of the debris layer, and the other parameters are defined as

Here the two θ-dependent parameters are defined as


where the debris surface temperature is given by

and the vectors n and l are

The parameter η represents the hour angle of the sun and ψ is the azimuth, which is the clockwise orientation from the north of the ice cliffs face. All other parameters are defined in Table 2. We note that when Eqn (9) was first presented in Evatt and others (Reference Evatt2017), an erroneous θ term was included outside of the integral, and we have rectified the mistake here.
Model implications
We now draw some initial conclusions about ice cliff behaviour directly from mathematical considerations of our model.
Backwasting rate field measurements
Equation (2) is consistent with abundant observations that ice cliffs which face the sun have a higher backwasting rate than those which face away. Yet it clearly differs from what one might initially expect the backwasting rate to be in terms of the tangential melt rate (i.e. $\dot {m}_{\rm i}\sin {\theta }$ ), because now we are taking account of the melting debris-covered ice. And so for the ice cliff to maintain a quasi-steady state (as their persistence evidently attests to), the backwasting rate and slope angle must appropriately adjust as the debris-covered ice surfaces lower – hence the presence of the $\dot {m}$
 term in Eqn (2). Once in balance, the geometry of the ice cliff is maintained. Yet the constant geometry of the ice cliff presents an interesting illusion, as shown in Figure 3: the dashed tangent line drawn through the ice cliff faces represents a measurement stake drilled through the surface. One can see that it starts a positive distance downslope of the top of the ice cliff. If one assumed all points on the surface of the ice cliff move back perpendicularly (which would give a backwasting rate of $\dot {m}_{\rm i} \sin {\theta }$
 ), then the stake would have remained a fixed distance downslope. However, by letting the upper glacier surface melt by its own accord, the stake actually moves upslope (under other geometric scenarios, downslope) relative to the top of the ice cliff. This means the stake itself has a velocity which needs accounting for before one can infer the true backwasting rate. The size of the error depends upon the difference between the backwasting rate which accounts for the moving frame of reference, Eqn (2), and that given by the erroneous $\dot {m}_{\rm i} \sin {\theta }$
 estimate. The error could be positive or negative. The corollary of which is that by ignoring the downwards moving debris-covered ice surface, a pure stake measurement approach will likely lead to an incorrect estimate in how much ice will be melted by the retreating ice cliff, and thus an incorrect estimate in the contribution of ice cliffs to glacier-wide mass loss. Overlooking this consideration can therefore cause inconsistencies between modelled results and measurements. A possible example of this discrepancy can be found in Han and others (Reference Han, Wang, Wei and Liu2010), whose modelling did not account for a moving frame of reference. Their in-field estimates of backwasting rate were achieved using a mixture of stake measurements (which would be inconsistent with our modelling) and cliff-edge retreat rates (which would be consistent). As their results showed, and the authors noted, a mismatch between the predicted results and the in-field data was evident. It is therefore feasible that had they included the necessary adjustment for the declining debris-covered ice, then their sets of results would have been more closely aligned. Sadly, without all of the required data, we were unable to test this possibility.
It is therefore more robust (and simpler) to obtain the actual backwasting rate by using the alternative field practice of measuring the rate of change of the distance between the ice cliffs upper lip and a point fixed on the upper debris surface (as highlighted by the red dot in Fig. 3). Clarifying, and accounting for, the geometry of various measurements and model frameworks is necessary to allow all the limited available data to be converted consistently for mutual comparison and evaluation of numerical models of cliff retreat.
Aspect controls on ice cliffs
We test our earlier empirical suggestions of an indifference between north-facing and south-facing ice cliffs on our model. To achieve this we compare the slope angle as predicted by solving Eqn (6), subject to the energy balances of Eqn (7), for different values of azimuthal angle ψ (i.e. the angle the ice cliff is orientated). And with ψ only appearing as part of the short wave energy budget, Q i, which is a linear dependency in $\dot {m}_{\rm i}$ , Eqn (6) tells us we need only consider the existence of variations in

If one neglects the maximum term within the integral of Q i (the presence of which accounts for self-shading of the cliff, and so neglecting it assumes the cliff is always illuminated during daylight hours), then it is straightforward to show the above quantity has no ψ dependence. This means that provided the cliff is always illuminated, the critical angle for the slope of the ice cliff is independent of orientation. Evidently this lack of self-shading is only possible for north- and south-facing cliffs which are planar and where the latitudes are low enough for self-shading to not dominate. In reality there will be many topographic variations which cause the slopes of similarly located north- and south-facing cliffs to vary accordingly. But the point now stands: it is the nature of an unshaded canonical ice cliff to have a slope indifference between north- and south-facing orientations, which is in keeping with our earlier analysis of field data. As the model and its parameters are symmetric about noon, slope angles for east-facing ice cliffs will be the same as west-facing ice cliffs, although in the real world this symmetry may be skewed by diurnal cloud cycles (Sakai and others, Reference Sakai, Nakawo and Fujita2002).
Application to Baltoro Glacier
With our initial analysis conducted, we now use our model to present computed results for the backwasting rate and slope angles in the parameter space of existing ice cliffs at the Baltoro Glacier in the Karakoram Range. There, ice cliffs exist in a defined region of the lower tongue, where a number of observations exist regarding ice cliff distribution, debris thickness distribution and sub-debris melt rates. For these quantified assessments we use the data in Table 2, which was presented in Evatt and others (Reference Evatt2017) and produced melt rates of debris-covered ice in close alignment to field observations by Mihalcea and others (Reference Mihalcea2008); Soncini and others (Reference Soncini2015) and Groos and others (Reference Groos, Mayer, Smiraglia, Diolaiuti and Lambrecht2017). These aforementioned studies did not present results specifically detailing ice cliffs that were within their study sites, but observed the general melt conditions of the ice cliff region. As of yet unpublished fieldwork by Mayer (with over 20 years experience upon the Baltoro Glacier, and other debris-covered glaciers in this region, and co-author of the earlier field studies) tells us that ice cliffs on Baltoro were not observed for debris thicknesses up to ~10 cm, and below this thickness ice sails can exist on Baltoro (Evatt and others, Reference Evatt2017). Typical slope angles of the ice cliffs were measured at ~45°. At the geographically similar Koxkar Glacier in the Tien Shan Range, backwasting rates have been measured (via the velocity of the retreat of the upper slope) by Mayer at between 3.5 and 5 cm d−1 – results which are in keeping with Han and others (Reference Han, Wang, Wei and Liu2010). All of these (yet) unpublished reference points are consistent with geographically distinct ice cliffs studies (e.g. Reid and Brock, Reference Reid and Brock2014) and act as useful reference for validating our model's results.
Parameter values representative of July daytime conditions on the Baltoro Glacier, as determined in Evatt and others (Reference Evatt2017), except for the ice albedo, which is taken as 0.3 as a consequence of dust upon a cliff's surface

Ice cliff form and behaviour
Our first result, Figure 4, shows the backwasting rates, r + as computed from Eqn (2) subject to the slope angles determined via Eqn (6). We see the marked reduction of backwasting rate for the northward-facing ice cliffs, which is in line with all the available field observations, as a result of the solar geometry. Our model suggests those ice cliffs sat within debris fields of ~11–40 cm thickness, have a backwasting rate of ~0–2.5 cm per 12 h mean illumination (i.e. each day it moves back 0–2.5 cm). Over the 3 months melt season, this backwasting equates to ~0–2.25 m. An interesting observation for this particular case is the prediction that ice cliffs cannot exist for debris thicknesses below ~11 cm depth. Below this debris depth the geometry of the ice cliff cannot be preserved, as the melt of low-enough angled clean ice can no longer be matched by that of the declining debris-covered ice. This depth is where the predicted melt rate of debris-covered ice equals that of the bare ice when horizontal. This is in keeping with observations from the Baltoro Glacier. It is of note that for shallower thicknesses, ice sails have a geometry which can exist on the Baltoro Glacier, but cannot exist for debris thicknesses thicker than that level (Evatt and others, Reference Evatt2017). In other words, our model predicts that above a certain debris thickness (where the melt rate of bare ice matches that of debris-covered ice) ice cliffs can exist but ice sails cannot, and their existences swap around below that critical level.
Predicted backwasting rate, r +, of different orientations of ice cliffs for Baltoro Glacier, Karakoram, calculated using the data of Table 2.

In regards to the predicted ice cliff slope angles for Baltoro, we see the slope angle increases with debris thickness, with north-/south-facing cliffs being slightly steeper than the east-/west-facing cliffs (Fig. 5). Again, the fact that ice cliffs upon Baltoro Glacier have debris thicknesses of ~10–40 cm with slope angles of ~45°, is consistent with our model which predicts slopes in the range 25–50° over those debris thicknesses. Furthermore, the minimum debris thicknesses above which our stable ice cliff geometry can exist has slope angles of ~25° (as opposed to them starting from flat). This lowest possible slope angle is suspiciously close to the critical slope angle that has been suggested to exist for causing ice cliff termination via debris unable to slip downslope, for example Reid and Brock (Reference Reid and Brock2014) and Sakai (Reference Sakai1998). We questioned the mechanism of burial as applied to a canonical cliff as the cause of cliff termination, and now we see that our model presents an endogenously determined reason for the lack of flatter ice cliffs: a balance between the melting of a uniform ice cliff and the melting of the surrounding debris-covered ice can only exist for slope angles above a critical threshold. Below this angle, an ice cliff simply cannot stably exist. Notably, this important result is found without the need to invoke additional debris reworking processes within the model.
Predicted slope angle of ice cliffs as a function of supraglacial debris thickness, for Baltoro Glacier, Karakoram, calculated using the data of Table 2.

Sensitivity analysis
We now conduct a sensitivity analysis of our study for east-/west-facing ice cliffs, so that one can gain an understanding of how the model results should vary when applied to distinct areas or different climate zones. We conduct three key tests as shown in Figures 6 and 7. The first situation being fully saturated conditions, $r_{\rm h} = 100\%$ , so that there is no evaporative heat flux on the ice cliff or the debris layers, thereby reducing their melt rates. This only strongly effects the ice cliff surface, as although field measurements sampling a spatial mean of debris and exposed ice show non-negligible evaporation (Miles and others, Reference Miles2018; Steiner and others, Reference Steiner2018; Nicholson and Stiperski, Reference Nicholson and Stiperski2020), beneath the debris thickness of interest, the evaporative heat flux is negligible (Evatt and others, Reference Evatt2015). Under these conditions the ice cliff can exist for shallower debris thicknesses, down to ~6 cm, although the corresponding initial angle remains ~25°. As one expects for these conditions a higher backwasting rate is predicted, where the 20 cm debris thickness backwasting rate is now ~50% higher than the Baltoro case (when $r_{\rm h} = 50\%$
 ). We also see that the predicted slopes are higher for a given debris thickness, by ~10°. The second test is to increase the albedo of the ice cliff to one observed on clean ice surfaces on the Baltoro Glacier, α i = 0.42 (Evatt and others, Reference Evatt2017). In so doing, we see the backwasting rate is reduced (because less energy is now being absorbed by the ice surface), and the debris thickness beyond which ice cliffs can exist is increased. Here we find the slope angles required for the steady states are now shallower than before by ~15°. The final test is when we increase the downwelling solar flux, Q ↓, by 25% to 625 W m−2. As is the case for increasing the relative humidity, we see an increase in the backwasting rate and a decrease in the minimum depth at which the ice cliffs can exist. As all of these model results demonstrate, even when an ice cliff can endogenously adjust its slope angle, warmer/moister conditions upon a glacier should still be expected to have higher backwasting rates. And now we also see that they correspond to steeper ice cliff slopes and the potential to exist for shallower debris thicknesses which thereby extends their potential lifetime and thus the total amount of ice they could melt away. Putting this all more directly: with all else equal, warmer conditions should see ice cliffs melt at a faster rate and do so for longer.
Sensitivity of backwasting rate, r +, for east-/west-facing cliffs in response to perturbed humidity, albedo and insolation conditions (see text for details) in comparison to conditions for Baltoro Glacier, Karakoram, given in Table 2.

Sensitivity of ice cliff slope angle for east-/west-facing cliffs in response to perturbed humidity, albedo and insolation conditions (see text for details) in comparison to conditions for Baltoro Glacier, Karakoram, given in Table 2.

Volume loss contribution from ice cliffs
The rate of volume loss per unit width from a backwasting ice cliff is hr +, where h is the vertical elevation of the ice cliff. And with elevation h fixed in our model, it is by considering variations in the backwasting rate r + that we can see how estimates in volume loss will vary. To assess the impact our approach for modelling backwasting rates has relative to those not accounting for the moving frame of reference (i.e. the declining surface of the debris-covered ice), we now present a comparison. Figure 8 shows how our computed backwasting rate compares to backwasting rates estimated without the moving frame of reference ($\dot {m}_{\rm i} \sin {\theta }$ ). We have chosen to use fixed slope angles of 35°, 45° and 55° for the non-moving frame model. One can use Figure 5 to back out the associated slope angles from our models’ backwasting rate. The results show that the backwasting rates can equate for a particular debris thickness. But below that thickness the backwasting rate of our model becomes markedly lower with our model, and above that our model gains a higher backwasting rate. As this divergence attests, without considering the melting of the surrounding debris layer, estimating backwasting rates and/or volume loss can become highly inaccurate. This is all the more pertinent as ice cliffs are often highlighted as major sources of anomalous glacier volume loss (e.g. Buri and others, Reference Buri, Miles, Steiner, Ragettli and Pellicciotti2021). In addition, unlike the model developed within our study, the results of the previous methodology do not provide an endogenous way for ice cliffs to terminate, that is the previous method predicts ice cliffs can exist for all debris thicknesses.
Backwasting rates, r + for east-/west-facing ice cliffs, calculated using the values in Table 2. The continuous line is calculated from this paper's modelling, whereas the dashed lines are backwasting rates calculated with fixed slope angles and no consideration of the moving frame of reference caused by the melting of the surrounding debris-covered ice.

Discussion
Ice cliff termination
There is observational evidence for both persistent and transient ice cliffs. One termination mechanism occurs when an ice cliff is backwasting into debris-covered ice that is decreasing in height rearwards of the cliff, which will necessarily have to shrink in area and terminate if there is insufficient rearward ice. Yet quite how ice cliff termination happens when the rearward slope is not declining was less clear. As we have previously discussed, termination cannot simply be the ice cliff reclining to a certain angle below which the debris can no longer slide down the slope thereby burying it (Sakai and others, Reference Sakai, Nakawo and Fujita2002; Reid and Brock, Reference Reid and Brock2014), because if the slope angle is insufficient to allow debris slide down the slope, then sliding debris also cannot bury the exposed face. But now our results predict that there are some elements of truth in this explanation: we see that there is a critical slope angle, and below this threshold ice cliffs become unstable, thus ensuring their relatively rapid termination. Notably, our results have also predicted that ice cliffs will be flatter the thinner the debris layer: if an ice cliff backwastes into thinner debris covering, then the slope angle should reduce.
We acknowledge that more factors come into play in the process of terminating ice cliffs because of the inherently complex mechanics of cascading debris. One such complicating factor will be due to the presence of meltwater (Moore, Reference Moore2018). Another factor can be seen by looking again at Figure 1 (top), which shows a mound of debris reaching half-way up a section of the ice cliff. In our simple model, we assumed that all debris that rolls or slides down the slope does so uniformly and neatly, thus re-creating the upper surface debris at the bottom. In reality the debris can be very heterogeneous in both thickness and particle size distribution and thus even without a change in ice cliff slope ‘clogging’ can occur (i.e. falling debris does not reach the bottom, but instead gets stopped by previously fallen debris above the bottom of the cliff). In so doing, that portion of the ice cliff must reduce its vertical extent and is thus no longer a self-sustaining feature. From a mathematical stand-point, such a termination is hard to model and infer explanations from. Observations from in situ automatic cameras are almost certainly a better way forward to see how effective (if at all) clogging is at terminating ice cliffs. Likewise, curved cliff geometry can produce contrasts in the debris thickness at the top and base of the cliff by funnelling or spreading debris, and these contrasts will necessarily cause changes in the ice cliff area and termination processes by causing differing ablation rates above and below the ice cliff (see e.g. Mölg and others, Reference Mölg, Ferguson, Bolch and Vieli2020; Westoby and others, Reference Westoby2020). Furthermore, it is worth noting that combinations of all termination aspects might simultaneously exist on any given ice cliff (Fig. 9).
Convex ice cliff in the Tien Shan. The geometry automatically produces a thicker debris layer at the bottom than exists at the top. In so doing, this causes a difference between the melt rate of the upper and lower surface, causing the ice cliff to reduce its vertical extent (Mayer).

Land-based ice cliffs
An interesting corollary of our modelling is in its application to land-based ice cliffs, which also exhibit enhanced melting relative to the surface area (Lewis and others, Reference Lewis, Fountain and Dana1999). Such ice cliffs may be found at the snout of glaciers (see Figs 1, bottom and 10), and even high up on Kilimanjaro (Winkler and others, Reference Winkler, Pfeffer and Hanke2012). Applying the same geometric logic as used before, a simple modification to the model now shows how to model the backwasting rates at the top and bottom portions of the ice cliff, Figure 10. By construction, the land at the base of the ice cliff is not losing elevation, and thus a canonical land-based ice cliff is not in a steady state. Part of the remedy is to assume that enough glacial mass is supplied from upstream to offset the mass loss at the top of ice surface (i.e. the upper surface thickens). But even then, we see that the top and bottom of the ice cliff have distinct rates of retreat: at the top of the land-based ice cliff we have the same as before

and at the bottom we now must have

And so we see

meaning that the top rate is always slower than that at the bottom (because the second term on the r.h.s. is always positive). As such, a land-based ice cliff with a planar geometry does not have the luxury of being able to find an angle at which the melt rate is minimised, and instead it will always steepen. This steepening has a limit however, and that limit is the angle at which the ice calves off. And so from this we suggest that the calving process which is evident at the snout of glaciers can be a mechanical response to a melt process forcing.
Schematic diagram of a land-based planar ice cliff melting between the times t 1 and t 2. The direction of action of the melt rates ($\dot {m}_{\rm i},\; \, \dot {m},\; \, r_{\rm bottom},\; \, r_{\rm top}$ ) are represented by the associated arrows. The figure demonstrates that the backwasting rate at the top of the ice cliff, r top, is less than that at the bottom of the ice cliff, r bottom.

Melting on the edge
In deriving the second equation in our model which helped determine the slope angle, we used the fact that our idealised ice cliffs will tend towards a steady state. In do doing we produced the condition

The above condition has a potential physical interpretation beyond what we initially sought, which might then lend it to being a more general principle than we have considered here. To tentatively expand: the rate of energy for melting the ice cliff is given by $\dot {E} = \rho L_{\rm m} hr^ +$ , where h is the vertical cliff height. We suggest the theory that ice preferentially melts so as to minimise its melt rate with respect to its own surface geometry. The justification for this melt energy minimisation being that, with all else equal, faster melting portions of the ice surface will melt away, eventually leaving the slowest melting orientated surface in its place. In our ice cliff case, the orientation is confined to be with respect to θ, meaning we will be left with the above condition (assuming h remains near constant, but is easy to account for otherwise). Such a concept might be useful in free-boundary melt problems, which can be notoriously difficult to solve for complex geometries. Further mathematical analysis coupled with laboratory experimentation will be required to settle the validity of this potential minimisation principle.
Conclusions
We have presented a back-to-basics approach to ice cliff modelling. We have done so in order to rectify some inconsistencies within the literature regarding their characteristics, dynamics and measurement thereof, and to explore the resulting consequences. To achieve this we considered a canonical planar ice cliff, and showed that energy-balance processes allow it to select both its backwasting rate and slope angle. In so doing, we saw that predicted levels of melt from ice cliffs can significantly differ from alternative melt rate models which did not account for the moving frame of reference (caused by the melting of the surrounding debris-covered ice) – this being a critical point as it is the melt volume from ice cliffs which motivates so much research into them. Likewise, consideration of the moving frame of reference showed that estimating backwasting rates through stake measurements drilled into the face of ice cliffs is more complex than originally thought. Instead of that approach, it is simpler to measure the backwasting rate by monitoring the rate of change of distance between a fixed point on the upper debris surface and the top of the ice cliff.
We also showed that ice cliffs are not stable features below a critical minimum debris thickness (where the melt rate of the debris-covered ice approximately equals that of flat bare ice). At around this critical debris depth the associated stable slope angle was found to be similar to the minimum angles of observed ice cliffs (in the case studied here ~25°). This therefore provides a more refined explanation to the termination of low-angled ice cliffs: below a critical debris layer thickness an ice cliff switches from being a stable feature to an unstable one, and thus ceases to exist. We briefly explored the impact of our work towards land-based ice cliffs, predicting that it is the nature of land-based ice cliffs to always steepen through melt, up to the point at which the ice will mechanically calve off. Inspired by the melt processes within this paper and taking them to a precarious edge, we hypothesised that with all other things being equal, a melting ice cliff surface will orientate its geometry so as to minimise its rate of melt. We hope that this back-to-basics approach serves to stimulate thoughts and open new strategies to meet some of the open research questions surrounding ice cliffs, for example Steiner and others (Reference Steiner, Buri, Abermann, Prinz and Nicholson2022).
Acknowledgements
This paper is the result of a workshop held at Glurns, with funding support from the University of Manchester. LN and AW were supported by Austrian Science Fund (FWF) Grants V309 and P28521. We are grateful for comments from Christian Schoof and Jakob Steiner, and from members of the audience at the IGS Symposium in Limerick, 2023, regarding a version presented there. We thank the two anonymous reviewers for their insightful comments and suggestions, which helped with this study.


 Open access