


Introduction
Waterhemp has emerged as one of the most problematic weeds in the United States, with widespread infestations in the midwest (Hager et al. Reference Hager, Wax, Simmons and Stoller1997; Hinz and Owen Reference Hinz and Owen1997). In Texas, this species is problematic in row-crop fields (namely, corn, cotton, grain sorghum, and soybean), particularly in the southeast region (P. Baumann, personal communication). Waterhemp is an extremely competitive species and can produce in excess of 100,000 seeds per plant; thus, it is capable of establishing large soil seedbanks (Battles et al. Reference Battles, Hartzler and Buhler1998; Hager et al. Reference Hager, Wax, Simmons and Stoller1997). Waterhemp is a dioecious, obligate outcrosser with potential for interspecific hybridization (<0.2%) with Palmer amaranth (Amaranthus palmeri S. Watson) (Franssen et al. Reference Franssen, Skinner, Al-Khatib, Horak and Kulakow2001; Gaines et al. Reference Gaines, Ward, Bukun, Preston, Leach and Westra2012; Wetzel et al. Reference Wetzel, Horak, Skinner and Kulakow1999). Waterhemp can emerge over an extended period, which allows it to escape management interventions (Hartzler et al. Reference Hartzler, Buhler and Stoltenberg1999). Heavy infestations of waterhemp can reduce soybean and corn yields by up to 56% and 74%, respectively (Bensch et al. Reference Bensch, Horak and Peterson2003; Steckel and Sprague Reference Steckel and Sprague2004). Severe waterhemp infestations not only affect crop yield but also interfere with mechanical harvesting and reduce harvest efficiency, as well as grain quality. Management of waterhemp has become a challenge in recent times due to inconsistent control of this weed with several important herbicides.
There have been numerous reports of waterhemp resistance to several herbicides in the United States. Waterhemp has evolved resistance thus far to acetolactate synthase (ALS), photosystem II (PSII), 5-enolpyruvyl-shikimate-3-phosphate synthase (EPSPS), 4-hydroxyphenylpyruvate dioxygenase (HPPD), and protoporphyrinogen oxidase (PPO) inhibitors, as well as to synthetic auxins (Heap Reference Heap2019) and, more recently, to the very long chain fatty acid inhibitors (Strom et al. Reference Strom, Gonzini, Mitsdarfer, Davis, Riechers and Hager2019). Resistance to the ALS-inhibiting herbicides in waterhemp was reported more than two decades ago (Hinz and Owen Reference Hinz and Owen1997; Horak and Peterson Reference Horak and Peterson1995; Sprague et al. Reference Sprague, Stoller, Wax and Horak1997). The first case of atrazine resistance in waterhemp was documented in Nebraska in 1990 (Schleufer et al. Reference Schleufer, Roeth and Mortensen1992). Field surveys conducted in Nebraska by Anderson et al. (Reference Anderson, Roeth and Martin1996) revealed that 61% of the surveyed accessions were resistant to atrazine. Since its first occurrence in Missouri in 2005, glyphosate resistance has become prevalent in this species across the United States and is now confirmed in waterhemp accessions from at least 18 states (Heap Reference Heap2019).
Resistance to PPO inhibitors is an emerging concern in this species. The first PPO-inhibitor–resistant waterhemp accession was documented in 2001 in a soybean field in Kansas (Shoup et al. Reference Shoup, Al-Khatib and Peterson2003) and subsequently in soybean-corn production systems in Iowa and Illinois (Heap Reference Heap2019). The majority of PPO-inhibitor–resistant waterhemp accessions reported to date are resistant to foliar (POST) applications, whereas PRE applications continue to provide effective control (Wuerffel et al. Reference Wuerffel, Young, Matthews and Young2015). Resistance to the synthetic auxin herbicide 2,4-D was first confirmed in a waterhemp accession collected from a native grass–seed production field in Nebraska (Bernards et al. Reference Bernards, Crespo, Kruger, Gaussoin and Tranel2012). This 2,4-D–resistant accession also exhibited 3-fold resistance to dicamba. More 2,4-D-resistant accessions have been documented in Illinois (Heap Reference Heap2019) and Missouri (Shergill et al. Reference Shergill, Barlow, Bish and Bradley2018). Likewise, waterhemp accessions resistant to the HPPD inhibitors were also confirmed in 2009 in Illinois (Hausman et al. Reference Hausman, Singh, Tranel, Riechers, Kaundan, Polge, Thomas and Hager2011) and Iowa (McMullan and Green Reference McMullan and Green2011).
The evolution of multiple herbicide resistance is of particular concern. Recently, a six-way multiple herbicide-resistant waterhemp accession was confirmed in Missouri for EPSPS, ALS, PSII, PPO, and HPPD inhibitors and synthetic auxins (Shergill et al. Reference Shergill, Barlow, Bish and Bradley2018). Evans (Reference Evans2016) reported five-way resistance in a waterhemp accession in Illinois to ALS, PSII, PPO, and HPPD inhibitors, and synthetic auxins. The evolution of multiple herbicide resistance severely limits the number of herbicide options available for effective weed control.
In Texas, inconsistent or failed control of waterhemp has been reported by growers and crop consultants for many commonly used herbicides (D. Bradshaw, personal communication). Glyphosate, atrazine, and fomesafen have been used widely in row-crop production in the region for many years. Roundup Ready® (Monsanto Company, St. Louis, MO) crop technologies have further increased the reliance on glyphosate over the past two decades (NAAS 2019). Apart from cotton, corn and grain sorghum are important crops in Texas that lead to frequent use of atrazine in the system for weed control. Similarly, tembotrione is an important HPPD inhibitor herbicide in corn production in Texas. The use of dicamba has increased recently with the commercialization of dicamba-resistant (Roundup Ready® Xtend) cotton and soybean. Glyphosate-resistant waterhemp in Texas was first documented in two accessions collected in 2006 and 2008 in the upper Gulf Coast region (Light et al. Reference Light, Mohammed, Dotray, Chandler and Wright2011). Field evidence suggests resistance could now be more prevalent in waterhemp accessions in row cropping systems in Texas (Watson Reference Watson2017). It is imperative to understand the background level of weed resistance to important herbicides in order to design effective management programs, yet current understanding of waterhemp resistance to herbicides in Texas is limited. Thus, our objective for this study was to establish background resistance profiles for waterhemp accessions collected in Texas to herbicides that have a history of use or are currently relied on for control of this weed in row-crop production.
Materials and Methods
Field Surveys
Field surveys were conducted during late summer of 2014 to 2016 to collect seed from waterhemp escapes in row-crop production fields in Texas, following a semistratified survey methodology previously used by Bagavathiannan and Norsworthy (Reference Bagavathiannan and Norsworthy2016). To obtain a representative sampling across important row-crop production areas across Texas, the survey was focused on five distinct regions: High Plains, Central Texas, Rio Grande valley, Gulf Coast (upper and lower), and Blacklands regions (Figure 1). The survey sites (i.e., row-crop fields) for each region were selected randomly on a Google® map using the ITN Converter software (version 1.88; Benichou Software) with a separation distance of approximately 3 km between the sites. The route information was uploaded to a global positioning system device (TomTom International BV, Amsterdam, the Netherlands) to navigate to the survey sites. At each site, waterhemp seed heads were collected from approximately 15 randomly selected female plants. The coordinates of the actual sites where the plant samples were collected were recorded using a Garmin etrex® 10 handheld system (Garmin International Inc., Olathe, KS). The collected seed heads were oven dried at 50 C for 72 h. Seed heads were mechanically thrashed, cleaned, and seeds were stored in glass vials at room temperature (25 C) prior to herbicide screenings. A total of 160 waterhemp accessions were collected during the surveys, of which 127 were selected for conducting herbicide screenings, based on seed availability and germinability.
Germination tests were conducted on the collected accessions by placing 50 seeds accession−1 in a Petri dish (9-cm diameter) containing a filter paper (Whatman No. 1, GE Healthcare, Chicago, IL), replicated twice, moistened with 6 mL of deionized water, and incubated in the dark in a growth chamber at day/night temperatures of 30/28 C for 12 d. Initial germination tests revealed a significant level of seed dormancy in waterhemp. A cold treatment at −20 C for 21 d followed by storage at room temperature for 7 d was effective in breaking dormancy and improving seed germination.
Subregions of Texas where the survey for waterhemp was conducted in this study.

Herbicide Assays
The herbicide assays were conducted at the Norman Borlaug Center for Southern Crop Improvement Greenhouse Research Facility located at Texas A&M University, College Station, TX. The samples were screened for five different herbicides with distinct sites of action (SOAs): glyphosate (EPSPS inhibitor), atrazine (PSII inhibitor), pyrithiobac (ALS inhibitor), tembotrione (HPPD inhibitor), fomesafen (PPO inhibitor), and dicamba (synthetic auxin) (Table 1). All herbicides were applied POST. However, accessions that showed resistance to POST applications of atrazine, tembotrione, or fomesafen were subsequently screened with PRE applications.
Details of the herbicides used in the evaluations.

a Abbreviations: AMS, ammonium sulfate; COC, crop oil concentrate; EPSPS, 5-enolpyruvylshikimate-3-phosphate synthase; HPPD, 4-hydroxyphenylpyruvate dioxygenase; MSO, methylated seed oil; NIS, nonionic surfactant; PPO, protoporphyrinogen oxidase; PSII, photosystem II
b No adjuvants were used for PRE treatments.
Herbicide evaluations were conducted using plastic growth trays filled with potting soil mix (LC1 Sunshine mix, Sungro® Horticulture, Agawam, MA) for POST applications and with field soil collected from a Texas A&M research farm near Snook, TX, for PRE applications. For each treatment, two replications and two experimental runs were established. Known susceptible standards as well as nontreated checks were maintained alongside for comparison.
The seeds were directly planted in growth trays and thinned at the one-leaf stage to provide a uniform density of approximately 30 seedlings in 25 × 25 cm trays (run 1) or 15 seedlings in 13 × 13 cm trays (run 2) for POST treatments. Seedlings were raised in the greenhouse under 30/26 C day/night temperature regime and 14 h photoperiod. Across the two replications and two runs, a total of 90 seedlings of each accession were screened. For PRE applications, 35 (25 × 25 cm trays) and 15 seeds (13 × 13 cm trays) were planted for runs 1 and 2, respectively. A nontreated check was maintained for each accession to determine reduction in emergence as a result of herbicide application.
Herbicides were applied at label recommended rates (Table 1) using a spray chamber mounted with a TeeJet XR80015 nozzle (TeeJet Technologies, Ord, NE) calibrated to deliver 140 L ha−1 of spray liquid at a speed of 4.8 km h−1 and a pressure of 276 kPa. The herbicide treatments were applied immediately after planting (PRE treatments) or at the 2- to 3-leaf seedling stage (POST treatments). PRE treatments were applied to the soil surface and trays were watered within 3 h after application to activate the herbicide treatments. Observations were carried out 21 d after treatment (DAT) of herbicide to document seedling survival and injury on survivors. Treated plants were kept until 40 DAT to confirm survival and regrowth. Plants that recovered from herbicide injury were considered survivors. Survival frequency was documented as the number of seedlings surviving herbicide applications divided by the total number of treated seedlings. The frequency of survival indicates the stage of evolution of resistance in a given production field (Neve and Powles Reference Neve and Powles2005). Accessions with greater than 50% survival indicate that more than half of the individuals in the accession are already resistant and that resistance is highly noticeable in the field. Injury ratings were recorded on a scale of 0% to 100% (0 = no visible injury compared with nontreated control; 100 = plant death). Accessions with 90% injury or greater at 21 DAT generally died at 40 DAT; thus, they were considered susceptible or nonresistant. The accessions that survived the treatments were categorized into two groups on the basis of the level of injury documented on the survivors (resistant: 0% to 49% injury; less sensitive: 50% to 89%).
Dose-Response Assays
Dose-response assays were conducted on the most-resistant accession for each herbicide, selected on the basis of high survival frequency and low injury level recorded during the initial screening. The herbicide doses used were 0.062, 0.125, 0.25, 0.5, 1, 2, and 4X the field-recommended rate for the susceptible accessions, and 0.5, 1, 2, 4, 8, 16, and 32X rates for the putative resistant accessions. For PRE treatments, 20 seeds were planted in 13- × 13-cm trays containing field soil and herbicides were applied and activated immediately after planting. The plants for POST treatments were established using potting soil media in six-cell growth trays with a single healthy seedling in each cell. Postemergence herbicide applications were made at the 2- to 3-leaf seedling stage. For each treatment, four replications and three experimental runs were conducted. All applications were made using a track sprayer, as mentioned earlier. Weed response to herbicide applications (percent survival and percent injury) was evaluated 21 DAT, as described previously.
Statistical Analyses
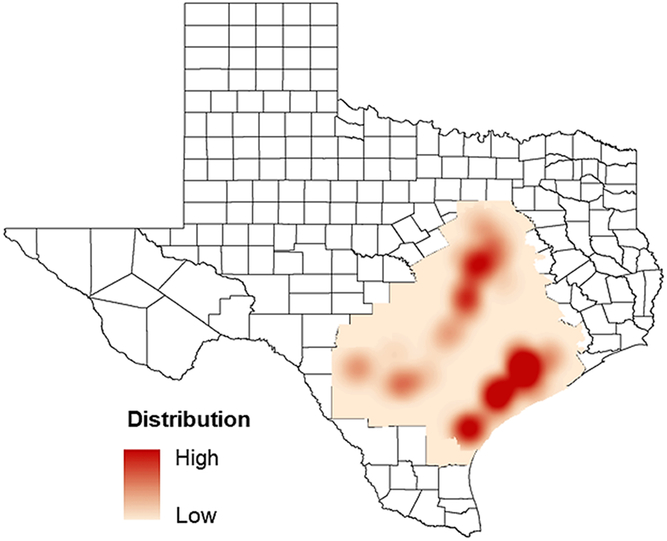
Spatial maps were developed using ArcGIS (version 10.5; ESRI, Redlands, CA) to illustrate spatial distribution of waterhemp sensitivity to various herbicides across Texas, based on the 160 survey sites. The distribution densities of the species across Texas according to kernel density analysis are shown in Figure 2. Furthermore, the distribution of waterhemp sensitivity to herbicides across a spatial scale was predicted using the inverse distance weighted method of interpolation in ArcGIS. This method estimated cell values by averaging the values of sample data points in the neighborhood of each processing cell (size = 1.5 × 1.5 km). The stretching technique was used for minimum and maximum range of injury and survival ratings. Spatial analysis for herbicide sensitivity was performed on waterhemp accessions from 127 sites that were used in herbicide evaluations. In cases where an accession was not included in the herbicide screening or data were missing, software default settings treated that accession as susceptible for corresponding herbicide and mapped in green. The spatial maps on herbicide sensitivity show (A) the level of accession-level injury to the given herbicide and (B) the frequency of survivors in a given accession, indicating the stage of evolution of resistance within the accession (i.e., resistance is easily noticeable in a field under advanced stages of evolution).
Distribution gradient of waterhemp across regions of Texas based on 160 sites of waterhemp occurrence. Waterhemp infestation was observed only in the Blacklands and Gulf Coast regions (highlighted on the map). Dark red represents areas with high infestation (≥20% of the field area) of waterhemp, whereas light-shaded areas represent areas with low distribution of the species (0% to 20%).
For dose response, a three-parameter logistic regression equation [1] provided the best fit for the survival data:
 $${\rm{Y}} = {\rm{c}}/[1 + {e^{\left\{ - a(x - b)\right\}}}]$$
where, Y is the survival (%), a is the slope of the curve, b is the inflection point, c is the lower asymptote, and x is the herbicide dose.
The regression equations developed using SigmaPlot, version 14 (Systat Software, Inc., San Jose, CA) were used to calculate the amount of herbicide that caused 50% mortality of the test accession (LD50). The LD50 value of the resistant accession divided by the LD50 of the susceptible standard provided the resistance ratio (R/S) values.
Results and Discussion
Regional Distribution of Waterhemp in Texas
Waterhemp is widely distributed in the Gulf Coast region (primarily in the upper Gulf Coast and somewhat in the lower Gulf Coast) as well as the Blacklands regions, with less frequent occurrence in the Central Texas region. However, this species was not found in the survey of High Plains and Rio Grande Valley regions (Figure 2). These regions were dominated by Palmer amaranth infestations, whereas limited Palmer amaranth occurrence was observed in the Blacklands region and none in the upper Gulf Coast region (Figure 2). Waterhemp and Palmer amaranth co-occurred in a narrow geographical range in the lower Gulf Coast and Central Texas regions (data not shown). Outside of this area, these two species have exhibited distinct regional domination within Texas. It appears that waterhemp has a specific ecological niche and adaptation within the diverse environmental conditions of Texas. Waterhemp generally prefers moist, wet environments (Nordby et al. Reference Nordby, Hartzler and Bradley2007), which is common to Southeast Texas. This region is often characterized by high rainfall (>100 cm yr−1) and wet conditions, which may explain the dominance of waterhemp in this geography. The distribution of waterhemp observed in this survey is also consistent with previous reports (Light et al. Reference Light, Mohammed, Dotray, Chandler and Wright2011; Watson Reference Watson2017). Because no waterhemp accessions were observed in the Rio Grande Valley or the High Plains region during this survey, the resistance profiling only includes the accessions obtained from the Blacklands and Gulf Coast regions.
Response to Glyphosate
Of the 112 waterhemp accessions evaluated for glyphosate, 27% were resistant and 20% were less sensitive to this herbicide regardless of the region (Figure 3; Table 2), illustrating the prevalence of inadequate waterhemp control with glyphosate. The Gulf Coast region had 46% resistant and 28% less-sensitive accessions, whereas the Blacklands region had 9% and 12% accessions that were resistant and less sensitive, respectively (Table 2). The high frequency of glyphosate-resistant waterhemp observed in these regions is due to heavy reliance on glyphosate for weed control in glyphosate-resistant (Roundup Ready®) crops since the mid-1990s. The Gulf Coast region represents intensive row-crop cultivation where the use of glyphosate has been frequent, whereas common cropping systems in the Blacklands region include winter wheat fallow or winter wheat followed by corn, cotton, or grain sorghum, and glyphosate use frequency is relatively lower in this region.
Regional-scale distribution of waterhemp response to glyphosate based on (a) injury and (b) frequency of survivors. Resistance levels: resistant, 0% to 49% injury; less sensitive, 50% to 89% injury; susceptible, 90% to 100% injury. Frequency of survival indicates the stage of evolution of resistance in a given production field. For instance, 50% survival indicates approximately half of the individuals in the accession are already resistant and that resistance is highly noticeable in the field.

Herbicide resistance profile of the waterhemp accessions evaluated from two subregions of Texas at the recommended field-use rate.

a Waterhemp seedlings were treated at two- to three-leaf stage (10-cm height).
b Resistance profiling was conducted on the basis of injury data; resistant: 0% to 49% injury; less sensitive: 50% to 89% injury; susceptible: 90% to 100% injury.
c Total number of accessions evaluated for each herbicide in each region.
d Number of accessions under different resistance categories for each herbicide in each region.
The dose-response assay for the most glyphosate-resistant waterhemp accession (TX-25) indicated 17-fold resistance compared with a susceptible standard (TX-15) (Figure 4a; Table 3). The waterhemp accession evaluated by Legleiter and Bradley (Reference Legleiter and Bradley2008) in Missouri had 19-fold resistance compared with a susceptible standard. Sarangi et al. (Reference Sarangi, Sandell, Knezevic, Aulakh, Lindquist, Irmak and Jhala2015) showed 3- to 39-fold glyphosate resistance in different waterhemp accessions originating from Nebraska. Likewise, 1- to 9-fold resistance to glyphosate has been reported in waterhemp accessions collected from Illinois, Iowa, and Missouri (Smith and Hallett Reference Smith and Hallett2006). Most of the glyphosate-resistant waterhemp accessions from other states have been reported in Roundup-Ready® soybean cropping systems, which have seen tremendous increase in glyphosate use in the past 15 yr (Benbrook Reference Benbrook2016). In Texas, the trend in glyphosate use has been similar, but glyphosate-resistant waterhemp biotypes have evolved mainly in Roundup Ready® corn- and cotton-dominated regions.
Dose-response analysis of resistant or less sensitive (specifically pertains to tembotrione and dicamba) and susceptible Palmer amaranth accessions for (A) glyphosate, (B) atrazine (PRE), (C) atrazine (POST), (D) pyrithiobac, (E) dicamba, and (F) tembotrione (POST). Dashed line represents 50% survival rates for corresponding LD50 values (i.e., amount of herbicide that caused 50% mortality of the test accession) on a logarithmic scale.

LD50 values and resistance ratios for the resistant/least sensitive waterhemp accessions surveyed across Texas.

a Abbreviations: RMSE, root means square error; R/S, resistance ratio.
b LD 50 is the herbicide rate (g ae ha−1 for glyphosate and dicamba; g ai ha−1 for other herbicides) that caused 50% plant death at 21 d after treatment.
c Calculated on the basis of the LD50 values of the resistant or least sensitive (for dicamba and tembotrione) accession relative to the susceptible standard.
d This accession did not survive 2X the field rate POST or 1X the field rate PRE.
e These accessions were considered to exhibit reduced sensitivity, on the basis of the low R/S ratio.
Response to Atrazine
A total of 109 waterhemp accessions were tested with atrazine. Several Gulf Coast waterhemp accessions exhibited resistance or reduced sensitivity to atrazine applied POST. Of the 55 accessions evaluated from this region, 15% were resistant and 27% were less sensitive to atrazine POST (Figure 5; Table 2). The Gulf Coast region is characterized by intensive corn and grain sorghum production where atrazine has been frequently used for weed control for many years. However, atrazine resistance is relatively less prevalent in the waterhemp accessions collected in the Blacklands region, because of the use of more diverse cropping systems and lesser selection pressure, compared with that of the Gulf Coast region.
Regional-scale distribution of waterhemp sensitivity to atrazine (applied POST) based on (a) injury and (b) frequency of survivors. Resistance levels: resistant, 0% to 49% injury; less sensitive, 50% to 89% injury; susceptible, 90% to 100% injury. Frequency of survival indicates the stage of evolution of resistance in a given production field. For instance, 50% survival indicates approximately half of the individuals in the accession are already resistant and that resistance is highly noticeable in the field.
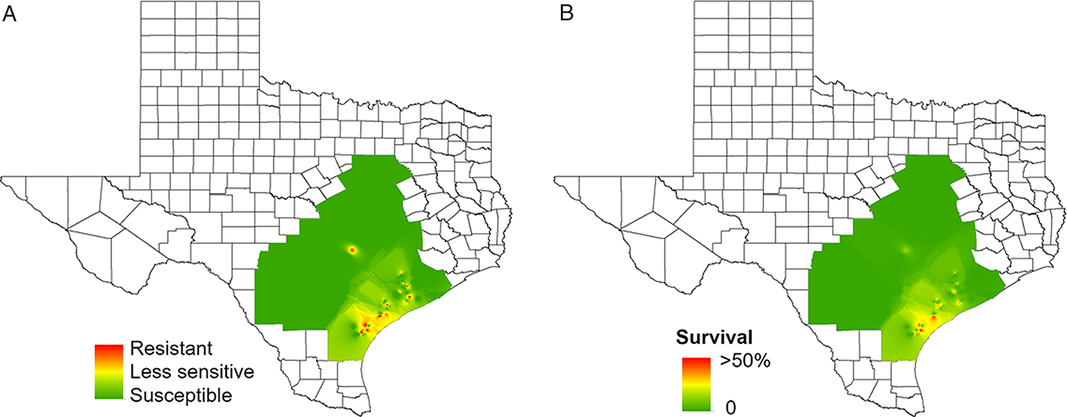
To our knowledge, the present study is the first report of atrazine resistance in waterhemp in Texas. However, atrazine-resistant waterhemp accessions have been documented previously in Illinois, Iowa, Kansas, and Missouri (Heap Reference Heap2019). Atrazine has been used commonly in corn and grain sorghum production for controlling waterhemp and other summer annual weeds. Cost-effectiveness and prolonged broad-spectrum weed control have made atrazine a reliable POST tank-mix partner with several other herbicides (Abendroth et al. Reference Abendroth, Martin and Roeth2006; Armel et al. Reference Armel, Hall, Wilson and Cullen2005; Johnson et al. Reference Johnson, Young and Matthews2002). Given this importance, resistance to atrazine reduces weed control options, especially in grain sorghum.
The dose-response bioassay of the most atrazine (POST)-resistant waterhemp accession (TX-31) from the current survey revealed 47-fold resistance compared with a susceptible standard (TX- 15) (Figure 4c; Table 3). The TX-31 accession was not controlled even at the highest rate tested (32X). Foes et al. (Reference Foes, Liu, Tranel, Wax and Stoller1998) reported 185-fold resistance to atrazine in a waterhemp accession; a concentration greater than 20 kg ha−1 of this herbicide was required to inhibit plant growth by 50%. The accession TX-31 was also resistant to PRE applications of atrazine. The dose-response assay with atrazine PRE indicated TX-31 was 68-fold less sensitive to atrazine (PRE) compared with the susceptible standard (Figure 4b; Table 3). The LD50 of this highly resistant accession was nearly half when atrazine was applied PRE compared with POST. Similar results have been reported where PRE applications of atrazine were more effective than POST applications for controlling waterhemp (Ma et al. Reference Ma, Evans and Riechers2016; Vennapusa et al. Reference Vennapusa, Faleco, Vieira, Samuelson, Kruger, Werle and Jugulam2018). A waterhemp accession from Illinois was resistant to atrazine POST but susceptible to atrazine PRE (Ma et al. Reference Ma, Evans and Riechers2016). This accession had a nontarget site resistance mechanism whereby elevated rates of atrazine metabolism via glutathione-S-transferase activity contributed to atrazine POST resistance; however, it is not known whether the target-site resistance mechanism would also show differential response between PRE and POST atrazine applications. The atrazine-resistant accession in the current study may have either or both the target and nontarget and site resistance mechanisms, but no molecular analysis was conducted as a part of this study.
Response to Pyrithiobac
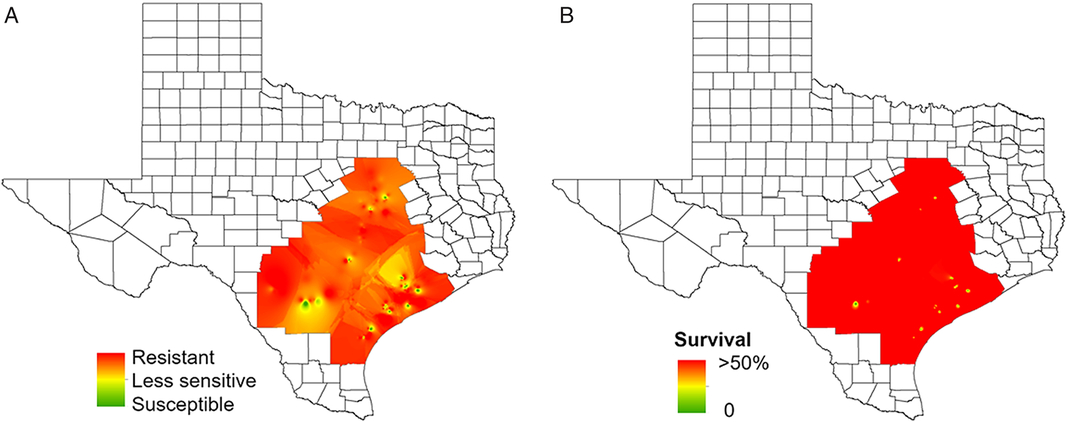
Of the 122 waterhemp accessions tested with pyrithiobac, most of those from the Blacklands and Gulf Coast regions were resistant (POST applications) (Figure 6; Table 2). In the Blacklands region, 60% of the accessions were resistant, 33% were less sensitive, and only 7% were susceptible to pyrithiobac. In the Gulf Coast region, 83% of the waterhemp accessions were resistant, 5% were less sensitive, and 12% were susceptible to this herbicide. The dose-response assay (POST) for an accession with the greatest resistance to pyrithiobac (TX-27) exhibited 61-fold resistance compared with the susceptible standard (TX-52) (Figure 4d; Table 3). In Kansas, an ALS inhibitor–resistant waterhemp accession showed cross-resistance to imazethapyr, chlorimuron-ethyl, and thifensulfuron-methyl with 130-, 330-, and 490-fold resistance, respectively (Lovell et al. Reference Lovell, Wax, Horak and Peterson1996). Likewise, a waterhemp accession from Illinois was 17,000-fold resistant to imazamox and 18,000-fold resistant to thifensulfuron (Patzoldt et al. Reference Patzoldt, Tranel and Hager2005). However, cross-resistance status of the Texas accessions was not investigated in this research. Weed resistance to ALS-inhibitor herbicides has become so common that the use of ALS inhibitors is no longer recommended to control waterhemp in Illinois (Hager et al. Reference Hager, Wax, Bollero and Stoller2003; Sprague et al. Reference Sprague, Stoller, Wax and Horak1997). Results from this survey illustrate a similar scenario to what we have observed in Texas, where the ALS-inhibitor herbicides are largely ineffective in controlling waterhemp.
Regional-scale distribution of waterhemp sensitivity to pyrithiobac based on (a) injury and (b) frequency of survivors. Resistance levels: resistant, 0% to 49% injury; less sensitive, 50% to 89% injury; susceptible, 90% to 100% injury. Frequency of survival indicates the stage of evolution of resistance in a given production field. For instance, 50% survival indicates approximately half of the individuals in the accession are already resistant and that resistance is highly noticeable in the field.
Response to Fomesafen
No resistance to fomesafen (a PPO inhibitor) was observed in waterhemp accessions evaluated in this study. However, one accession from the Blacklands region showed a few survivors (approximately 90% injury) for the 1X rate at 21 DAT, but those later died (Table 2). Although resistance was not identified in this study, the continued reliance on PPO-inhibiting herbicides will likely lead to resistance as has occurred in waterhemp accessions from soybean-producing areas in other states (Heap Reference Heap2019; Patzoldt et al. Reference Patzoldt, Tranel and Hager2005; Shoup et al. Reference Shoup, Al-Khatib and Peterson2003). The first case of PPO-inhibitor resistant waterhemp was documented in Kansas in 2000 (Shoup et al. Reference Shoup, Al-Khatib and Peterson2003). This accession had 34-, 82-, 8-, and 4-fold resistance compared with a susceptible standard for acifluorfen, lactofen, fomesafen, and sulfentrazone, respectively. In Illinois, a waterhemp accession was resistant to three different herbicide families that inhibit the PPO enzyme, which include diphenylethers (namely, acifluorfen, fomesafen, and lactofen), N-phenyl-phthalimides (namely, flumiclorac and flumioxazin), and triazolinone (sulfentrazone) (Patzoldt et al. Reference Patzoldt, Tranel and Hager2005). The levels of resistance varied between 2.2- and 6.2-fold compared with a susceptible standard, except for lactofen, to which 23-fold resistance was observed (Patzoldt et al. Reference Patzoldt, Tranel and Hager2005). Resistance to PPO inhibitors is becoming a widespread phenomenon in this species in other regions, and appropriate management efforts will be critical to prevent the evolution of waterhemp resistance to PPO inhibitors in Texas.
Response to Tembotrione
The HPPD-inhibiting herbicides are among the few alternative herbicides available for the control of glyphosate- and atrazine-resistant Amaranthus spp. in corn fields (Sutton et al. Reference Sutton, Richards, Buren and Glasgow2002). The HPPD-inhibiting herbicides tembotrione and mesotrione are currently used extensively in corn production because of their broad-spectrum weed control activity and crop tolerance (Bollman et al. Reference Bollman, Boerboom, Becker and Fritz2008). In the current survey, several accessions showed reduced sensitivity to tembotrione POST, and there appears to be a trend of reduced sensitivity to this herbicide in accessions that are resistant to atrazine (Figures 5 and 7). McMullan and Green (Reference McMullan and Green2011) reported that resistance to atrazine can contribute to the evolution of resistance to HPPD-inhibiting herbicides. Atrazine and HPPD-inhibiting herbicides are commonly applied together, and resistance to atrazine typically increases the intensity of selection pressure exerted by the HPPD inhibitors. In the current study, a high frequency of survivors was observed in accessions collected from the Gulf Coast region. Approximately 38% of the accessions from this region were less sensitive to tembotrione POST (Figure 7; Table 2). However, these accessions were completely controlled at the 1X rate of tembotrione when applied PRE. The dose-response assay of the least-sensitive accession (TX-48) to POST application indicated that accession was 2.4-fold less sensitive compared with the susceptible standard (TX-57) (Figure 4f; Table 3). Overall, results showed high variability in tolerance to tembotrione among the tested accessions.
Regional-scale distribution of waterhemp sensitivity to tembotrione based on (a) injury and (b) frequency of survivors. Resistance levels: resistant, 0% to 49% injury; less sensitive, 50% to 89% injury; susceptible, 90% to 100% injury. Frequency of survival indicates the stage of evolution of resistance in a given production field. Nearly 38% of the accessions of Gulf Coast had individuals surviving tembotrione application with 64% to 88% injury.
Response to Dicamba
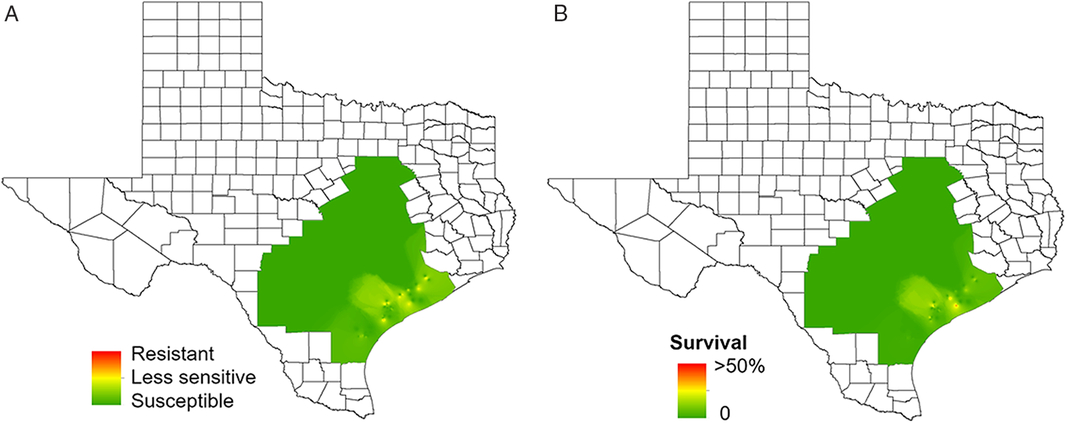
None of the waterhemp accessions tested (N = 122) in this study was resistant to dicamba (Figure 8; Table 2). Both the 0.5X (284 g ae ha−1) and 1X (560 g ae ha−1) rates completely controlled susceptible standards used in the study. However, some accessions showed reduced sensitivity to dicamba at both rates. At the 0.5X rate, 16% and 58% of the accessions from the Blacklands and Gulf Coast regions, respectively, had individuals that survived dicamba applications with injuries ranging from 68% to 89% (Figure 8; Table 2), and the frequency of survival ranged from 8% to 40%. The response to the 0.5X rate indicated the presence of wide, inherent variability in tolerance to dicamba, which can facilitate increased tolerance in subsequent generations through the accumulation of minor alleles (Tehranchian et al. Reference Tehranchian, Norsworthy, Powles, Bararpour, Bagavathiannan, Barber and Scott2017). At the 1X rate, 11% of the Gulf Coast accessions had individuals that survived dicamba application. These plants showed 79% to 89% injury, but later recovered from the injury. It is likely that these surviving accessions had previous exposure to auxin herbicides such as 2,4-D and dicamba, which are commonly used for burndown weed control in this region.
Regional-scale distribution of waterhemp sensitivity to dicamba based on (a) injury and (b) frequency of survivors. Resistance levels: resistant, 0% to 49% injury; less sensitive, 50% to 89% injury; susceptible, 90% to 100% injury. Based on the scoring scale, 11% of the Gulf Coast accessions had a few individuals that survived dicamba applications 21 d after treatment, though injury ranged from 79% to 89%.
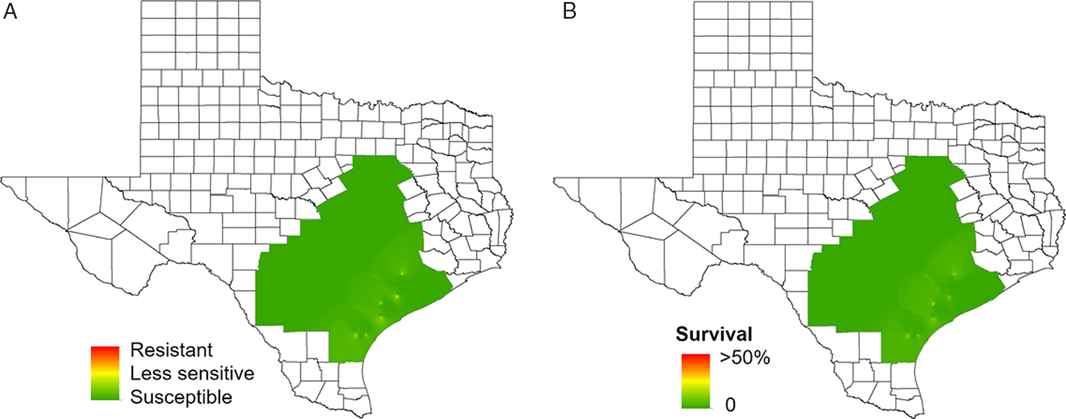
The dose-response assay for the accession with the least sensitivity (TX-27) had survivors at the 1X rate (560 g ae ha−1), but complete death was observed at the 2X or greater rates. Based on the LD50 values, TX-27 was 2.2-fold less sensitive to dicamba compared with the susceptible standard (Figure 4e; Table 3). To date, only three cases of synthetic auxin (2,4-D)-resistance have been documented in waterhemp (Bernards et al. Reference Bernards, Crespo, Kruger, Gaussoin and Tranel2012; Evans Reference Evans2016; Shergill et al. Reference Shergill, Barlow, Bish and Bradley2018), but weed resistance to synthetic auxin herbicides is not uncommon. For instance, auxin resistance has been reported in weeds such as kochia [Bassia scoparia (L.) A.J. Scott] (Varanasi et al. Reference Varanasi, Godar, Currie, Dille, Thompson, Stahlman and Jugulam2015), wild radish (Raphanus raphanistrum L.) (Walsh et al. Reference Walsh, Powles, Beard, Parkin and Porter2004), wild mustard (Sinapis arvensis L.), prickly lettuce (Lactuca serriola L.) (Burke et al. Reference Burke, Yenish, Pittman and Gallagher2009), and fiveangle fimbry [Fimbristylis miliacea (L.) Vahl] (Karim et al. Reference Karim, Man and Sahid2004). Recently, a Palmer amaranth accession from Tennessee, that was already resistant to glyphosate and PPO inhibitors, showed inconsistent control with dicamba (Steckel Reference Steckel2017). Furthermore, surveys conducted in Texas revealed low frequency of survival to dicamba treatment in some Palmer amaranth accessions at field application rates (Garetson et al. Reference Garetson, Singh, Singh, Dotray and Bagavathiannan2019). Potential reduction in sensitivity to synthetic auxin herbicides is a serious concern because it could affect the sustainability of the auxin-tolerant crop traits. Proper stewardship of these new technologies is critical to maintain their effectiveness.
Multiple Herbicide Resistance/Reduced Sensitivity
Resistance to two or more herbicide SOAs was observed in the waterhemp accessions evaluated in this survey, especially in the Gulf Coast region. Waterhemp seedlings survived (resistant or less sensitive) 17 different combinations of five herbicide SOAs (Table 4). Twenty-three of the 30 glyphosate-resistant accessions were resistant to at least one other herbicide SOA. Twenty-one of them were resistant to the ALS inhibitor pyrithiobac, two were resistant to the PSII inhibitor atrazine, three were less sensitive to the HPPD inhibitor tembotrione, and two were less sensitive to the synthetic-auxin herbicide dicamba. One accession exhibited three-way multiple herbicide resistance (0% to 49% injury) to EPSPS, ALS, and PSII inhibitors (Table 4). At least two accessions exhibited multiple resistance/reduced sensitivity to all five SOAs tested in the study. However, all the evaluated accessions were sensitive to the PPO inhibitor fomesafen. This is probably because of the infrequent use of PPO inhibitors in the major cropping systems practiced in the region, including cotton, corn, grain sorghum, and soybean. Overall, the level of multiple resistance observed in this study is alarming and clearly highlights the deficiencies with current herbicide use practices.
Multiple herbicide resistance/reduced sensitivity in waterhemp accessions surveyed across Texas.

a Abbreviations: ALS, acetolactate synthase; EPSPS, 5-enolpyruvylshikimate-3-phosphtae synthase; HPPD, 4-hydroxyphenylpyruvate dioxygenase; PSII, photosystem II; SOA, site of action.
b Percentage was calculated on the basis of total accessions tested for respective multiple SOA combinations and rounded to a nearest whole number.
c Accessions with resistance to respective herbicides (0% to 49% injury).
d Accessions with resistance (0% to 89% injury) to EPSPS-, ALS-, and/or PSII-inhibiting herbicides, and less sensitivity (50% to 89%) involving tembotrione (HPPD inhibitor) and/or dicamba (synthetic auxin).
e All instances of “auxin” refer to synthetic auxin.
In conclusion, current research shows that herbicide resistance is prevalent in waterhemp accessions infesting row-crop production systems in Texas, especially in the Gulf Coast region. In particular, multiple resistance to glyphosate and atrazine is common, indicating that these two herbicides are largely ineffective for waterhemp control in this region. There is also high variability for response to the HPPD inhibitor tembotrione and the synthetic-auxin herbicide dicamba. This indicates high likelihood for resistance to these herbicides if sufficient management diversity is not included. The finding of no resistance to the PPO inhibitor fomesafen is encouraging, but farmers should judiciously use this herbicide group in resistance management programs. Considering the evidence of multiple herbicide resistances involving HPPD inhibitors, PPO inhibitors, and synthetic auxins in other production systems elsewhere, it is only a matter of time before these currently effective tools become ineffective, unless growers adopt diversified management practices. It is imperative that growers and weed management practitioners understand the importance of proactive tactics for herbicide-resistance management (Norsworthy et al. Reference Norsworthy, Ward, Shaw, Llewellyn, Nichols, Webster, Bradley, Frisvold, Powles, Burgos and Witt2012) and prolong the utility of available herbicide options. In this study, we established a baseline resistance profile for important herbicides in waterhemp accessions infesting row-crop production in Texas, which is valuable for creating awareness among stakeholders regarding herbicide-resistance evolution and management.
Acknowledgements
The authors acknowledge Shilpa Singh and Seth Abugho for providing assistance with greenhouse herbicide screening. Funding for this research was provided, in part, by the Texas Corn Producers Board, Texas State Cotton Support Committee, and Cotton Incorporated. The authors declare no conflicts of interest.



