


Concern over racial bias in policing, and the public availability of large administrative data sets documenting police–civilian interactions, have prompted a raft of studies attempting to quantify the effect of civilian race on law enforcement behavior. These studies consider a range of outcomes including ticketing, stop duration, searches, and the use of force (e.g., Antonovics and Knight Reference Antonovics and Knight2009; Fryer Reference Fryer2019; Ridgeway Reference Ridgeway2006; Nix et al. Reference Nix, Campbell, Byers and Alpert2017). Most research in this area attempts to adjust for omitted variables that may correlate with suspect race and the outcome of interest. In contrast, this study addresses a more fundamental problem that remains even if the vexing issue of omitted variable bias is solved: the inevitable statistical bias that results from studying racial discrimination using records that are themselves the product of racial discrimination (Angrist and Pischke Reference Angrist and Pischke2008; Elwert and Winship Reference Elwert and Winship2014; Rosenbaum Reference Rosenbaum1984). We show that when there is any racial discrimination in the decision to detain civilians—a decision that determines which encounters appear in police administrative data at all—then estimates of the effect of civilian race on subsequent police behavior are biased absent additional data and/or strong and untestable assumptions.
This study makes several contributions. We clarify the causal estimands of interest in the study of racially discriminatory policing—quantities that many studies appear to be targeting, but are rarely made explicit—and show that the conventional approach fails to recover any known causal quantity in reasonable settings. Next, we highlight implicit and highly implausible assumptions in prior work and derive the statistical bias when they are violated. We proceed to develop informative nonparametric sharp bounds for the range of possible race effects, apply these in a reanalysis and extension of a prominent article on police use of force (Fryer Reference Fryer2019), and present bias-corrected results that suggest this and similar studies drastically underestimate the level of racial bias in police–civilian interactions. Finally, we outline strategies for future data collection and research design that can mitigate these threats to inference. These are discussed in the context of a detailed and feasible proposed study of racial bias in traffic stops.
As we show in this article, the difficulty of estimating racial bias using police records stems from a thorny combination of mediation (Hernán, Hernández-Diáz, and Robins Reference Hernán, Hernández-Diáz and Robins2004; Imai et al. Reference Imai, Keele, Tingley and Yamamoto2011; Pearl Reference Pearl2001; Robins, Hernán, and Brumback Reference Robins, Hernán and Brumback2000; VanderWeele Reference VanderWeele2009) and selection (Heckman Reference Heckman1979; Lee Reference Lee2009): the effect of civilian race on the outcome of a police encounter is mediated by whether the civilian is stopped by police, but analysts only have data for one level of the mediator—that is, data on stopped individuals. Because of this, police records do not contain a representative sample of all individuals that police observe, but rather only those civilian encounters which escalated to the point of triggering a reporting requirement. If a civilian’s race affects whether officers choose to stop that civilian (Gelman, Fagan, and Kiss Reference Gelman, Fagan and Kiss2007; Glaser Reference Glaser2014), then analyzing administrative police records amounts to conditioning on a variable that is itself affected by suspect race, namely, whether a suspect appears in the data at all. This could occur if officers have a higher threshold for stopping white civilians during the unseen first stage of police–civilian contact, meaning that white civilians observed in the data are incomparable because they tend to pose a greater threat to police than observed minorities. These unobserved differences can lead analysts to understate anti-minority racial bias—or even produce the appearance of antiwhite bias—in the use of force. Despite claims to the contrary (Fryer Reference Fryer2018, 2), this statistical bias often cannot be eliminated with additional control variables, even if the goal is to estimate causal effects among the subset of police–civilian encounters that appear in police data. Moreover, the problem remains whether racial bias in detainment stems from so-called “taste-based” or “statistical” discrimination (Arrow Reference Arrow and Pascal1972, see below for extended discussion on this point).
At the first glance, the problem of race-based selection into policing data may appear a classic case of sample selection bias (Elwert and Winship Reference Elwert and Winship2014; Heckman Reference Heckman1979) for which numerous remedies already exist. But policing data exhibit a constellation of features that render previous methodological approaches unsuitable or unusable in this setting, leading prominent scholars in this area to declare that “it is unclear how to estimate the extent of such bias or how to address it statistically,” (Fryer Reference Fryer2018, 5).Footnote 1 For example, Heckman (Reference Heckman1979) and more recent extensions like Lee (Reference Lee2009) provide methods for estimating or bounding average treatment effects in the population while accounting for sample selection. But with only data on stopped individuals, policing scholars rarely seek to estimate population treatment effects, instead targeting effects among individuals who actually interact with police. We show that even without attempting to generalize to the broader population, the issues we raise result in biased estimates of the effect of race on police behavior even among encounters in which civilians are detained.
A related large literature provides remedies for so-called “post-treatment bias”—statistical bias that results from conditioning on a variable that is affected by the causal variable of interest (Rosenbaum Reference Rosenbaum1984). But implementation of these techniques requires either knowledge of the scale of the missing data (e.g., Nyhan, Skovron, and Titiunik Reference Nyhan, Skovron and Titiunik2017) or complete data on the posttreatment variable (e.g., Acharya, Blackwell, and Sen Reference Acharya, Blackwell and Sen2016).Footnote 2 In the case of policing, administrative data sets only include observations with one level of the posttreatment variable (i.e., data on stopped individuals) and give no purchase on the number of individuals police observe but do not stop, meaning these techniques cannot be applied. This scenario also differs from situations of “truncation by death” (Frangakis and Rubin Reference Frangakis and Rubin2002) in which receipt of a treatment causes sample attrition and renders outcomes for some portion of units undefined. In the policing setting, individuals not detained by police are absent from the data, but many outcomes of interest are often still defined (e.g., the level of force applied to nonstopped individuals is zero, a realized outcome). This feature allows us to identify additional causal quantities that cannot be recovered in the “truncation by death” setting. In short, existing methods offer either unusable or suboptimal solutions to this pernicious threat to inference, absent strong assumptions about the unseen process mapping civilian race to officers’ decisions to detain individuals.
Our analysis indicates that existing empirical work in this area is producing a misleading portrait of evidence as to the severity of racial bias in police behavior. Replicating and extending the study of police behavior in New York in Fryer (Reference Fryer2019), we show that the consequences of ignoring the selective process that generates police data are severe, leading analysts to dramatically underestimate or conceal entirely the differential police violence faced by civilians of color. For example, while a naïve analysis that assumes no race-based selection into the data suggests only 10,000 black and Hispanic civilians were handcuffed because of racial bias in New York City between 2003 and 2013, we estimate that the true number is approximately 56,000. And while analyses ignoring bias in stopping would conclude that 10% of uses of force against black and Hispanic civilians in these data were discriminatory, after bias-correction, we estimate that the true percentage is 39%.
While the techniques used to obtain our corrected results eliminate several facially implausible (and in some cases, empirically falsified) assumptions that are implicit in prior work, we caution that they nevertheless rely on weaker assumptions that in some cases are difficult to verify, as we discuss below. We seek to advance the study of racial bias in policing by explicitly stating these assumptions, discussing their plausibility in this context, and carefully grounding unobservable parameters—in particular, the proportion of racially discriminatory minority stops, which relates closely to the severity of the statistical bias—in prior research (Gelman, Fagan, and Kiss Reference Gelman, Fagan and Kiss2007; Goel, Rao, and Shroff Reference Goel, Rao and Shroff2016). We show that obtaining more precise bias-corrected estimates of racial discrimination in policing requires future research to be designed with this issue in mind. To that end, we outline a research design that alleviates these concerns. Our study also provides a general framework for analyzing the study of racial bias that can illuminate the causal interpretation of other longstanding tests for discrimination. For example, we show that under reasonable assumptions, so-called “outcome tests,” which compare the rates of finding evidence of criminal activity across detained suspects of different racial groups (Knowles, Perisco, and Todd Reference Knowles, Perisco and Todd2001), imply a lower bound on the share of racial minorities who are discriminatorily detained. Outcome tests also appear elsewhere in criminal justice studies, for example, in capital sentencing (Alesina and Ferrara Reference Alesina and La Ferrara2014) and bail decisions (Arnold, Dobbie, and Yang Reference Arnold, Dobbie and Yang2018). And as Ayres (Reference Ayres2002) and Simoiu, Corbett-Davies, and Goel (Reference Simoiu, Corbett-Davies and Goel2017) note, such tests have also been applied in a range of other social contexts, including financial lending and editorial decisions. By nesting the study of discrimination in a rigorous and general causal framework, our study can help synthesize results from a broad interdisciplinary literature on racial bias.
Our work also extends a growing literature in political science examining the political implications of law enforcement which, in recent decades, has largely studied policing indirectly, for example, as a means of explaining political participation (Burch Reference Burch2013; Cohen et al. Reference Cohen, Gunderson, Jackson, Zachary, Clark, Glynn and Leo Owens2017; Lerman and Weaver Reference Lerman and Weaver2014; White Reference White2019) or as an instance of bureaucracy (Brehm and Gates Reference Brehm and Gates1999; Lipsky Reference Lipsky1980; Ostrom and Whitaker Reference Ostrom and Whitaker1973; Wilson Reference Wilson1989). This work is path breaking, but with some recent exceptions (Harvey and Mungan Reference Harvey and Mungan2019; Magaloni, Franco, and Melo Reference Magaloni, Franco and Melo2015; Mummolo Reference Mummolo2018a; Peyton et al. Reference Peyton, Sierra-Arévalo and Rand2019; Soss and Weaver Reference Soss and Weaver2017), has tended to conceptualize policing as a cause of politics, rather than a political act in and of itself. The field’s relative inattention to policing was made evident by several recent officer-involved shootings of unarmed black men (Edwards, Lee, and Esposito Reference Edwards, Lee and Esposito2019) and subsequent social unrest that caught many political scientists flatfooted, with little systematic evidence to offer as the demand for explanations of police behavior surged. As Soss and Weaver (Reference Soss and Weaver2017) note, the field’s limited store of relevant knowledge in the aftermath of these events was especially glaring given law enforcement’s role as an everyday conduit of state power. According to one often-cited definition, politics is “who gets what, when, how” (Lasswell Reference Lasswell1936). As a matter of routine, the dynamics of police-civilian interactions determine who gets protected, punished, or left to fend for themselves (Wilson Reference Wilson1968). Viewed in this way, the role of race in the state’s exercise of violence, as well as in the provision of safety more broadly, is inherently political (Alexander Reference Alexander2010; Gottschalk Reference Gottschalk2008; Key Reference Key1949). In addition to offering a rigorous analytic framework to help researchers contend with longstanding methodological hurdles, our study also underscores an often overlooked truth: policing is high-stakes politics.
CONCEPTUALIZING RACE AS A CAUSAL VARIABLE
We regard the investigation of racial bias in policing as an inherently causal inquiry, albeit a notoriously difficult one. That is, researchers seek to assess whether police behavior during police–civilian encounters would have differed if the civilian had belonged to another racial group, holding constant civilian behavior and circumstances. As noted in Fryer (Reference Fryer2018), this “‘race effect’…is the proverbial ‘holy grail’—the parameter that we are all attempting to estimate but never quite do” (2). This task is distinct from the descriptive enterprise of merely documenting differential police behavior during encounters with various groups, as such disparities can arise via numerous processes that do not imply racial discrimination.Footnote 3
The notion of a “causal effect of race” on an individual’s outcome is the subject of much contention in the literature on causal inference (Hernán Reference Hernán2016; Pearl Reference Pearl2018). Most notably, some have argued that this effect is undefined because race is an immutable, and hence nonmanipulable, characteristic (Holland Reference Holland1986). Others argue that an individual’s race is a complex, multifaceted treatment—a “bundle of sticks,” in the words of Sen and Wasow (Reference Sen and Wasow2016)—that affects outcomes through myriad channels, and therefore, researchers must be precise about the specific facets of race under consideration (Greiner and Rubin Reference Greiner and Rubin2011).
Our analysis avoids this debate by focusing on police–civilian encounters—that is, sightings of civilians by police—as the unit of analysis, rather than individuals. The manipulation of race is conceptualized as the counterfactual substitution of an individual with a different racial identity into the encounter, while holding the encounter’s objective context—location, time of day, criminal activity, etc.—fixed. In other words, the “treatment” in this case is the entire “bundle of sticks” encapsulating the race of the civilian—including, for example, skin tone, dialect, and clothing. We note that the credibility of causal inferences and the exact interpretation of racial discrimination in this framework will depend crucially on how the analyst defines “race.” We leave the specific operationalization in a given context to the analyst, and, in line with advice in Sen and Wasow (Reference Sen and Wasow2016), encourage scholars to carefully convey their conceptualization of race when studying this and related questions.Footnote 4
By conceptualizing the treatment in this way, we avoid consideration of the perhaps implausible counterfactual of holding all features of an individual constant but for their race. While various aspects of racial identity and its close correlates may not be separable in the observed world, there exists a subset of comparable situations in which minority and majority civilians are observed by police. If this subset can be identified, or approximated through covariate adjustment, we can estimate the counterfactual police behavior that would have occurred had the civilian in question been replaced with a member of another racial group.
While our approach considers a valid counterfactual and isolates racial discrimination that occurs during police–civilian encounters, it necessarily mutes the influence of pre-encounter macroinstitutional factors, such as decisions to deploy more officers to communities of color. In keeping with the goals of prior studies in this area, our approach holds such contextual features constant, allowing us to ask whether an encounter would have unfolded differently had it involved a civilian of differing race. But even if no such difference exists within encounters, law enforcement strategies adopted before encounters occur could still produce racially biased policing. We caution readers to keep this scope condition in mind.
PRIOR RESEARCH ON RACIAL BIAS IN POLICING
Race-based selection into policing data has been previously noted, and some scholars have devised research designs in an attempt to sidestep this issue. Grogger and Ridgeway (Reference Grogger and Ridgeway2006), for example, leverage the so-called “veil of darkness” strategy, comparing patterns in traffic stops that occur before and after sunset under the logic that the race of the driver is plausibly hidden to police officers after dark. In this way, the study aims to identify a sample of police–civilian interactions that were initiated in a race-blind manner. Similarly, West (Reference West2018) examines data on police responses to traffic incidents, arguing that whether a co-racial officer responds to a motorist’s unanticipated accident is as-if random. If the assumptions in these studies hold, concerns over race-based sample selection are greatly alleviated.
These attempts to mitigate race-based selection remain rare, as most empirical studies in this literature focus nearly exclusively on mitigating the more familiar problem of omitted variable bias. For example, Fryer (Reference Fryer2019) (detailed below), a study of racial bias in police violence, estimates discrimination using data on police–civilian encounters via multivariate regressions that control for a host of observables relating to civilians, officers, and circumstance. In a related article, the author asserts that “regression can recover the ‘race effect’ if race is ‘as good as randomly assigned,’ conditional on the covariates” (Fryer Reference Fryer2018, 2). Fryer (Reference Fryer2019) claims to find evidence of bias in sublethal force but none in lethal encounters.
A related study, Johnson et al. (Reference Johnson, Tress, Burkel, Taylor and Cesario2019), attempts to estimate racial bias in police shootings. Examining only positive cases in which fatal shootings occurred, they find that the majority of shooting victims are white and conclude from this that no antiminority bias exists. Knox and Mummolo (Reference Knox and Mummolo2020) show that this conclusion rests on the erroneous assumption that police encounter minority and white civilians in equal number.
Prior work has also examined racial bias in traffic enforcement, such as Ridgeway (Reference Ridgeway2006) which employs propensity score weighting when estimating racial bias in traffic stops in Oakland, CA. The analysis examines outcomes including citations, stop duration, and the decision to search cars. The study claims this reweighting strategy can recover “the causal effect of race” (9) on poststop outcomes. In general, the analysis finds little evidence of racial bias on most outcomes, with the exception of stop duration. Antonovics and Knight (Reference Antonovics and Knight2009) use data on traffic citations from the Boston Police Department to estimate the probability that a ticketed driver was searched, controlling for driver attributes such as age, race, and gender as well as neighborhood traits. They interpret the coefficient on an indicator of whether the officer and ticketed driver are of different races as an estimate of “racial profiling based on prejudice,” as opposed to statistical discrimination (167). The claim is implicitly causal: some share of searches among racially mismatched driver–officer pairs would not have occurred had the driver belonged to another racial group.
The above examples represent a mere fraction of a decades-long, multidisciplinary effort to quantify the degree to which police discriminate against civilians of color [see Atiba Goff and Kahn (Reference Atiba Goff and Kahn2012), Fridell (Reference Fridell2017), and Ridgeway and MacDonald (Reference Ridgeway and MacDonald2010) for more extensive reviews of this empirical literature]. We highlight these specific examples because they all contain several common features that are central to our critique. For one, these studies analyze data that fail to capture the unseen selective process through which police come to engage civilians, a process that prior work shows is function of civilian race (Gelman, Fagan, and Kiss Reference Gelman, Fagan and Kiss2007). In this way, these studies all fail to account for the impact of race on the composition of the sample under study. As we show below, failing to account for this undocumented first stage of the police–civilian interaction will lead to statistical bias, even if the goal is to estimate the effect of suspect race within the sample of individuals who appear in police data and, in many cases, even with a “complete” set of control variables that render civilian race as-if randomly assigned to police encounters.
Second, the aforementioned studies, despite making at least implicitly causal claims, leave ambiguous the precise quantity of interest—whether it be the average treatment effect (ATE) of race in all encounters; the average treatment effect among the subset of encounters appearing in police data because a stop was made (ATEM=1), which differs tremendously from the ATE; or the markedly more restrictive and difficult-to-interpret controlled direct effect among the same subset (CDEM=1, defined below). While studies commonly discuss omitted variable bias and attendant assumptions, they rarely discuss the additional assumptions necessary to identify specific causal quantities of interest. As a result, readers are unable to assess the adequacy of research designs and estimators, rendering the interpretation and policy relevance of much prior work unclear.
Taste-Based versus Statistical Discrimination
A closely related literature attempts to parse “taste-based discrimination” (racial animus) from so-called “statistical discrimination” (Arrow Reference Arrow and Pascal1972, Reference Arrow1998; Becker Reference Becker1971; Eberhardt et al. Reference Eberhardt, Goff, Purdie and Davies2004; Phelps Reference Phelps1972) as mechanisms for racially biased policing, and instead focuses on recovering the causal effect of civilian race on police behavior. In this study, we do not attempt to disentangle these mechanisms, and we note that taste-based and statistical discrimination both pose serious normative concerns. While statistical discrimination is sometimes viewed as more innocuous, it nonetheless constitutes racial profiling because officers detain civilians due to the perceived actions of their racial group, not their observed individual behavior. Thus, quantifying the causal effect of civilian race on police behavior—our task here—is imperative regardless of the mechanism that produces such an effect.
CLARIFYING THE EFFECT OF CIVILIAN RACE: NOTATION, ESTIMANDS, ASSUMPTIONS, AND EXISTING APPROACHES
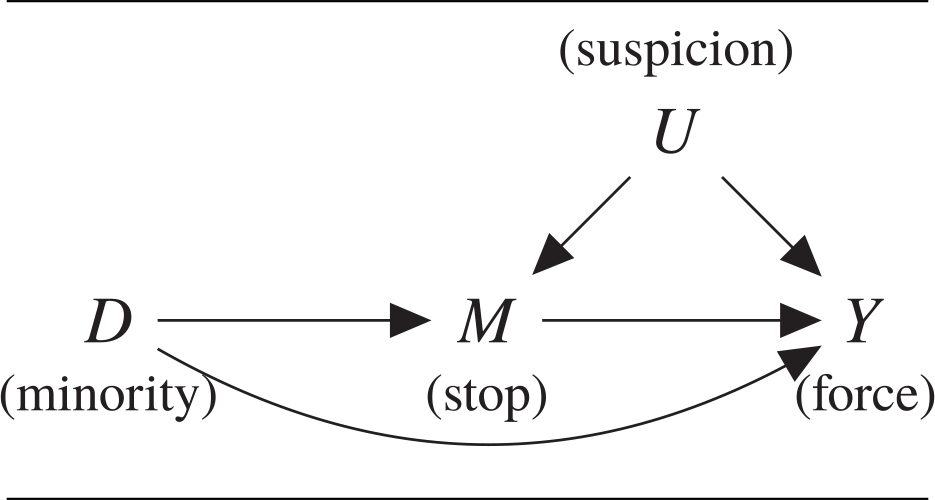
Researchers and policymakers examining the effects of racially biased policing are nominally interested in the relationship between two variables: the race of the civilian involved in encounter i, which we operationalize through their minority status D i ∈ {0, 1}, and consequent police behavior Y i ∈ {0, 1}. However, analyses of administrative data on police–civilian encounters inherently involve a mediating variable that may be affected by race: whether an individual is stopped by police, which we denote M i. The causal ordering of these variables is depicted in the directed acyclic graph (DAG) in Figure 1. We note that analysts often possess rich contextual information about the objective context of the encounter, such as its location and time, which may relate to all of the above. We denote these covariates collectively as X i. However, administrative data invariably fail to capture unobservable subjective aspects of the encounter, U i, such as an officer’s suspicion or sense of threat.
Directed Acyclic Graph of Racial Discrimination in the Use of Force by Police
Notes: Observed X is left implicit; these covariates may be causally prior to any subset of D, M, and Y.
As a motivating example, we consider the challenge of estimating racial bias in police violence as recently attempted in Fryer (Reference Fryer2019). We ground our analysis in the potential outcomes framework (Rubin Reference Rubin1974) often used in the study of causal mediation (Imai et al. Reference Imai, Keele, Tingley and Yamamoto2011; Pearl Reference Pearl2001). The potential mediator M i(d) represents whether encounter i would have resulted in a stop if the civilian were of race d. Similarly, the potential outcome Y i(d, m) represents whether force would have been used in encounter i if the civilian were of race d and the mediating variable were m. The observed mediator and outcome can be written in terms of these potential values as 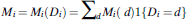 ${M_i} = {M_i}\left( {{D_i}} \right) = \sum\limits_d {{M_i}\left( d \right)1\left\{ {{D_i} = d} \right\}}$
and
${M_i} = {M_i}\left( {{D_i}} \right) = \sum\limits_d {{M_i}\left( d \right)1\left\{ {{D_i} = d} \right\}}$
and  $\eqalign{Y_i} = {Y_i}\left( {{D_i},{M_i}\left( {{D_i}} \right)} \right) = \sum\limits_d {\sum\limits_m {{Y_i}\left( {d,m} \right)1\left\{ {{D_i} = d,{M_i} = m} \right\}} }$
, respectively. For any individual encounter, the (unobservable) causal effect of civilian race is the difference in potential force if the civilian were a minority and stopped as if they were a minority, versus if they were white and stopped accordingly, Y i(1, M i(1)) − Y i(0, M i(0)).
$\eqalign{Y_i} = {Y_i}\left( {{D_i},{M_i}\left( {{D_i}} \right)} \right) = \sum\limits_d {\sum\limits_m {{Y_i}\left( {d,m} \right)1\left\{ {{D_i} = d,{M_i} = m} \right\}} }$
, respectively. For any individual encounter, the (unobservable) causal effect of civilian race is the difference in potential force if the civilian were a minority and stopped as if they were a minority, versus if they were white and stopped accordingly, Y i(1, M i(1)) − Y i(0, M i(0)).
This notation implicitly makes the stable unit treatment value assumption (SUTVA, Rubin Reference Rubin1990). “Stability” is of particular note: this stipulates that finer racial gradations must not affect the way that officers behave, above and beyond any differences between the broad binary categories D i = 0 and D i = 1. SUTVA also requires that each encounter is unaffected by a civilian’s race in other encounters; this might be violated if, for example, groups of individuals are stopped simultaneously.
Traditionally, analysts use data on stopped individuals to study bias by computing the difference in violence rates between stopped minority and white civilians, while controlling for observable differences between these two sets of encounters. We term this the “naïve estimator,”  $\hat{\Delta }$
, and it can be written as follows:
$\hat{\Delta }$
, and it can be written as follows:
 $$\hat{\Delta } = \overline {{Y_i}|{D_i} = 1,{M_i} = 1} - \overline {{Y_i}|{D_i} = 0,{M_i} = 1} ,$$
where conditioning on possible treatment-outcome confounders, X i, is left implicit. Assuming the analyst has correctly measured and specified all such confounders,  $\hat{\Delta }$
may appear entirely reasonable at the first glance. However, without further assumptions, this quantity will have no causal interpretation so long as the treatment affects the mediator (i.e., civilian race affects whether officers detain a civilian). As we show below, this is because treated encounters (with minority civilians) that result in a stop (M i = 1) will not be comparable to those with stopped control (majority) civilians. As a simple example, suppose officers exhibited racial bias as follows: they detain white civilians if they observe them committing a serious crime (such as assault, potentially warranting the use of force) but detain nonwhite civilians regardless of observed behavior. When this is true, comparing stopped white and nonwhite civilians amounts to comparing fundamentally different groups. The analyst will observe force used against a greater proportion of stopped white civilians because of the differential physical threat they pose to officers.Footnote 5 Under the traditional approach, the analyst would naïvely conclude that antiwhite bias exists, yielding an erroneous portrait of racial discrimination in the use of force.
$\hat{\Delta }$
may appear entirely reasonable at the first glance. However, without further assumptions, this quantity will have no causal interpretation so long as the treatment affects the mediator (i.e., civilian race affects whether officers detain a civilian). As we show below, this is because treated encounters (with minority civilians) that result in a stop (M i = 1) will not be comparable to those with stopped control (majority) civilians. As a simple example, suppose officers exhibited racial bias as follows: they detain white civilians if they observe them committing a serious crime (such as assault, potentially warranting the use of force) but detain nonwhite civilians regardless of observed behavior. When this is true, comparing stopped white and nonwhite civilians amounts to comparing fundamentally different groups. The analyst will observe force used against a greater proportion of stopped white civilians because of the differential physical threat they pose to officers.Footnote 5 Under the traditional approach, the analyst would naïvely conclude that antiwhite bias exists, yielding an erroneous portrait of racial discrimination in the use of force.
To formalize the limitations of the naïve estimator, we begin by partitioning the population into principal strata with respect to the mediator (Frangakis and Rubin Reference Frangakis and Rubin2002; VanderWeele Reference VanderWeele2011). That is, we conceptualize police–civilian encounters in terms of four latent classes within which M i(1) and M i(0) are constant. The general approach of principal stratification has proven useful for clarifying and bounding quantities of interest in areas ranging from instrumental variables (Angrist, Imbens, and Rubin Reference Angrist, Imbens and Rubin1996; Balke and Pearl Reference Balke and Pearl1997) to the closely related “truncation by death” problem (Rubin Reference Rubin2000; Zhang and Rubin Reference Zhang and Rubin2003).
These principal strata include “always-stop” encounters in which M i(0) = M i(1) = 1, as well as stops that discriminate against racial minorities (“racial stops”) in which M i(1) = 1 but M i(0) = 0. Always-stop encounters may be conceptualized as relatively severe scenarios, such as violent crimes in progress, in which officers have no choice but to intervene regardless of civilian race. In contrast, previous work has identified certain behaviors, such as “furtive movements” (Gelman, Fagan, and Kiss Reference Gelman, Fagan and Kiss2007; Goel, Rao, and Shroff Reference Goel, Rao and Shroff2016), that appear to be acted on selectively by officers based on the race of suspects. “Never-stop” encounters, where M i(0) = M i(1) = 0, are situations in which civilians appear inconspicuous and would not be stopped, regardless of race. There also may be antiwhite racial encounters, in which M i(1) = 0 but M i(0) = 1, though we believe these to be rare to nonexistent (discussed further below). Figure 2 shows encounters appearing in police records (principal strata for which M i(D i) = 1) are not comparable across civilian races. Minority police–civilian encounters that result in a stop are a mixture of “always-stop” and “antiminority racial stop” encounters, while encounters with white civilians that result in a stop are a combination of “always-stop” and “antiwhite racial stop” encounters. These are fundamentally different groups, and without further assumptions, comparisons of rates of violence between them using the naïve estimator will be statistically biased.
Principal Strata and Observed Police–Civilian Encounters
Notes: The figure displays the four principal strata that comprise police–civilian encounters based on how the mediator M (whether a civilian is stopped by police) responds to treatment D (whether the civilian is a racial minority). Minorities in the “always stop” and anti-minority racial stop strata, highlighted in red, are stopped by police and, thus, appear in police administrative data. Likewise, white civilians in the “always-stop” and anti-white racial stop strata, highlighted in blue, appear in police data. “Never stop” encounters are unobserved. Because white and nonwhite encounters are drawn from different principal strata, the two groups are incomparable and estimates of causal quantities using observed encounters will be statistically biased absent additional assumptions.
To state this more formally, note that the naïve estimator recovers the weighted combination of violence rates in observed principal strata:
 $$\eqalignb{	 {\mathbb{E}}\left[ {\hat{\Delta }} \right] = {\mathbb{E}}\left[ {{Y_i}|{D_i} = 1,{M_i} = 1} \right] - {\mathbb{E}}\left[ {{Y_i}|{D_i} = 0,{M_i} = 1} \right] \cr 	 = {\mathbb{E}}\left[ {{Y_i}\left( {1,1} \right)|{D_i} = 1,{M_i}\left( 1 \right) = 1,{M_i}\left( 0 \right) = 1} \right]\Pr \left( {{M_i}\left( 0 \right) {= 1|{D_i} = 1,{M_i}\left( 1 \right) = 1} {\right) + {\mathbb{E}}\left[ {{Y_i}\left( {1,1} \right)|{D_i} = 1,{M_i}\left( 1 \right) {= 1,{M_i}\left( 0 \right) = 0} {\right]\Pr \left( {{M_i}\left( 0 \right) = 0|{D_i} = 1,{M_i}\left( 1 \right) = 1} \right) {- {\mathbb{E}}\left[ {{Y_i}\left( {0,1} \right)|{D_i} = 0,{M_i}\left( 1 \right) = 1,{M_i}\left( 0 \right) = 1} \right]\Pr \left( {{M_i}\left( 1 \right) {= 1|{D_i} = 0,{M_i}\left( 0 \right) = 1} {\right) \cr - {\mathbb{E}}\left[ {{Y_i}\left( {0,1} \right)|{D_i} = 0,{M_i}\left( 1 \right) {= 0,{M_i}\left( 0 \right) = 1} {\right]\Pr \left( {{M_i}\left( 1 \right) = 0|{D_i} = 0,{M_i}\left( 0 \right) = 1} \right). \cr}\quad$$
In equation (2), the first term is the average rate of force applied during encounters with racial minorities of the always-stop stratum, while the second term deals with minorities in the anti–minority racial-stop stratum. The third and fourth terms are the average violence rates among white civilian encounters in the always-stop and antiwhite racial stop strata. Importantly, principal strata are not fully observable without further assumptions, and they exist even after conditioning on X i: for any particular minority stop, it is fundamentally impossible to know with certainty whether a white civilian would have been stopped in identical circumstances. In sum, the naïve estimator compares groups with different potential outcomes, and because these groups are unobservable, the resulting bias is difficult to address.
A central quantity of interest in the study of policing bias is the average treatment effect of race,  ${\rm{ATE}} = {\mathbb{E}}\left[ {{Y_i}\left( {1,{M_i}\left( 1 \right)} \right) - {Y_i}\left( {0,{M_i}\left( 0 \right)} \right)} \right]$
—the extent to which civilians of color face greater risk of police violence than white civilians because of their race. The ATE considers both reported and unreported encounters, and it captures two related phenomena: first, whether members of the minority are differentially stopped; and second, if they are differentially subject to violence. However, police administrative records contain data only on reported encounters, meaning that this quantity cannot be estimated solely with police administrative data without untenable assumptions. The ATE can be restated as follows:
${\rm{ATE}} = {\mathbb{E}}\left[ {{Y_i}\left( {1,{M_i}\left( 1 \right)} \right) - {Y_i}\left( {0,{M_i}\left( 0 \right)} \right)} \right]$
—the extent to which civilians of color face greater risk of police violence than white civilians because of their race. The ATE considers both reported and unreported encounters, and it captures two related phenomena: first, whether members of the minority are differentially stopped; and second, if they are differentially subject to violence. However, police administrative records contain data only on reported encounters, meaning that this quantity cannot be estimated solely with police administrative data without untenable assumptions. The ATE can be restated as follows:
 $$\eqalign{ 	 {\rm{ATE}} = {\mathbb{E}}\left[ {{Y_i}\left( {1,{M_i}\left( 1 \right)} \right)} \right] - {\mathbb{E}}\left[ {{Y_i}\left( {0,{M_i}\left( 0 \right)} \right)} \right] \cr 	 \quad\quad\quad= \sum\limits_d {\sum\limits_m {\sum\limits_{m'} {\left( {{\mathbb{E}}\left[ {{Y_i}\left( {1,{M_i}\left( 1 \right)} \right) - {Y_i}\left( {0,{M_i}\left( 0 \right)} \right)|{D_i} = d,{M_i}\left( 1 \right) = m,{M_i}\left( 0 \right) = m\prime } \right]} \right.} } } \cr 	 \left. { \hskip -25pt\times \Pr \left( {{D_i} = d,{M_i}\left( 1 \right) = m,{M_i}\left( 0 \right) = m\prime } \right)} \right), \cr}$$
where the second line illustrates how it sums over the principal strata depicted in Figure 2, taking into account the number of minority and white civilians in each strata (the probabilities) and the local average treatment effects for each group (the expectations). In Online Appendices A.1–A.4, we use these quantities to derive bias and nonparametric sharp bounds.
No data are available for “never-stop” encounters, those with M i(1) = M i(0) = 0. Moreover, racial-stop encounters, with M i(1) = 1 and M i(0) = 0, are only recorded for minority civilians. However, consistent with Nyhan, Skovron, and Titiunik (Reference Nyhan, Skovron and Titiunik2017), we show in Online Appendix A.6 that the ATE can be point identified if researchers collected two additional numbers: the count of total minority and white encounters, within levels of covariates X where applicable—a point we discuss further in our recommendations for future research.Footnote 6
Because “never-stop” encounters are unobserved in current data sources, researchers seeking to understand the role of race in police behavior have, at least implicitly, focused on more narrowly defined estimands.Footnote 7 Studies commonly restrict analysis to the subset of reported encounters, that is, they seek to estimate effects among those stopped by police, ATEM=1. In contrast to the ATE, this estimand is by definition not concerned with unreported white encounters that would have escalated to a stop if the involved civilian was a minority. (The same is true for unreported black encounters that would have escalated if the involved civilian was white, to the extent that this group exists.) Formally, this quantity is given by the following equation:
 $${\rm{AT}}{{\rm{E}}_{M = 1}} = {\mathbb{E}}\left[ {{Y_i}\left( {1,{M_i}\left( 1 \right)} \right)|{M_i} = 1} \right] - {\mathbb{E}}\left[ {{Y_i}\left( {0,{M_i}\left( 0 \right)} \right)|{M_i} = 1} \right].$$
Relatedly, analysts may seek to causally attribute the number of minority stops in which force would not have been used if the individual in question had been white (Yamamoto Reference Yamamoto2012). This value is proportional to the conditional average treatment effect among the treated (i.e., minority) stops, which can be written as follows:
 $${\hskip -58pt\rm{AT}}{{\rm{T}}_{M = 1}} = {\mathbb{E}}\left[ {{Y_i}\left( {1,{M_i}\left( 1 \right)} \right)|{D_i} = 1,{M_i} = 1} \right] - {\mathbb{E}}\left[ {{Y_i}\left( {0,{M_i}\left( 0 \right)} \right)|{D_i} = 1,{M_i} = 1} \right].$$
While the average treatment effects are of obvious policy importance, they are not the only quantity that researchers might seek to estimate. A closely related estimand is the controlled direct effect among the subset of reported encounters,  ${\rm{CD}}{{\rm{E}}_{M = 1}} = {\mathbb{E}}\left[ {{Y_i}\left( {1,1} \right)|{M_i} = 1} \right] - {\mathbb{E}}\left[ {{Y_i}\left( {0,1} \right)|{M_i} = 1} \right]$
. This estimand differs from the ATEM=1 in its conceptual approach to racially discriminatory stops. Where the ATEM=1 asks whether a stop would have occurred at all if the individual were of differing race, the CDEM=1 seeks to quantify what would have happened if the officer was forced to stop them anyway, perhaps against the officer’s will. In practice, the difference is one of interpretation—regardless of the target quantity, existing work in this domain is based on the naïve difference in reported outcomes, and the question lies in the interpretation of estimated results. We note that causal estimands in the literature are often left undefined, making it difficult to assess whether published results are intended to correspond to the ATEM=1 or CDEM=1 (e.g., Goel, Rao, and Shroff Reference Goel, Rao and Shroff2016; Simoiu, Corbett-Davies, and Goel Reference Simoiu, Corbett-Davies and Goel2017). In Online Appendix A.3, we discuss the CDEM=1 at length. We show that it cannot be recovered in this setting unless analysts make the untenable assumption that no mediator-outcome confounding exists (Assumption 5, below). We refer readers to the Online Appendix for further details and focus on recovery of average treatment effects here.
${\rm{CD}}{{\rm{E}}_{M = 1}} = {\mathbb{E}}\left[ {{Y_i}\left( {1,1} \right)|{M_i} = 1} \right] - {\mathbb{E}}\left[ {{Y_i}\left( {0,1} \right)|{M_i} = 1} \right]$
. This estimand differs from the ATEM=1 in its conceptual approach to racially discriminatory stops. Where the ATEM=1 asks whether a stop would have occurred at all if the individual were of differing race, the CDEM=1 seeks to quantify what would have happened if the officer was forced to stop them anyway, perhaps against the officer’s will. In practice, the difference is one of interpretation—regardless of the target quantity, existing work in this domain is based on the naïve difference in reported outcomes, and the question lies in the interpretation of estimated results. We note that causal estimands in the literature are often left undefined, making it difficult to assess whether published results are intended to correspond to the ATEM=1 or CDEM=1 (e.g., Goel, Rao, and Shroff Reference Goel, Rao and Shroff2016; Simoiu, Corbett-Davies, and Goel Reference Simoiu, Corbett-Davies and Goel2017). In Online Appendix A.3, we discuss the CDEM=1 at length. We show that it cannot be recovered in this setting unless analysts make the untenable assumption that no mediator-outcome confounding exists (Assumption 5, below). We refer readers to the Online Appendix for further details and focus on recovery of average treatment effects here.
Necessary Assumptions
In this subsection, we describe a number of statistical assumptions that the analyst must make for a causal study of racially biased policing when only administrative data on police–civilian interactions is available. Without these assumptions, causal quantities of interest in this substantive area cannot be identified in data.
Assumption 1 (Mandatory Reporting).Y i(d, 0) = 0 for all i and for d ∈ {0, 1}.
We assume all encounters that escalate to the use of force also trigger a reporting requirement and are, therefore, observed in administrative data. Though there exist wide variability in data recording practices across jurisdictions, this assumption is plausible in the study of many major police departments. For example, New York Police Department (NYPD) officers are required to report a number of variables, including the specific type of force used, following each “stop, question, and frisk” encounter. Based on these and other reports, the NYPD releases detailed annual use-of-force reports (NYPD 2017). The completeness of these reports with respect to fatalities is informally enforced by standard journalistic practices which place high emphasis on documenting violent incidents (Iyengar Reference Iyengar1994). Lesser forms of force are more likely to go unreported, to be sure, but the ubiquity of surveillance cameras, cell phone cameras, and media interest in police brutality makes unobserved uses of force increasingly unlikely (Fisher and Hermann Reference Fisher and Hermann2015). We note that this assumption is implicit in all analyses of police use of force that rely on administrative data.
Assumption 2 (Mediator Monotonicity).M i(1) ≥ M i(0) for all i.
This assumption allows that there may be encounters in which minorities would be stopped (M i(1) = 1) but whites would not (M i(0) = 0), perhaps because officers racially discriminate in applying differential thresholds of “reasonable suspicion.” However, we assume that the reverse is never true: white civilians are never stopped in circumstances when their minority counterparts would be allowed to pass. This is clearly a stylized representation of a complex reality, and it would be violated if minority officers discriminate against white civilians. A violation could also occur if white civilians were more likely to be stopped by police because they appeared out of place in a predominantly black neighborhood, perhaps under the assumption that they were there to buy drugs (Gelman, Fagan, and Kiss Reference Gelman, Fagan and Kiss2007, 822). These are rare occurrences, and a robustness check in Online Appendix B.3, our reanalysis of Fryer (Reference Fryer2019) after dropping all stops based on suspicion of a drug transaction, shows substantively similar results.
Assumption 3 (Relative Nonseverity of Racial Stops). ${\mathbb{E}}\left[ {{Y_i}\left( {d,m} \right)|{D_i} = d',{M_i}\left( 1 \right) = 1,{M_i}\left( 0 \right) = 1,{X_i} = x} \right] \ge {\mathbb{E}}\left[ {{Y_i}\left( {d,m} \right)|{D_i} = d\prime ,{M_i}\left( 1 \right) = 1,{M_i}\left( 0 \right) = 0,{X_i} = x} \right]$
.
${\mathbb{E}}\left[ {{Y_i}\left( {d,m} \right)|{D_i} = d',{M_i}\left( 1 \right) = 1,{M_i}\left( 0 \right) = 1,{X_i} = x} \right] \ge {\mathbb{E}}\left[ {{Y_i}\left( {d,m} \right)|{D_i} = d\prime ,{M_i}\left( 1 \right) = 1,{M_i}\left( 0 \right) = 0,{X_i} = x} \right]$
.
We theorize that for encounters during criminal events severe enough to warrant stopping a civilian regardless of race (i.e., “severe” or “always-stop” encounters), the use of force is as or more likely to occur than during encounters in which police have more discretion over whether to stop an individual (i.e., those in which racial discrimination in stopping can occur) in expectation. We regard this assumption, which compares violence rates within encounters that hold civilian race fixed, as highly plausible. As one hypothetical example, this assumption would imply that police are as or more likely to use force against a white civilian observed committing assault than a white civilian observed jaywalking, on average.
Assumption 4 (Treatment Ignorability).
(a) With respect to potential mediator M i(d) ⫫ D i|X i.
(b) With respect to potential outcomes: Y i(d, m) ⫫ D i|M i(0) = m′, M i(1) = m″, X i.
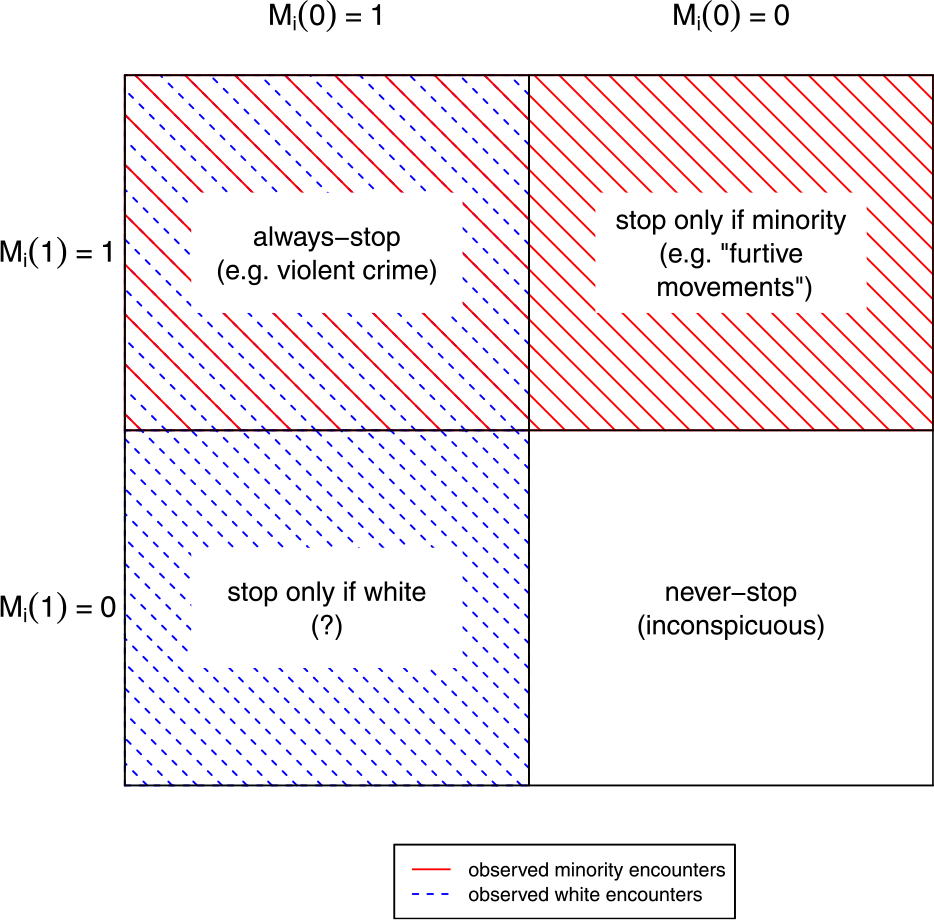
This states that conditional on X i, civilian race is “as good as randomly assigned” to encounters, and officers encounter minority civilians in circumstances that are objectively no different from white encounters. Part 4(a) stipulates that the observed covariates X include the confounder W in Figure 3(a). This assumption, while strong, has become more plausible in recent years as administrative data sets have come to include a host of encounter attributes that might largely capture features observable to police which correlate with suspect race and the potential for force. However, we note that this cannot be tested, even indirectly, without data on nonstopped individuals. This assumption would be violated if neighborhoods with high shares of minority residents were more heavily policed and the analyst failed to adjust for neighborhood, for example, using fixed effects. Part 4(b) implies that, for example, if police were more heavily armed during minority-neighborhood patrols and, hence, more likely to deploy force—represented by V in Figure 3(b)—then V must be included in X. Without Assumption 4, the range of possible racial effects is so wide as to be uninformative. We also note that every study claiming to estimate racial discrimination using similar data makes this assumption, often implicitly. Our aim in this study is not to assert the plausibility of treatment ignorability, but rather to clarify that deep problems remain even if this well-known issue is somehow solved.
Violations of Assumptions
Notes: DAGs (a), (b), and (c), respectively, illustrate the violation of Assumptions 4(a), 4(b), and 5. Note that the variable U depicted in DAG (c) is almost certain to exist in the policing context, and we do not advocate the use of Assumption 5.
Strong Assumptions
We now discuss further assumptions that are often left implicit in empirical studies of racially biased policing and that are implausible in many settings. We illustrate these scenarios graphically in Figure 3.
Assumption 5 (Mediator ignorability).Y i(d, m) ⫫ M i(0)|D i = d, M i(1) = 1, X i.
This is related to but dramatically stronger than Assumption 3, which merely requires that always-stop encounters are at least as severe in terms of observed criminal behavior. In contrast, for Assumption 5 to hold, violence rates in always-stop encounters must be identical to those in observationally equivalent racial stops. We find mediator ignorability to be highly implausible in the context of policing. Subjective factors such as an officer’s suspicion and sense of threat—depicted as U in Figure 3(c)—can not only lead to investigation (stopping) but also a heightened willingness to use force. These mediator-outcome confounders must be captured in X for this assumption to hold, but they are notoriously difficult to capture in officers’ self-reported accounts. Even when proxies based on qualitative officer narratives are available, strong legal incentives exist for distortion. Moreover, analysts must be sure to condition on all variables related to officer mindset that are causally upstream of stops, while taking care not to induce bias by conditioning on any that are downstream.
Below, we demonstrate that every analysis estimating a racial effect using only data on stopped individuals implicitly makes Assumption 5. We further note that Assumptions 4(a), 4(b), and 5 are jointly covered by the slightly stronger assumption of sequential ignorability (Imai et al. Reference Imai, Keele, Tingley and Yamamoto2011).
Assumption 6 (No Racial Stops).M i(0) = M i(1)|M i = 1.
In Figure 3, this amounts to assuming away the arrow between D and M. Equivalently, this assumption states that all reported encounters were of the always-stop kind, or that there is no racial discrimination in stops. We show below that this assumption is implicitly made by all studies claiming to identify the average treatment effect of race, conditional on a reported interaction. Naturally, when there is no variation in M i(0), then this variable is ignorable and Assumption 5 is also satisfied.
However, in view of an overwhelming body of qualitative evidence and consistently massive quantitative differences in racial detainment rates across numerous policing domains, we find racial bias in police stops too plausible to dismiss by assumption (Alexander Reference Alexander2010; Baumgartner et al. Reference Baumgartner, Epp, Shoub and Love2017; Glaser Reference Glaser2014; Goel, Rao, and Shroff Reference Goel, Rao and Shroff2016; Lerman and Weaver Reference Lerman and Weaver2014). A raft of studies have also found that racial disparities persist even after leading candidate omitted variables, such as differential criminal activity across racial groups, are accounted for (Gelman, Fagan, and Kiss Reference Gelman, Fagan and Kiss2007). While such patterns are not proof of a causal relationship, we consider the possibility that police exhibit anti–minority bias when engaging civilians strong enough to merit a careful consideration of the implications of that bias for the validity of studies of racially biased policing.
Bias in the Naïve Estimator
In this section, we clear up several misunderstandings about the conventional estimator, which compares reported minority stops to reported white stops (with or without covariates). First, we show that when there is any racial discrimination in detainment, selection on stops introduces unavoidable statistical bias in estimating the ATEM=1, even when a perfect set of observed covariates renders race ignorable with respect to the potential mediator and outcomes. These results directly contradict prior assertions that “linear regression can recover the ‘race effect’ if race is ‘as good as randomly assigned,’ conditional on the covariates” (Fryer Reference Fryer2018, 2). The issue is not one of omitted variables, but rather posttreatment conditioning. Second, we clarify an important open question about the nature of this bias. Fryer (Reference Fryer2018) comments in the context of selection into arrest data that, “It is unclear how to estimate the extent of such bias or how to address it statistically” (5). Here, we derive the exact form of this bias for the ATEM=1 and the ATTM=1; Online Appendix A.3 does the same for the CDEM=1. We show that the bias is always negative, resulting in naïve estimates that downplay the extent of racially discriminatory police violence. Below, we develop informative nonparametric sharp bounds that adjust the naïve estimates for the range of all possible selection bias.
Prior work on race and policing uses estimators that compare average reported outcomes in majority encounters to those in minority encounters. For simplicity of exposition, we present the special no-covariate case; Appendices A.1–A.3 derive the bias of the naïve estimator with covariate adjustment. We first refer readers to equation (1), which expresses the naïve estimator,  $\hat{\Delta }$
, in terms of stratum mean potential outcomes. We demonstrate that this commonly used analytic approach fails to recover any quantity of interest under plausible assumptions. We first show that it is biased for the ATEM=1 and ATTM=1 unless Assumption 6 is true, and there are no racial stops. In Online Appendix A.3, we show it is also biased for the CDEM=1 unless Assumption 5 holds—that is, always-stop encounters are identical in violence rates to racially discriminatory stops. As a result, the observed difference in means fails to recover any known causal quantity without additional, and highly implausible, assumptions.
$\hat{\Delta }$
, in terms of stratum mean potential outcomes. We demonstrate that this commonly used analytic approach fails to recover any quantity of interest under plausible assumptions. We first show that it is biased for the ATEM=1 and ATTM=1 unless Assumption 6 is true, and there are no racial stops. In Online Appendix A.3, we show it is also biased for the CDEM=1 unless Assumption 5 holds—that is, always-stop encounters are identical in violence rates to racially discriminatory stops. As a result, the observed difference in means fails to recover any known causal quantity without additional, and highly implausible, assumptions.
In Online Appendix A.1, we derive the bias of  $\hat{\Delta }$
when it is used to estimate ATEM=1 under the relatively plausible Assumptions 1–4. This bias can be written as follows:
$\hat{\Delta }$
when it is used to estimate ATEM=1 under the relatively plausible Assumptions 1–4. This bias can be written as follows:
 $$\eqalignb{ 	 {\mathbb{E}}\left[ {\hat{\Delta }} \right] - {\rm{AT}}{{\rm{E}}_{M = 1}} \cr 	 = \left( {{\mathbb{E}}\left[ {{Y_i}\left( {1,1} \right) - {Y_i}\left( {0,1} \right)|{M_i}\left( 1 \right) = 1,{M_i}\left( 0 \right) = 1} \right]} \right. \cr 	 \left. { - {\mathbb{E}}\left[ {{Y_i}\left( {1,1} \right) - {Y_i}\left( {0,0} \right)|{M_i}\left( 1 \right) = 1,{M_i}\left( 0 \right) = 0} \right]} \right) \cr 	 \times \Pr \left( {{M_i}\left( 0 \right) = 0|{D_i} = 1,{M_i} = 1} \right)\Pr \left( {{D_i} = 1|{M_i} = 1} \right) \cr 	 - \left( {{\mathbb{E}}\left[ {{Y_i}\left( {1,1} \right)|{M_i}\left( 1 \right) = 1,{M_i}\left( 0 \right) = 1} \right]} \right. \cr 	 \left. { - {\mathbb{E}}\left[ {{Y_i}\left( {1,1} \right)|{M_i}\left( 1 \right) = 1,{M_i}\left( 0 \right) = 0} \right]} \right) \cr 	 \times \Pr \left( {{M_i}\left( 0 \right) = 0|{D_i} = 1,{M_i} = 1} \right). \cr}$$
We offer several comments on equation (6). The bias term is guaranteed to be negative, even with a perfect set of controls that render D i ignorable, as long as there exist any racially discriminatory stops of minority civilians (or in an empirically falsified edge case).Footnote 8 The first term in the bias expression relates to heterogeneity in the average treatment effect, or the extent to which Y i(1, M i(1)) − Y i(0, M i(0)) differs in expectation between always-stop and racial-stop encounters—respectively, those with M i(1) = M i(0) = 1 and M i(0) < M i(1).Footnote 9 Bias arises because in the latter type of encounter, a white civilian would never have been detained in the first place, and hence force would never have been used—that is,  ${\mathbb{E}}\left[ {{Y_i}\left( {0,0} \right)|{D_i} = 1,{M_i}\left( 1 \right) = 1,{M_i}\left( 0 \right) = 0} \right] = 0$
. Estimating the average potential outcomes of this group using stopped white civilians introduces unavoidable bias that the analyst cannot hope to eliminate simply by adding additional covariates to the estimating model. The second term is related to the difference in baseline violence rates between always-stop encounters and racially discriminatory stops; this term also vanishes if there are no racial stops.
${\mathbb{E}}\left[ {{Y_i}\left( {0,0} \right)|{D_i} = 1,{M_i}\left( 1 \right) = 1,{M_i}\left( 0 \right) = 0} \right] = 0$
. Estimating the average potential outcomes of this group using stopped white civilians introduces unavoidable bias that the analyst cannot hope to eliminate simply by adding additional covariates to the estimating model. The second term is related to the difference in baseline violence rates between always-stop encounters and racially discriminatory stops; this term also vanishes if there are no racial stops.
Can the naïve estimator be rehabilitated by simply redefining the quantity of interest? In Online Appendices A.2–A.3, we show that the answer is no. The structure of the bias when  $\hat{\Delta }$
is used to estimate the ATTM=1 is simpler but leads to substantively identical conclusions: the naïve estimator is biased unless there are no racial stops. We show that bias for the ATTM=1 is given by
$\hat{\Delta }$
is used to estimate the ATTM=1 is simpler but leads to substantively identical conclusions: the naïve estimator is biased unless there are no racial stops. We show that bias for the ATTM=1 is given by  ${\mathbb{E}}\left[ {\hat{\Delta }} \right] - {\rm{AT}}{{\rm{T}}_{M = 1}} = - {\mathbb{E}}\left[ {{Y_i}\left( {0,1} \right)|{M_i}\left( 1 \right) = 1,{M_i}\left( 0 \right)= 1} \right]\Pr \left( {{M_i}\left( 0 \right) = 0|{M_i}\left( 1 \right) = 1} \right)$
. While the identifying assumptions for the CDEM=1 are slightly weaker, they are nonetheless wholly implausible. The sign of this bias for the ATTM=1 and CDEM=1 can also be shown to be negative under Assumption 1–4, except in the implausible edge cases described in the Online Appendix. Thus, regardless of the target quantity, the use of the observed difference in means will understate the rate of racially discriminatory police violence. In addition, we emphasize that these derivations show that statistical bias remains even after assuming a “complete” set of control variables that renders race ignorable. Posttreatment conditioning induces bias unless additional assumptions hold.
${\mathbb{E}}\left[ {\hat{\Delta }} \right] - {\rm{AT}}{{\rm{T}}_{M = 1}} = - {\mathbb{E}}\left[ {{Y_i}\left( {0,1} \right)|{M_i}\left( 1 \right) = 1,{M_i}\left( 0 \right)= 1} \right]\Pr \left( {{M_i}\left( 0 \right) = 0|{M_i}\left( 1 \right) = 1} \right)$
. While the identifying assumptions for the CDEM=1 are slightly weaker, they are nonetheless wholly implausible. The sign of this bias for the ATTM=1 and CDEM=1 can also be shown to be negative under Assumption 1–4, except in the implausible edge cases described in the Online Appendix. Thus, regardless of the target quantity, the use of the observed difference in means will understate the rate of racially discriminatory police violence. In addition, we emphasize that these derivations show that statistical bias remains even after assuming a “complete” set of control variables that renders race ignorable. Posttreatment conditioning induces bias unless additional assumptions hold.
POTENTIAL SOLUTIONS
How should the analyst proceed in light of these results? We propose two approaches that eliminate the highly implausible assumptions outlined in the “Strong Assumptions” section, which are unstated but implicit in prior work. We caution that these solutions still rely on the weaker assumptions described in the “Necessary Assumptions” section, although we argue that these are often plausible in light of insights from extensive research on policing. Reasonable people can disagree on the plausibility of various assumptions, but by stating them explicitly, we seek to advance empirical work in an area which, at present, largely ignores such issues altogether.
In the first approach, we derive nonparametric sharp bounds representing the tightest possible range of causal effects that are consistent with the reported data (Manski Reference Manski1995). Again, for simplicity, we begin by presenting bounds for the case in which treatment is unconditionally ignorable. To incorporate covariates, Online Appendix A.4 then describes a more general formulation in which bounds are computed within levels of X, without functional form assumptions, and reaggregated; this latter formulation is also applicable when a correctly specified regression is used. Both cases are demonstrated in a reanalysis of Fryer (Reference Fryer2019) below.
A key limitation of the first proposed solution is that all quantities of interest remain only partially identified. This is fundamentally a consequence of selection into police administrative records; point identification simply cannot be achieved without either implausible assumptions or additional data. To this end, we outline an alternative approach that incorporates limited information about the missing encounters (those that do not result in a stop). We show that with additional data—which in some cases are already being collected by agencies—the prevalence of racially discriminatory stops and most racial effects of interest can be point identified. Following our applied example, we describe a feasible research design based on this approach in detail.
Bounds on Effect of Race
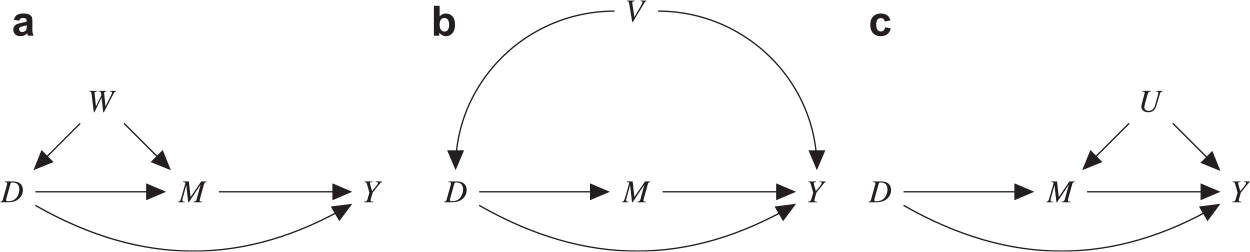
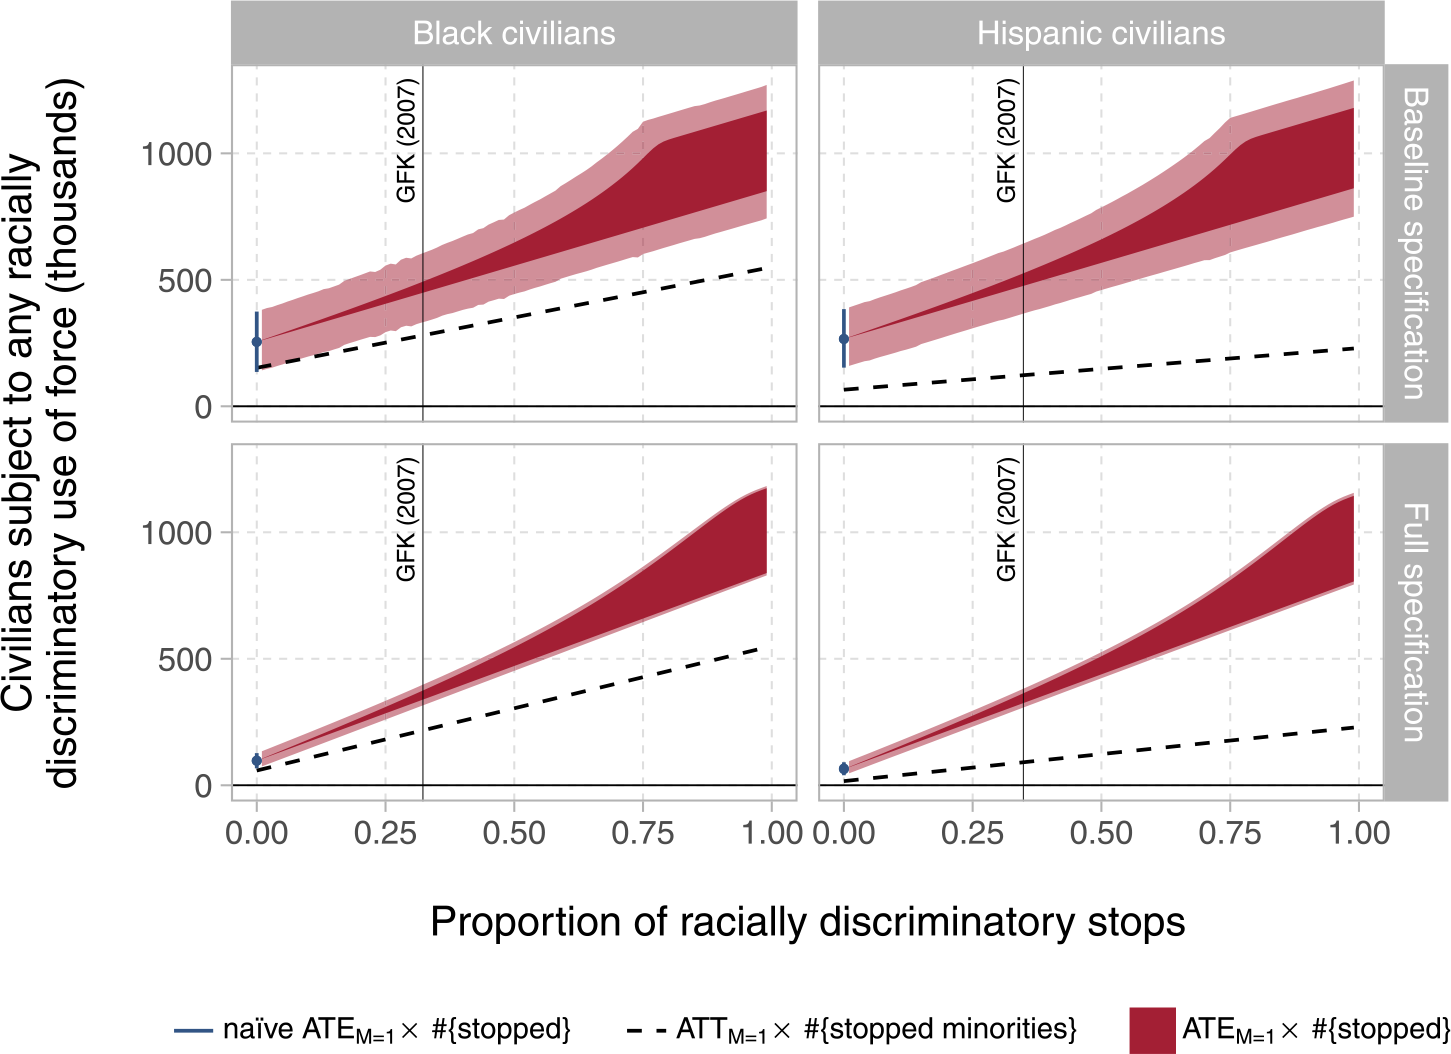
Here, we derive large-sample nonparametric sharp bounds on the ATEM=1 and ATTM=1, focusing first on the case in which Assumption 4 (treatment ignorability) holds without conditioning on further covariates. Proposition 1 quantifies and corrects for the range of possible bias induced by posttreatment conditioning, producing an informative interval of possible joint values for (1) the partially identified ATEM=1 and (2) the proportion of racial stops among reported minority encounters, ρ = Pr(M i(0) = 0|D i = 1, M i = 1). As equation (6) suggests, when there is no racial bias in police stops (ρ = 0), these bounds collapse on the observed difference in means. We further demonstrate in Figure 4 that these bounds are highly informative when ρ is known or can be credibly estimated from supplemental data. When the prevalence of racially discriminatory detainment is unknown but a plausible range can be inferred from prior work, Figure 4 (discussed below) illustrates how this value can be used to assess the behavior of the bounds much like a sensitivity parameter.
Bounds for Racially Discriminatory Use of Force, any Severity
Notes: These plots present the ATEM=1 (ATTM=1) for excess racial force, scaled by the number of stops (number of minority stops) to obtain the total number of civilians affected. The left panels consider the difference in the use of force if black civilians were substituted into each encounter of any race (each black encounter), versus white civilians; the right panels show the same quantities for Hispanic civilians. Blue points (error bars) denote the naïve estimator (95% confidence intervals), which, conditional on the typical selection-on-observables assumption, is unbiased for the ATEM=1 if there are no discriminatory stops of minority civilians (zero on the x-axis). The dark (light) regions represent the range of possible values (95% CI) for (1) the ATEM=1 and (2) the proportion of discriminatory stops in reported data jointly, per Proposition 1. The vertical line corresponds to an estimate of the proportion of discriminatory stops from Gelman, Fagan, and Kiss (Reference Gelman, Fagan and Kiss2007), suggesting a plausible value for this unobservable parameter. The top (bottom) panels present bounds based on a model with no controls (the main specification, adjusting for a wide range of covariates).
Proposition 1 (Nonparametric Sharp Bounds on ATEM=1).When D iis ignorable, nonparametric sharp bounds on (ATE M=1, ρ) under Assumptions 1–4 are jointly given by
 $$\eqalign{ {\mathbb{E}}\left[ {\hat{\Delta }} \right] + \rho {\mathbb{E}}\left[ {{Y_i}|{D_i} = 0,{M_i} = 1} \right]\left( {1 - \Pr \left( {{D_i} = 0|{M_i} = 1} \right)} \right) \,\,\,\,\,\le {\rm{AT}}{{\rm{E}}_{M = 1}} \le {\mathbb{E}}\left[ {\hat{\Delta }} \right] + {\rho \over {1 - \rho }}\left( {{\mathbb{E}}\left[ {{Y_i}|{D_i} = 1,{M_i} = 1} \right] - \max \left\{ {0,1 + {1 \over \rho }{\mathbb{E}}\left[ {{Y_i}|{D_i} = 1,{M_i} = 1} \right] - {1 \over \rho } \right} \bigg\}\right)\times\Pr \left( {{D_i} = 0|{M_i} = 1} \right) + \rho \,{\mathbb{E}}\left[ {{Y_i}|{D_i} = 0,{M_i} = 1} \right]\left( {1 - \Pr \left( {{D_i} = 0|{M_i} = 1} \right)} \right). \cr}$$
where  $\hat{\Delta } = \overline {{Y_i}|{D_i} = 1,{M_i} = 1} - \overline {{Y_i}|{D_i} = 0,{M_i} = 1}$
and the (ATT M=1, ρ) must similarly satisfy
$\hat{\Delta } = \overline {{Y_i}|{D_i} = 1,{M_i} = 1} - \overline {{Y_i}|{D_i} = 0,{M_i} = 1}$
and the (ATT M=1, ρ) must similarly satisfy
 $${\rm{AT}}{{\rm{T}}_{M = 1}} = {\mathbb{E}}\left[ {\hat{\Delta }} \right] + \rho {\mathbb{E}}\left[ {{Y_i}|{D_i} = 0,{M_i} = 1} \right]$$
To derive Proposition 1, we reformulate the bias in terms of the unobserved joint distribution of (1) the use of force in minority encounters and (2) whether a minority stop was racially discriminatory. Following Knox et al. (Reference Knox, Yamamoto, Baum and Berinsky2019), we then use Assumptions 1–4 and the Fréchet inequalities, in conjunction with the observed margins, to place sharp bounds on this joint distribution. These then imply sharp bounds on the ATEM=1. A detailed proof is given in Online Appendix A.4 for the more general case in which D i is ignorable only after conditioning on prestop covariates. In this case, the local average treatment effect, ATEM=1,x, is first bounded by applying Proposition 1 within levels of X to obtain local bounds, 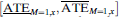 $\left[ {{{\underline {{\rm{ATE}}} }_{M = 1,x}},{{\overline {{\rm{ATE}}} }_{M = 1,x}}} \right]$
. These are then straightforwardly reaggregated to obtain bounds on the conditional treatment effect among stops,
$\left[ {{{\underline {{\rm{ATE}}} }_{M = 1,x}},{{\overline {{\rm{ATE}}} }_{M = 1,x}}} \right]$
. These are then straightforwardly reaggregated to obtain bounds on the conditional treatment effect among stops,  $\left[ {\sum\limits_x {{{\underline {{\rm{ATE}}} }_{M = 1,x}}\Pr \left( {{X_i} = x|{M_i} = 1} \right)} } \right.$
,
$\left[ {\sum\limits_x {{{\underline {{\rm{ATE}}} }_{M = 1,x}}\Pr \left( {{X_i} = x|{M_i} = 1} \right)} } \right.$
,  $\left. {\sum\limits_x {{{\overline {ATE} }_{M = 1,x}}\Pr \left( {{X_i} = x|{M_i} = 1} \right)} } \right]$
. In Online Appendix A1.5, we outline a Monte Carlo procedure for constructing confidence intervals that asymptotically contain both the true lower and upper bounds endpoints with probability 1 − α.
$\left. {\sum\limits_x {{{\overline {ATE} }_{M = 1,x}}\Pr \left( {{X_i} = x|{M_i} = 1} \right)} } \right]$
. In Online Appendix A1.5, we outline a Monte Carlo procedure for constructing confidence intervals that asymptotically contain both the true lower and upper bounds endpoints with probability 1 − α.
We note that the proportion of racially discriminatory stops may vary with X. However, when using these bounds as a sensitivity analysis, we suggest using the simplifying approximation of a constant ρ. This is because without additional data beyond civilian race, the use of force, or even prestop covariates, police administrative records alone are virtually uninformative about the range of ρ: any value in [0, 1) could produce the observed data,Footnote 10 although Proposition 1 shows that each possible ρ value has differing implications for the set of possible racial effects.
Point Identification of the ATE Given Additional Data
The ATE is point identified with the collection of only two additional numbers—the count of total minority and white encounters, within levels of X where applicable. Below, we propose an alternative design in which these data are collected from passive instruments such as traffic cameras or police body-worn cameras. Where such a design is infeasible (e.g., where traffic cameras cover only a subset of the jurisdiction under study), point identification can also be achieved by linking incomplete data on both reported and unreported encounters to police administrative records under mild assumptions.
Proposition 2 (Point Identification of ATE).Under Assumptions 1–4, the ATE is identified by a weighted combination of the observed racial means,
 $${\hskip-55pt\mathbb{E}}\left[ {{Y_i}|{D_i} = 1,{M_i}\left( {{D_i}} \right) = 1} \right]\Pr \left( {{M_i} = 1|{D_i} = 1} \right) - {\mathbb{E}}\left[ {{Y_i}|{D_i} = 0,{M_i}\left( {{D_i}} \right) = 1} \right]\Pr \left( {{M_i} = 1|{D_i} = 0} \right).$$
Intuitively, the proof breaks the ATE into the size-weighted sum of principal effects among always-stop and racial-stop encounters (the principal effect in never-stop encounters is known to be zero). Crucially, the additional data on nonstops allows the researcher to construct a contingency table representing the joint distribution of race and detainment. As part of the proof in Online Appendix A.6, we show that this can be used to straightforwardly recover the size of each principal stratum under Assumptions 2 and 4(a). However, it remains impossible to determine whether any individual stop was racially discriminatory.
When total encounter numbers are unknown, this joint distribution can nonetheless be estimated by attempting to link a representative sample of all encounters (e.g., using timestamps from traffic cameras) against administrative records (e.g., license plate databases); those that are unlinkable can be presumed unreported. After recovering principal strata sizes, we then proceed by noting that minority outcomes in reported administrative data are in fact a mixture of Y i(1, M i(1)) from both always-stop and racial-stop strata in precisely the required proportions; that reported white outcomes correspond to Y i(0, M i(0)) from the always-stop stratum; and that Y i(0, M i(0)) is known to be zero among the racial-stop stratum under Assumption 1. From this, the ATE can then be reconstructed.
REANALYSIS OF FRYER (Reference Fryer2019)
We have shown that the standard approach to estimating racial bias in police data will always underestimate its degree, so long as police discriminate against minorities when choosing whom to investigate. To explore the magnitude of this statistical bias in an applied setting, we replicate and extend a section of Fryer (Reference Fryer2019) which reports estimates of racial discrimination in the application of sublethal force using the NYPD’s “Stop, Question and Frisk” (SQF) database (2003–13).Footnote 11 The NYPD data contain roughly 5 million records of pedestrian stops, the vast majority of which are of nonwhite suspects. The data record the use of varying levels of force, including laying hands on a suspect, handcuffing a suspect, pointing a weapon at a suspect, and pepper spraying a suspect, among others. The original analysis in Fryer (Reference Fryer2019) utilized the simple naïve approach of equation (1) to predict the severity of force applied by police, as well as covariate-adjusted naïve models analogous to those we consider in Appendices A.1–A.3. Specifically, the study presented a logistic regression of police force on suspect race, along with additional specifications that added a host of control variables such as precinct fixed effects, to render the ignorability assumptions more plausible. We reproduce two of these models—the baseline specification including only racial group indicators, along with the richer “main specification” (21)Footnote 12—to estimate the conditional expectations in Proposition 1. For comparability to the original analysis, we take these models at face value, setting aside issues of potential model misspecification and the ignorability of civilian race.
One analysis in Fryer (Reference Fryer2019) considered the use of any force against a suspect, while subsequent analyses examined force exceeding various severity thresholds, such as a binary outcome for “at least use of handcuffs.” Using the coding rules and estimation procedures in Fryer (Reference Fryer2019), we were able to closely replicate the published results. However, in doing so, we discovered this procedure involved an unconventional and inadvisable step in which all observations with nonzero force below the threshold of interest were dropped—a severe case of selection on the dependent variable. In the most extreme case, in the analysis of police baton and pepper spray use, this resulted in the discarding of all encounters in which only lower levels of force were used, a set that comprised 21.5% of all observations and 99.8% of all uses of force. To present the most defensible results possible, for these outcomes, we depart from the analysis in Fryer (Reference Fryer2019) and revise the procedure so that all encounters with a level of force at or above a given threshold are assigned an outcome of 1 (as before) and all other encounters are assigned a value of 0 (including those with lower levels of force, which are now retained). Section B.1 in the Online Appendix contains an extended discussion of the issue; a comparison of the original, replicated, and corrected results; and a demonstration of the serious implications for statistical significance of the original estimates.
Based on the discussion in both Fryer (Reference Fryer2018) and Fryer (Reference Fryer2019), we interpret the published results as estimates of the ATEM=1: “the difference in Y that can be attributed to an individual’s race,” (Fryer Reference Fryer2018, 2), conditional on a recorded interaction with police (i.e., conditional on M i = 1). We note that of the other quantities considered in this study, the unconditional ATE cannot be estimated without information on unreported encounters, and the CDEM=1 cannot be computed without strong assumptions about potential outcomes that can never be realized in observational settings. For these reasons, we focus on the ATEM=1 and ATTM=1 in this reanalysis.Footnote 13
Figure 4 depicts bounds on the ATEM=1 when the binary outcome is any use of force, including the lowest recorded value of physically handling a civilian.Footnote 14 Importantly, this specific outcome is unaffected by the outcome coding issue discussed above. (In Figures B.2 and B.3, we present additional bounds for varying force thresholds, up to whether a baton or pepper spray was used.) The plots also display estimates of the bias-corrected ATTM=1 (dashed lines). As the plots show, the range of possible ATEM=1 and ATTM=1 values varies strongly with the severity of discrimination in stops.
In equation (6), we demonstrated that the use of the naïve estimator implied the substantively implausible assumption that police never discriminate in stops (i.e., ρ = 0). Similarly, contextual information also suggests that some depicted values of ρ are implausibly large. To understand the range of empirically plausible values, we turn to two prior studies that use very different analytic approaches to shed light on the degree of racial bias in the decision to detain civilians. Using the SQF data and controlling for precinct, suspected crime, and prior local arrest rates by race, Gelman, Fagan, and Kiss (Reference Gelman, Fagan and Kiss2007) produce estimates that—by our calculations—imply 32% of black-civilian stops made by the NYPD could not be explained even by differential criminality between racial groups of suspects, as proxied by prior arrest rates.Footnote 15 Their analyses are run separately by precinct and crime type; for simplicity, we take the weighted average of racial-stop proportions. This analytic approach most likely underestimates the proportion of racially discriminatory stops—the number of prior arrests in a precinct and racial group is not a direct measure of criminality, but is itself likely contaminated by discrimination in previous detainments and arrests. We, therefore, regard the value of ρ implied by Gelman, Fagan, and Kiss (Reference Gelman, Fagan and Kiss2007) as conservative.
Goel, Rao, and Shroff (Reference Goel, Rao and Shroff2016) take an entirely different tack based on a comparison of “hit rates,” or the share of stops that produced evidence of the suspected crime for which the civilian was detained—a variant of an “outcome test” for discrimination (Anwar and Fang Reference Anwar and Fang2006; Knowles, Perisco, and Todd Reference Knowles, Perisco and Todd2001). Using a flexible logistic regression to adjust for a vast array of indicators visible to officers prestop, the study shows that white hit rates exceeded those of “similarly situated” black civilians. We show in our Online Appendix A.7 that the difference in hit rates implies a minimum proportion of racial stops and, therefore, also implies a conservative estimate of ρ.Footnote 16 The corresponding values of ρ from these two studies are 0.32 and a lower bound of 0.34, respectively, when considering black civilians. While any estimate of this difficult-to-measure quantity from police data is sure to be imperfect, the fact that two independent estimates of racial bias in stopping so closely comport with one another, despite using wholly different analytical approaches, gives us some empirical justification for narrowing the range of plausible racial effects in the use-of-force analysis. We note that the research design presented in the “Recommendations for Future Research” section below offers an alternative approach for obtaining better estimates of racially discriminatory stopping.
Figure 4 demonstrates that strong negative bias in the naïve estimator paints a wildly misleading portrait of police use of force. We turn first to estimates of the ATEM=1 using the main specification, which adjusts for a battery of covariates. The naïve estimator (which assumes no racial bias in police stops) suggests that encounters with black (Hispanic) suspects are predicted to exhibit an additional 3.9 (0.4) instances of handcuffing per 1,000 encounters, compared with the same encounters had they involved white civilians. We then employ the most conservative racial stopping estimate, denoted by the vertical line in the figure, to generate bounds on the true race effect. Our bias-corrected results show the true effect is at least as high as 15.5 (13.0)—meaning that the conventional approach underestimates discriminatory force by a factor of at least 4 (32).
To characterize bias in estimates of the ATTM=1, we again use the conservative racial stopping estimate from Gelman, Fagan, and Kiss (Reference Gelman, Fagan and Kiss2007) to correct the naïve estimate. Again, the naïve approach substantially understates racially discriminatory police violence, suggesting that there were 75,000 instances in which police laid hands on black and Hispanic civilians, but would not have done so had those individuals been white. Our bias-corrected estimate shows the true number is approximately 307,000, meaning the naïve approach masks 232,000 such incidents. Similarly, the naïve approach indicates roughly 3,400 racially discriminatory instances in which officers pointed a weapon at a black or Hispanic civilian, whereas the bias-corrected ATTM=1 shows the true number is almost five times as large.
To see how this statistical bias affects estimates for different levels of force, Table 1 presents naïve estimates alongside ATEM=1 bounds for excess force per 1,000 black and Hispanic encounters across the full spectrum of police actions—ranging from physical handling of a civilian to the use of pepper spray or a baton—again using the conservative racial-stop estimate from Gelman, Fagan, and Kiss (Reference Gelman, Fagan and Kiss2007) to apply our bias correction. The results again show that the traditional approach substantially understates the degree of racial bias in police use of force. Our results also include numerous cases in which downward bias produces the illusion of no race effect. For example, while the approach in Fryer (Reference Fryer2019) implies a statistically insignificant 2.4 instances per 1,000 encounters of pushing Hispanic suspects to a wall due to suspect race, our revised estimate shows the true number is at least 26—eleven times larger. We can also quantify the number of masked instances of racially discriminatory uses of force as a percentage of all uses of force against minorities, displayed in Figure 5. In the period we examine, black and Hispanic civilians experienced force at the hands of police 779,894 times. Using the approach in Fryer (Reference Fryer2019), one would conclude that about 10% would not have occurred had those civilians been white. Using our bias-corrected approach, we find that in fact 39% were discriminatory. These underestimates persist across all force threshold analyses.Footnote 17
Average Treatment Effect among Stops (ATEM=1), by Severity of Force and Minority Group
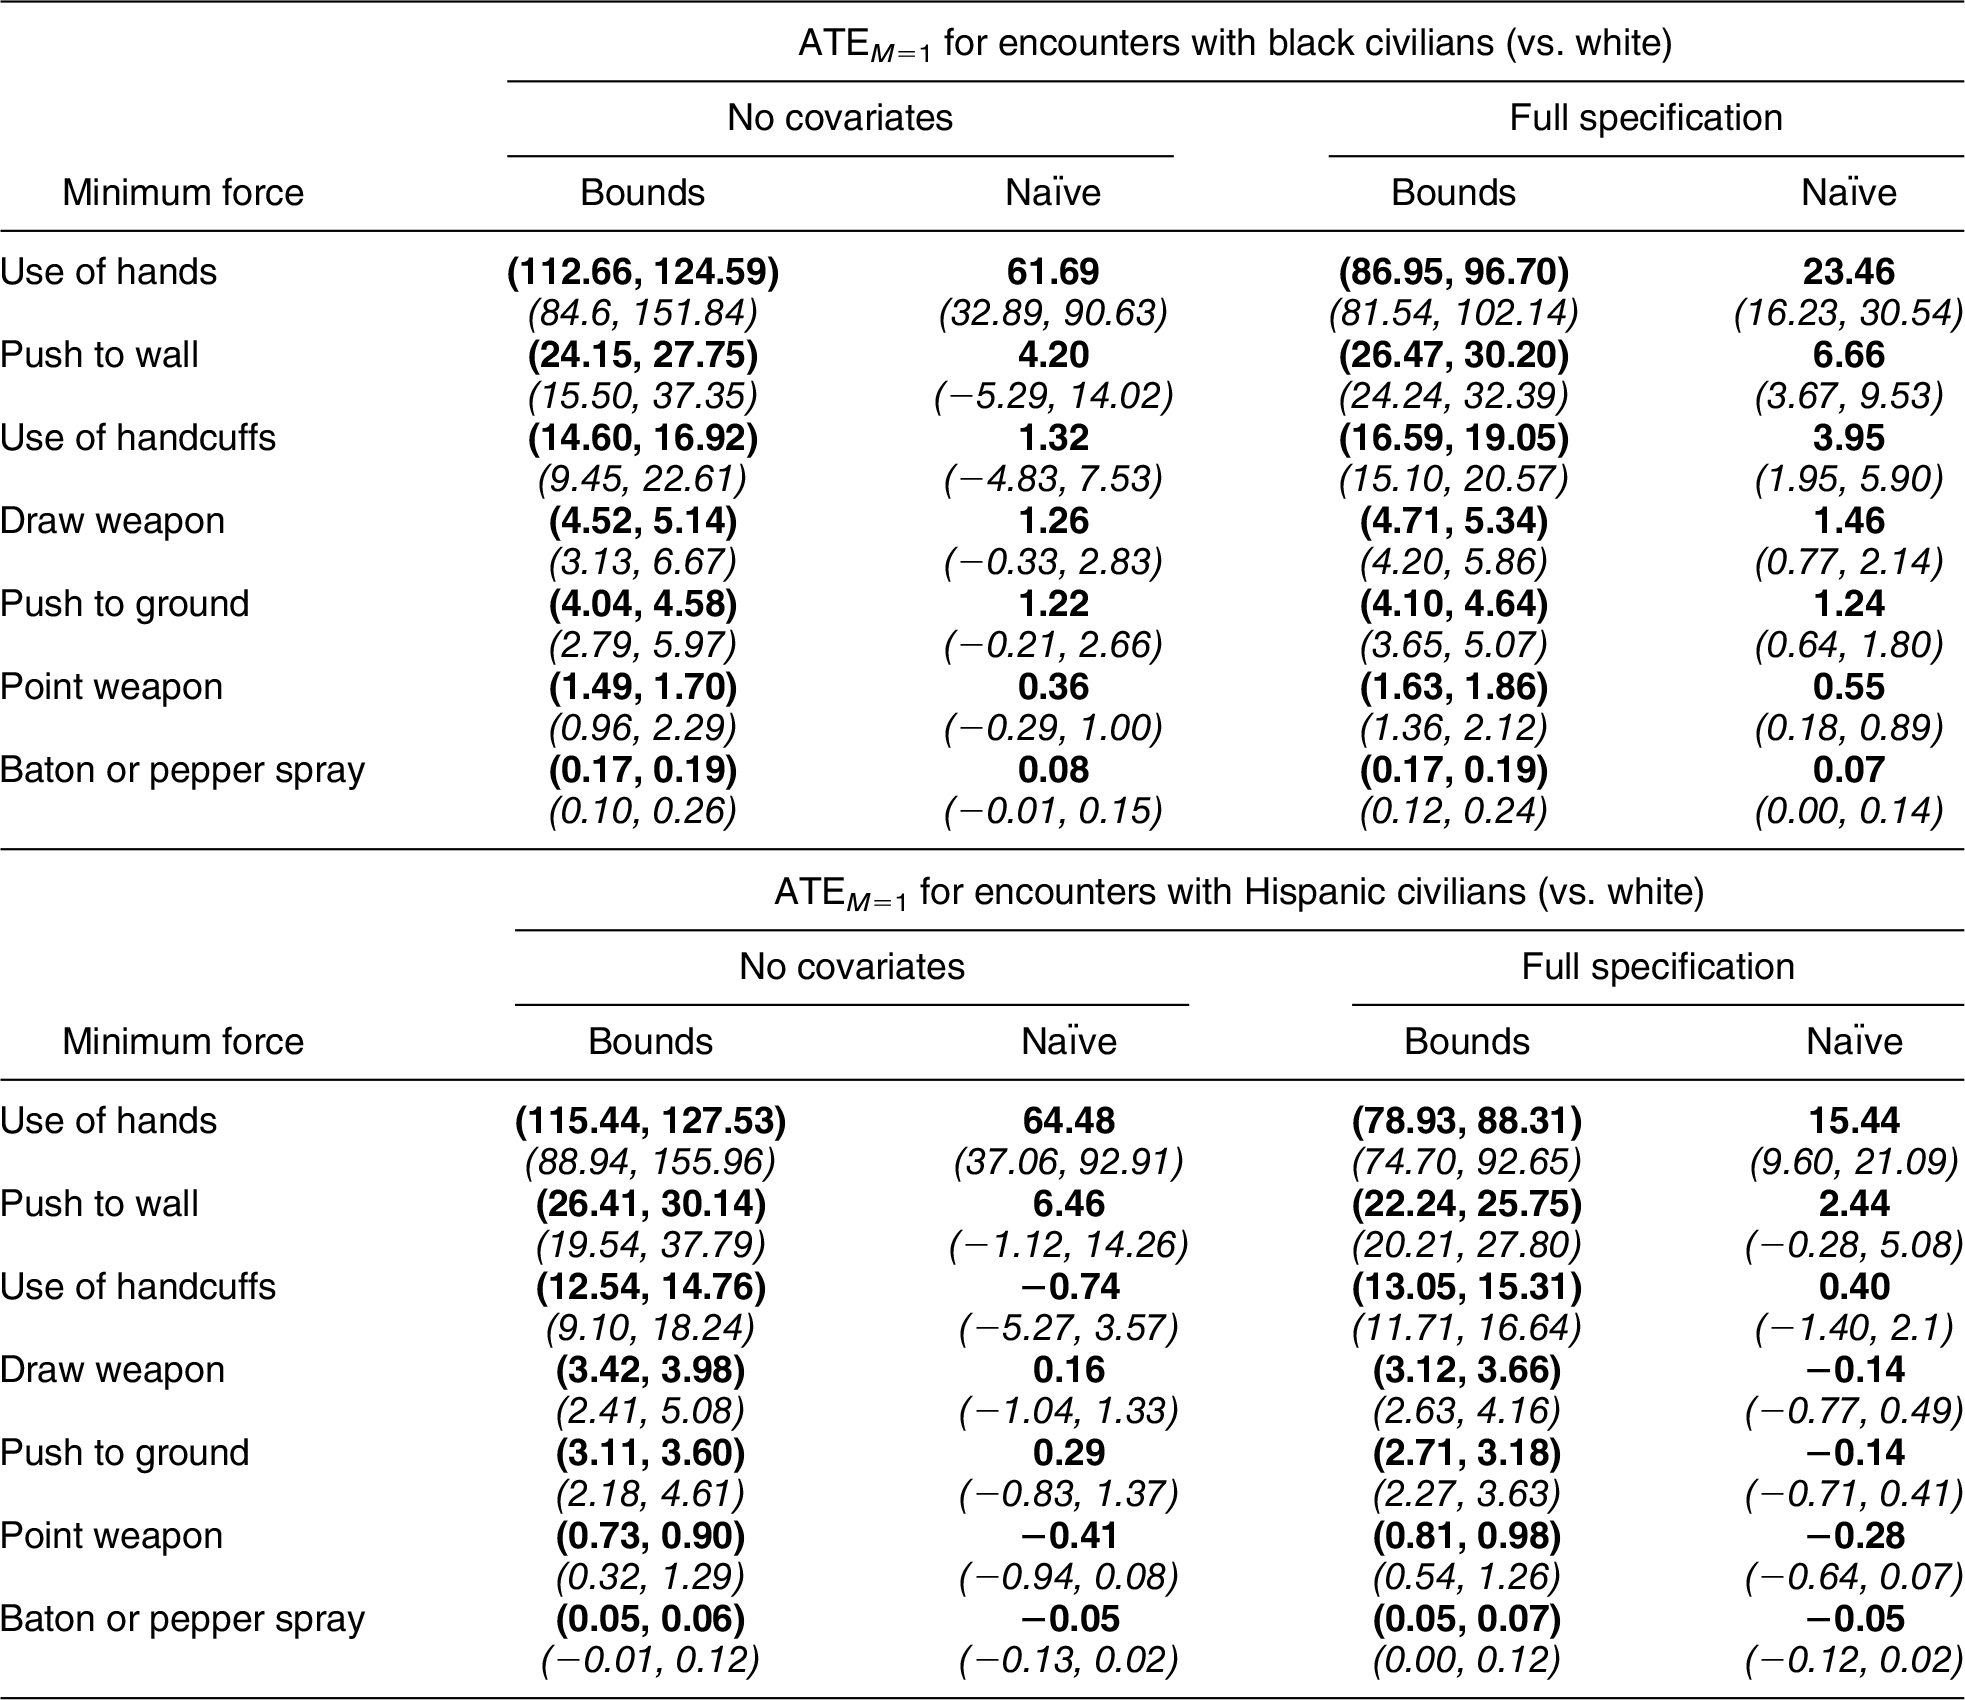
Note: Excess use of force used against minority civilians (versus white civilians) per 1,000 encounters. Bounds intervals indicate the range of possible ATEM=1 values when the unknown proportion of discriminatory stops is approximated with the conservative estimate from Gelman, Fagan, and Kiss (Reference Gelman, Fagan and Kiss2007). Estimates are bolded, and 95% confidence intervals are italicized.
Estimated Number of Racially Discriminatory Uses of Force against Black and Hispanic Civilians, Divided by Total Observed Uses of Force among Those Groups Using Naïve (Red Dot) and Bias-Corrected (Blue Triangle) Estimators of the ATT M=1
Notes: In some cases, the naïve approach returns negative estimates, indicating that more uses of force would have occurred had the civilians been white. The bias-corrected estimates show the naïve estimates substantially underestimate the pervasiveness of anti-minorityracial bias in police violence.
RECOMMENDATIONS FOR FUTURE RESEARCH
The analysis above clarifies whether and when estimates of racial bias in police behavior identify causal quantities, shedding light on how traditional estimation approaches that fail to account for posttreatment conditioning can inadvertently mask racially biased policing. Our results suggest the body of evidence on this topic that relies on police administrative data may be largely uninformative or even misleading. While our bias-correction and bounding techniques are an improvement, they still rely on assumptions that many analysts may not be willing to entertain. Some of these assumptions, such as conditional treatment ignorability, are unavoidable. But others can be sidestepped or weakened through the use of research designs that preempt the problem of posttreatment conditioning. In what follows, we detail a feasible research design that addresses these concerns.
To estimate the effect of suspect race on poststop police behavior while avoiding the concerns outlined above, we describe a feasible study of police–civilian interactions during traffic stops. A key advantage of traffic studies is that much of the data needed to improve research are already collected passively by law enforcement agencies across the United States in an automated fashion via highway cameras. We note that before the advent of this technology, data on unreported police–civilian interactions had to be manually collected by researchers accompanying patrol officers on their shifts (Allen Reference Allen1982; Smith, Visher, and Davidson Reference Smith, Visher and Davidson1984), a labor-intensive strategy highly vulnerable to researcher demand effects (Orne Reference Orne1962).
Recall that a key problem in the typical study of police administrative data is the unobservability of those encounters that do not generate police reports. However, given the prevalence of highway speed cameras across police jurisdictions, it is entirely feasible to collect data on every passing car (or a random sample of passing cars), whether or not police pulled the car over and recorded the stop. This mode of data collection has already been utilized in prior work (Kocieniewski Reference Kocieniewski2002; Lange, Johnson, and Voas Reference Lange, Johnson and Voas2005), though in those studies, camera data on individual motorists were not linked to administrative data on policing outcomes, as we propose below.
Given a large random sample of passing cars captured by highway speed cameras, analysts could use video or photographic records to document license plate numbers that allow for a merge with other administrative data sets containing information on the registrant’s home neighborhood, whether each car went on to be stopped by nearby police at a proximate time, whether a summons was issued, and whether the encounter escalated to include a search or the use of force. As with all causal analyses of observational data, analysts must still make some version of Assumption 4(b)—no treatment-outcome confounding conditional on observable covariates—but in this case, the standard “treatment selection on observables” plausibly holds because virtually all prestop data available to an officer are in fact observable to the analyst. Using camera footage merged with administrative records, analysts could credibly measure this “complete” set of control variables.Footnote 18 These factors would include not only the race, age, gender, and registered neighborhood of the driver but also the make, color, and condition of the car, along with weather and driving speed.
Given this set of covariates, researchers could credibly estimate the ATE for various outcomes, including searching, ticketing, and the use of force, by comparing the rates of outcomes between racial minority and majority motorists, regardless of whether they were stopped by police, conditional on X. The ATTM=1 is similarly point identified because the proportion of racial stops can be calculated and used to correct estimates. However, the ATEM=1 remains partially identified—the quantity can be bounded, as we show above, but not precisely estimated. And as Figure 6 makes clear, the CDEM=1 remains fundamentally unidentifiable without covariates that make Assumption 5 plausible, such as controls for officer temperament that are specific to some stops but not others (i.e., time-varying), which likely influences both stopping decisions and subsequent treatment of civilians.
Traffic Stop Design
Notes: The DAG illustrates potential back-door paths for stops (through W, e.g., heavily policed neighborhoods) and for the use of force (through V, e.g., car registrant has warrant for arrest) that may correlate with the presence of minority drivers. These are blocked (boxed) by conditioning on prestop variables, including license plates as well as administrative records that can be linked through them. Many mediator-outcome confounders (U) cannot be blocked but do not pose a threat to inference for the ATE or ATEM=1.

CONCLUSION
With the release of large and granular data on police–civilian interactions, many researchers have focused on estimating whether police exhibit racial bias in their treatment of civilians. Though some studies have acknowledged the threat of posttreatment bias in this setting (Fryer Reference Fryer2018), the issue has not been adequately addressed, and studies in this area have left ambiguous which causal quantities are being approximated and the degree to which racial bias may be obscured by traditional estimation strategies. Given the policy relevance of this topic and the degree of selection bias inherent to these analyses, we believe social scientists need to devote substantial effort to develop research designs that can sidestep the threat of posttreatment conditioning rather than proceeding in the face of this threat and simply hoping for the best.
In this study, we clarify the statistical problems in the use of police administrative data in isolation to study racial bias. We offer bias-correction and bounding procedures for scholars analyzing these data, along with an improved research design that can avoid posttreatment conditioning altogether. Our results can inform the study of racial discrimination in a host of other settings beyond law enforcement. And though we focus on a case of racial bias in the United States, these results also speak to a rich literature on racial discrimination outside the U.S. context (e.g., Bruce-Jones Reference Bruce-Jones2015; Cano Reference Cano2010). Our identifying assumptions may also be useful for researchers seeking to address biases stemming from posttreatment conditioning more generally, beyond studies of discrimination.
While we are optimistic about alternative designs and estimation strategies, we are under no illusions that eliminating this particular source of bias will remove others. Our research design suggestions may also limit the outcomes that are feasible to study. For example, rare events such as shootings may or may not occur during the observation periods proposed, meaning only lower level uses of force or sanctioning can be studied in some cases. Our recommendations, therefore, place emphasis on bias reduction over latitude in the selection of research questions. But given the ease with which faulty conclusions can be reached as a result of the race-based selection we highlight, narrowing the scope of research to generate more reliable estimates may be preferable, especially because policy reforms could hinge on the results of studies in this area. Put differently, because of the pitfalls we highlight above, it is not clear that studies of rare phenomena that lack a sound design are generating usable knowledge anyway, so this trade-off in scope may be of only marginal concern (Samii Reference Samii2016).
Regardless of which approach scholars pursue, this article highlights the need for further careful research into the first stage of police–civilian interactions—that is, the process by which officers decide whether or not to stop and investigate an individual for a crime. This effort is necessary not only to further our scholarly understanding of police–civilian interactions but also to craft effective policy reforms. If racial bias is concentrated in the initial stage of contact, reforms focused on reducing unnecessary police–civilian interactions may be most effective at curbing racially discriminatory police violence. On the other hand, if there exists more significant bias in the ultimate decision to use force, substantial improvements may require a wholly different reform strategy. Without serious consideration of the role of race in each stage of the complex police–civilian interactions under study, the benefits of data-driven reforms will be stunted, as will our collective understanding of the politics of policing.
SUPPLEMENTARY MATERIAL
To view supplementary material for this article, please visit https://doi.org/10.1017/S0003055420000039.
Replication materials can be found on Dataverse at: https://doi.org/10.7910/DVN/KFQOCV.


Comments
No Comments have been published for this article.