

Multisectoral approaches are necessary to tackle global pandemic of obesity and non-communicable diseases (NCD) and prevent millions of deaths worldwide(Reference Mozaffarian, Angell and Lang1,Reference Hawkes2) . Political consensus has been reached on the need to implement cost-effective and population-wide policies to reduce the impact of unhealthy diets, the most important risk factor for NCD(3). For this purpose, the WHO has recommended a set of comprehensive policy actions that include front-of-package (FOP) nutrition labelling(4).
The term FOP nutrition labelling is used to describe simple, often graphical, labels positioned on the FOP that provide a simple summary of the nutritional composition of foods and beverages(Reference Dean, Spence, Hodgkins and Berryman5). A wide range of schemes have been implemented worldwide, ranging from non-interpretive schemes (e.g., guidelines daily amounts), nutrient-specific interpretive labels (e.g., nutritional warnings), to summary indicators of overall nutritional quality (e.g., health logos, Nutri-Score and Health Star Rating)(Reference Jones, Neal and Reeve6).
Nutritional warnings are one of the FOP nutrition labelling schemes that are receiving growing attention worldwide, particularly in Latin America(Reference Khandpur, Swinburn and Monteiro7). This scheme was first implemented in Chile to highlight processed products with high energy density and high content of nutrients associated with NCD (i.e., sugar, saturated fat and sodium)(Reference Corvalán, Reyes and Garmendia8). Several experimental studies have shown that warnings hold potential to encourage more healthful food choices(Reference Ares, Aschemann-Witzel and Curutchet9–Reference Grummon and Hall12). These results have motivated several Latin American countries to compulsorily introduce this scheme, including Peru(13), Uruguay(14), Mexico(15) and Colombia(16).
Figure 1 shows a logic model explaining how nutritional warnings are expected to lead to long-term effects on health outcomes (i.e., obesity and NCD)(Reference Grunert and Wills17,Reference Crockett, King and Marteau18) . First, consumers need to be aware of the existence of nutritional warnings on food packages. This can be achieved by communication campaigns(Reference Mørk, Grunert and Fenger19) and media coverage of the regulation or by automatic bottom-up processes(Reference Pieters and Wedel20). This type of attentional capture may occur when warnings are noticed on food packages due to their salience, even when consumers are not specifically searching for them(Reference Bialkova and van Trijp21). Once consumers are aware of the existence of warnings, they should be able to easily understand the information they intend to communicate(Reference Grunert and Wills17), that is, information about the nutritional composition of products. Next, consumers should use warnings for making their purchase decisions. In particular, warnings are expected to act as a nudge by discouraging consumers from purchasing products with excessive content of nutrients associated with NCD(Reference Thaler and Sunstein22). Changes in food purchase may lead, in the middle term, to changes in nutrient intake(Reference Crockett, King and Marteau18). The implementation of nutritional warnings is expected to encourage the food industry to reformulate their products, which further contributes to reducing the intake of nutrients associated with NCD(Reference Hawkes, Smith and Jewell23). Finally, if the sequence of steps in the logic model is fulfilled, warnings could contribute to a reduction of the prevalence of obesity and NCD in the long term, as shown by several modelling studies(Reference Egnell, Crosetto and D’Almeida24–Reference Sacks, Veerman and Moodie27).
Logic model of the effects of the implementation of nutritional warnings

Empirical evidence of the effectiveness of nutritional warnings after their implementation in the marketplace is limited. Research conducted in Chile 1 year after the implementation of the policy showed high awareness and acceptance of the policy(Reference Correa, Fierro and Reyes28,Reference Valdebenito Verdugo, Labrín Elgueta and León Perath29) . In addition, approximately 50 % of Chilean consumers reported having modified their food purchases after the introduction of warnings(Reference Valdebenito Verdugo, Labrín Elgueta and León Perath29). Regarding the influence of the policy on product sales, Taillie et al.(Reference Taillie, Reyes and Colchero30) reported that beverage purchases decreased by 23·7 % in the post-regulation period and purchase of energy content from sugar-sweetened beverages decreased 27·5 %. However, Chile simultaneously implemented nutritional warnings and restrictions on labelling and advertisement of energy-dense products and/or products with high content of sugar, saturated fat and sodium(31). For this reason, it is difficult to estimate the effect of nutritional warnings, as the effects of the different components of the law cannot be disentangled.
In this context, the aim of the present work was to assess the effects of nutritional warnings during the first month after the date of full compliance by the food industry in Uruguay. In particular, the following objectives were pursued: (i) to evaluate citizen awareness, (ii) to assess self-reported use of the warnings for decision making and (iii) to evaluate the effect of the inclusion of warnings on citizens’ ability to understand nutritional information in a before and after comparison.
Materials and methods
Nutritional warnings were approved in Uruguay by a presidential decree in August 2018, which granted an 18-month period to the food industry to adapt to the new regulation(14). Thus, full compliance with nutritional warnings by the food industry occurred on 1 March 2020. The present work encompassed two online studies: Study 1 (conducted in May–June 2019) and Study 2 (conducted during the first month after the date of full compliance with nutritional warnings by the food industry, 10–25 March 2020). An after-only design was used to assess citizen awareness of the policy, exposure to nutritional warnings on food packages and self-reported use of warnings for making purchase decisions in Study 2. In addition, an after-only with control group experimental design was used to assess the effect of nutritional warnings on understanding of nutrition information. In Studies 1 and 2, participants were asked to answer a series of questions about the nutritional composition of food products based on the information displayed on packages. Two matched groups of participants were considered: participants in Study 1 served as a control and evaluated the packages without warnings (baseline condition), whereas participants in Study 2 evaluated the same packages but with warnings. A graphical representation of the studies is provided in Fig. 2. The protocol was approved by the Ethics committee of the School of Chemistry of Universidad de la República (Uruguay).
Schematic representation of the research

Participants
Participants were recruited among Facebook and Instagram users using advertisements in both social media. This methodological decision was based on the widespread penetration of Internet in the country and the high popularity of Facebook and Instagram among adults(32). The advertisement appeared on the newsfeed of Uruguayan users, randomly selected by Facebook software, and included the text ‘Participate in our new study and enter a raffle to win a gift card. We want to know your opinion’, accompanied by a drawing showing food packages. Different groups of participants were recruited in Studies 1 and 2. In total, 1772 participants, diverse in terms of gender, age, educational level and socio-economic status, completed the studies: Study 1 (n 855) and Study 2 (n 917).
Questionnaire
When participants clicked on the advertisement, they were redirected to the website where the online questionnaire was hosted (Compusense Cloud; Compusense Inc.). Informed consent was obtained at the beginning of the studies.
Participants were presented with three series of three products that encompassed the following categories: cookies, juice and yogurt. The three categories are usually consumed by the Uruguayan population and, according to previous studies, are frequently not regarded as unhealthful(Reference Ares, Varela and Machín33). Within each category, three commercial products available in the Uruguayan marketplace with different nutritional composition were selected. For each of the series of products, participants were asked to indicate the most healthful product. Products were presented with a picture of the FOP and the nutrition facts table next to it. In Study 1, products did not contain nutritional warnings (Fig. 3(a)), whereas in Study 2, warnings were added to the FOP according to their nutritional composition based on Uruguayan regulations (Fig. 3(b)). Warnings corresponded to black octagons with the expression ‘Excess’, followed by the corresponding nutrients: sugar, total fat, saturated fat and sodium (e.g., Fig. 3(b)). The nutritional composition of the products included in the study is shown in the online supplementary material, Supplemental Table S1. The series of products were presented one by one, following a Williams’ Latin square experimental design. The order of the products within each series was also balanced following a Williams’ Latin square experimental design to avoid order effects.
Example of how labels were presented in the studies conducted before (Study 1, left) and after the implementation of the warnings (Study 2, right). Labels were presented to participants coded with letters (a−c). Brands are blinded for review but were shown to participants

In the second task, participants’ ability to categorise nutrient content as excessive (as established in Uruguayan regulation)(14) was assessed. Participants were presented with a series of seven products: milk dessert, instant soup, granola, crackers, cream cheese, canned green peas and cookies. All the products were commercially available in the country and corresponded to categories frequently consumed by the Uruguayan population. The selected products had excessive content of at least one nutrient according to the Uruguayan regulation(14), as shown in the online supplementary material, Supplemental Table S2. For each of the products, participants were asked to indicate if it had excessive content of any critical nutrient, using check-all-that-apply questions with the following options: ‘No’, ‘Yes, excessive content of sugar’, ‘Yes, excessive content of fat’, ‘Yes, excessive content of saturated fat’ and ‘Yes, excessive content of sodium’. Products were presented using a picture of the FOP (without warnings in Study 1 and with warnings in Study 2), with their corresponding nutrient facts table next to it. The presentation order of the products was balanced following a Williams’ Latin square experimental design.
Immediately after completing the two tasks described above, two questions were used to assess participants’ self-reported perception of the tasks in terms of difficulty and confidence in their responses. Participants were asked to use seven-point structured scales to rate how easy it was for them to answer the questions (1 = very difficult, 7 = very easy) and how confident they were of their responses (1 = not confident, 7 = very confident). In Study 2, participants were shown the warning signs and were asked if they had seen them on the labels they previously evaluated (‘Yes’/‘No’/‘Not sure’) and if they had used them to answer the questions (‘Yes’/‘No’/‘Not sure’).
Study 2 also included a series of questions related to participants’ awareness and acceptance of the policy, as well as the use of the warnings when making their food purchases. First, participants were presented with an explanation of the policy and were asked to indicate if they had heard about it before (‘Yes’/‘No’/‘Not sure’). Acceptance of the policy was assessed by asking participants to rate in a purely evaluative dimension, using a five-point scale (1 = very bad, 2 = bad, 3 = regular, 4 = good and 5 = very good). Then, they were asked if they had seen any product featuring the ‘Excess’ signs when making their food purchases (‘Yes’/‘No’/‘Do not remember’). Participants who answered affirmatively were asked to describe the product(s) (open-ended question). They were also asked to indicate if they had seen the warnings on products they intended to buy (‘Yes’/‘No’/‘Do not remember’). If the answer was ‘Yes’, participants were asked to indicate what they had done with the products, using a multiple-choice question (‘I purchased it anyway’/‘I purchased a similar product with fewer excess signs’/‘I purchased a product without excess signs’/‘I didn’t purchase the product’), and to explain the reasons why.
In both studies, the final part of the questionnaire included a series of socio-demographic questions. Participants were also asked to indicate their self-reported weight and height.
Data analysis
In Studies 1 and 2, descriptive statistics were used to describe participants’ ability to understand nutritional information. For this purpose, the percentage of participants who provided correct responses and the average number of correct responses provided by participants were calculated for each of the tasks. Inferential statistics were used to compare results from Studies 1 and 2. A confidence level of 95 % was considered in all tests. The χ 2 test was used to compare the percentage of participants who provided correct/incorrect responses in Studies 1 and 2. In addition, the t test was used to compare the average number of correct responses provided by participants in Studies 1 and 2.
In the task involving the evaluation of individual labels, descriptive statistics were used to calculate the percentage of participants who provided each response (‘No’, ‘Yes, excessive content of sugar’, ‘Yes, excessive content of fat’, ‘Yes, excessive content of saturated fat’ and ‘Yes, excessive content of sodium’). Inferential statistics were used to compare results from Studies 1 and 2. The χ 2 test was used to compare the proportion of participants who provided each response in Studies 1 and 2.
In Study 2, responses related to participants’ awareness and use of nutritional warnings were analysed using descriptive statistics. The multiple-choice questions were analysed using frequency procedures. Responses to the open-ended questions were analysed using content analysis. Responses were coded into categories as they emerged from the text. The percentage of participants who mentioned responses within each category was calculated. Examples of responses within each of the categories were randomly selected and translated into English.
Results
Table 1 presents the socio-demographic characteristics of participants in Studies 1 and 2. No significant differences were found in the gender (P = 0·597), age (P = 0·099), educational level (P = 0·063), socio-economic status (P = 0·297) and nutritional status (using BMI based on self-reported weight and height; P = 0·640) of participants in Studies 1 and 2. This suggests that both groups of participants were matched in terms of their main socio-demographic characteristics.
Socio-demographic characteristics of the participants

Although the sample was diverse in terms of gender, age, educational level and socio-economic status, it cannot be regarded as representative of the Uruguayan population. Specifically, the sample underrepresented males, citizens older than 60 years, low-income citizens and low-educated citizens(34,35) .
Consumer awareness of nutritional warnings
Awareness and acceptance of the policy were high: 86 % of the participants stated that they had heard about it before and 94 % responded that it was good or very good. Only 1 % of the participants indicated that the policy was bad or very bad, whereas the remaining 5 % rated the policy as regular.
When asked if they had seen any product with warnings when making their food purchases, 77 % responded affirmatively. Participants were asked to describe the products they had seen featuring warnings. As shown in Table 2, a wide range of processed and ultra-processed products were mentioned. Crackers and cookies were the most frequently mentioned product categories, followed by sweetened beverages, dairy products and pantry (mainly soups, canned foods and instant foods). Only 4 % of the participants stated that they did not remember the exact product they had seen.
Percentage of participants who reported having seen nutritional warnings on different product categories when making their food purchases
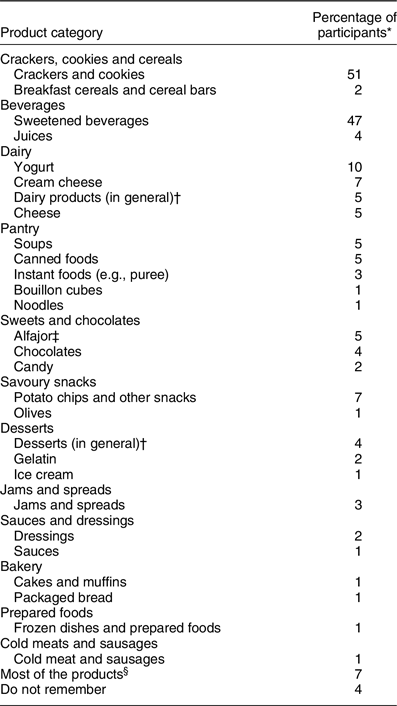
* Percentages are calculated considering only participants who reported having seen the warnings when making their food purchases (n 707).
† Participants provided a general description of the category.
‡ Alfajor is a traditional product which corresponds to a sweet cookie sandwich filled with a layer of dulce de leche (a traditional type of sweetened condensed milk), usually covered with chocolate or meringue.
§ This category corresponds to participants who responded that they saw the warnings on ‘everything’ or on most of the products they usually purchase.
Self-reported use of nutritional warnings when making food purchases
The participants who reported that they had seen the warnings on a product they intended to buy corresponded to 67 %. When asked about their behaviour regarding product purchase, 58 % of those participants stated that they modified their purchase decision after noticing the warnings on the product. Among participants who reported having modified their decision, substitution effects were the most frequent. As shown in Table 3 (left column), 23 % of the participants reported purchasing a similar product without warnings, whereas 17 % reported purchasing a similar product with fewer warnings. However, a category abandonment effect was also observed as 18 % of the participants reported not having purchased any similar product.
Percentage of participants who reported different behaviours when facing a product with warnings in a purchase situation and the underlying reasons
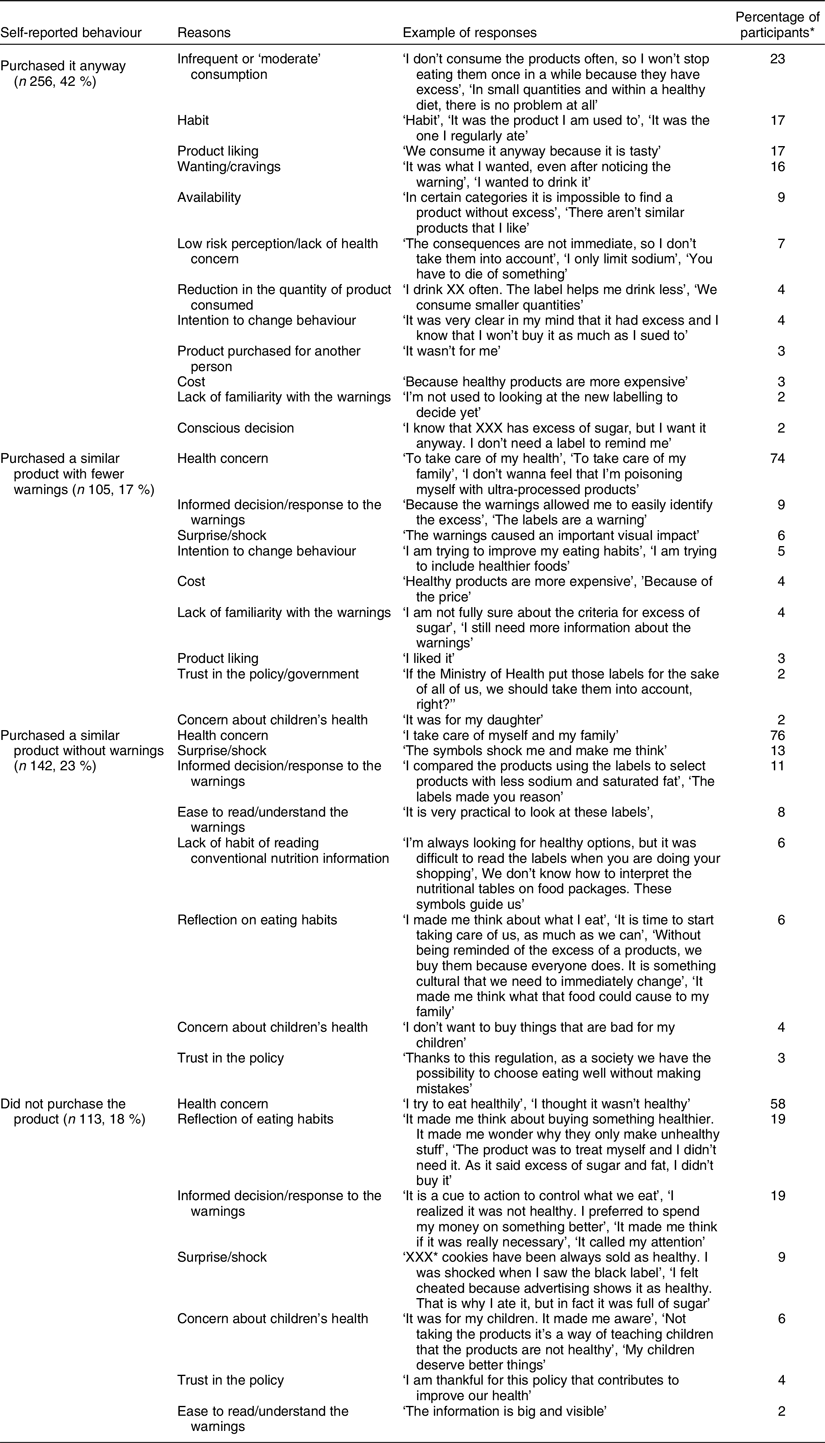
For each of the reasons, examples of responses are shown. Percentages are calculated considering the number of participants who self-reported each behaviour. Values within each behaviour do not sum up to 100 % because some participants provided more than one response.
* The brand is blinded for publication. Examples of responses are translated from Spanish.
The reasons underlying the four identified behaviours when facing a product with warnings were explored. As shown in Table 3, the main reasons for not changing their decision were infrequent or ‘moderate’ consumption, habit and product liking and wanting. In addition, 9 % of the participants indicated that they had not modified their choice because of the lack of availability of other healthy options within the category or lack of an alternative product they liked. Low perception of the risk associated with the consumption of products with excessive content of nutrients associated with NCD and lack of health concern was identified as the reason for not taking the warnings into account for 7 % of the participants. In addition, 2 % of the participants stated that they were conscious about the nutritional composition of the products but wanted to consume it anyway. Interestingly, 8 % of the participants stated that although warnings did not affect their purchase decision, it had an effect on either their actual product consumption or attitudes towards the product. In particular, 4 % of the participants stated that warnings encouraged them to reduce the quantity of product they consumed, whereas an additional 4 % reported intention to modify their habits after being exposed to the warnings. Lack of familiarity with the warnings emerged as a reason for not changing the purchase decision or for buying a product with fewer warnings (Table 3). In this sense, a small proportion of the participants stated that they were not used to using this information for making their food purchase decisions, or that they were not completely sure of the meaning of the warnings.
As expected, participants stated a health-related motivation for changing their purchase decision after noticing the warning(s) (Table 3). Participants highlighted that warnings were easy to find and understand, particularly when compared with conventional nutrition labelling. Some of the participants pointed out that they were interested in healthy eating, but they were not able to understand nutrition facts tables (e.g., ‘I’m always looking for healthy options, but it was difficult to read the labels when you are doing your shopping’). Trust in the policy and the government was also mentioned as a reason underlying the decision to take warnings into account for decision-making.
Warnings seemed to encourage participants to reflect on their eating habits. As shown in Table 3, participants reported thinking about the type of products they were eating and reflect on whether they really needed the product they were about to buy. This category was particularly salient for participants who stated not purchasing the product after noticing the warnings. In addition, participants also reported having felt surprised or shocked when finding warnings on products they regarded as healthy (Table 3).
Understanding of nutritional information
Across the three categories, the percentage of participants who were able to correctly identify the healthiest product significantly increased with the inclusion of nutritional warnings on food packages (Table 4). On average, participants in Study 1 (before the implementation of nutritional warnings) provided 1·7 out of 3 correct responses. The average number of correct responses provided by participants in Study 2 (after the implementation) was significantly (P < 0·001) higher: 2·5 out of 3.
Percentage of participants who correctly selected the most healthful product in the comparison task of three labels within three categories, before (May−June 2019) and after (March 2020) the implementation of nutritional warnings
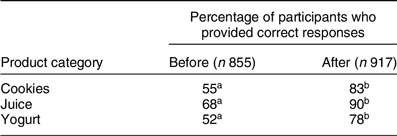
Percentages with different superscript letters within a category are significantly different according to χ 2 test (P < 0·05).
An improvement in the ability to identify excessive nutrient content with the implementation of the warnings was also observed. As shown in Table 5, for the seven product categories, the percentage of participants who provided correct responses was significantly higher in Study 2 (after the implementation of the warnings) compared with Study 1 (before the implementation). The effect of warnings markedly differed across nutrients. The percentage of participants who correctly identified the products with excessive Na content (canned peas, crackers and soup) increased an average of 10 % from Study 1 to Study 2 (rising from 87 to 97 %, P < 0·001). However, for the rest of the nutrients, the observed increase in participants’ ability to correctly identify excessive nutrient content was markedly larger (average increase from 23 to 69 %, P < 0·001).
Percentage of participants who provided different responses in the evaluation of the nutritional composition of labels of seven product categories, before (May−June 2019, n 855) and after (March 2020, n 917) the implementation of nutritional warnings
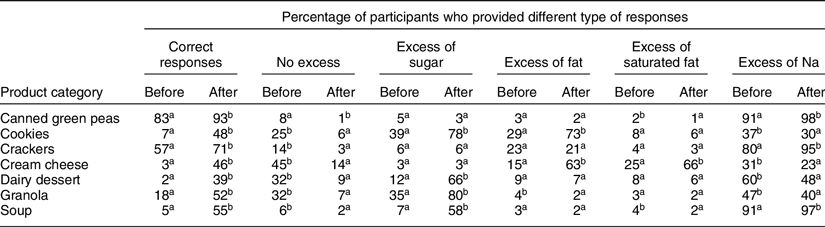
Percentages with different superscript letters within a category and type of response are significantly different according to χ 2 test (P < 0·05).
Although the warnings did not lead to 100 % of correct responses, it is important to note that the percentage of participants who indicated that products did not have excessive nutrient content significantly decreased between Studies 1 and 2, particularly for some of the products (e.g., cream cheese, granola and dairy dessert). Across the seven categories, <15 % of the participants in Study 2 (after the implementation of the warnings) responded that products did not have excessive nutrient content (Table 5).
Participants in Study 2 indicated that the task was easier and that they were more confident in their responses compared with participants in Study 1 (4·5 v. 4·9 (P < 0·001) and 4·8 v. 5·3 (P < 0·001), respectively). In addition, in Study 2, 90 % of the participants indicated that they had seen the warnings in the labels they had assessed in the two tasks, and 79 % of those participants indicated that they had taken them into account for answering the questions.
Discussion
The present research explored the effects of nutritional warnings, immediately after the date of full compliance by the food industry in Uruguay. High prompted awareness of the policy was observed as 86 % of participants indicated having heard about the warnings and 77 % reported having seen them on food packages when making their food purchases. These values are similar to those reported in Chile 1 year after the implementation of the food law that includes nutritional warnings and marketing restrictions(Reference Valdebenito Verdugo, Labrín Elgueta and León Perath29,36) .
Crackers and cookies were the most frequent products where participants reported having seen the warnings, followed by sweetened beverages. Thus, it can be expected that the sales of these categories would be among the most affected by the implementation of nutritional warnings in Uruguay. In this sense, research has reported that these two categories were the most frequently mentioned by Chilean citizens when asked to list the products they were consuming less due to the implementation of nutritional warnings(36).
Significant differences in the ability of Uruguayan citizens to interpret the nutritional information included on food packages were found between the studies conducted before and after the implementation of the warnings. Although results rely on an after-only with control group experimental design and cannot unequivocally assess causality, a trend towards increased ability to use nutritional information to select the most healthful product within a category and to identify products with excessive nutrient content was observed. This is in line with a large body of evidence showing increased understanding of nutritional information due to the inclusion of nutritional warnings on food packages(Reference Arrúa, Machín and Curutchet37–Reference Deliza, de Alcantara and Pereira39). After the implementation of the warnings, a high level of understanding of nutritional information was found: participants were able to identify the most healthful product in 2·5 out of 3 sets of products and to identify excessive nutrient content according to Uruguayan regulations in 69 % of the cases. However, it should be highlighted that results from the current study involved a limited number of evaluations with a small selection of products. Further research should be conducted to gain a more in-depth knowledge of consumers’ ability to use nutritional warnings to make inferences about product healthfulness. In the present research, the increase in understanding was higher for the task involving the evaluation of individual labels than in the task involving the comparison of labels. This can be attributed to the fact that the comparison of labels mainly involves comparison of numbers, whereas the evaluation of individual labels requires participants to rely on absolute references to classify the content of nutrients as excessive.
In addition, the present research showed that participants who evaluated labels with nutritional warnings found it easier to make inferences based on nutritional information than participants who evaluated labels that only included the nutrient facts table. Participants were also reported to be more confident in their responses. This points towards an increased perceived self-confidence to use the nutritional information included on food packages. Considering that self-confidence has been reported to be a key determinant of people’s behaviour(Reference Bandura40), an increase in the use of nutritional information is expected to occur.
The first two steps of the logic model that may explain the ability of nutritional warnings to impact nutrient intake and health outcomes seem to be accomplished within the first month after the date of full compliance with the warnings in Uruguay: citizens reported having seen them and seem to be able to understand the information they convey. The next step in the model is the use of the information for making food purchases. The present research showed that self-reported use of the warnings was high, as 58 % of the participants reported having modified their purchase decision due to the inclusion of the warnings in at least one product category. One year after the implementation of the warnings in Chile, 44 % of respondents reported using the warnings for making their decisions(Reference Valdebenito Verdugo, Labrín Elgueta and León Perath29,36) . The high self-reported use of nutritional warnings immediately after the date of full compliance of the policy could point towards a novelty effect. Further studies should evaluate if self-reported use of the warnings is sustained over time.
In line with results from experimental work(Reference Ares, Aschemann-Witzel and Curutchet9) and Chilean data(Reference Valdebenito Verdugo, Labrín Elgueta and León Perath29), substitution effects were most likely. Participants mainly reported having substituted a product with warnings by other similar products with fewer or no warnings. This result stresses the idea that warnings are mainly expected to encourage consumers to select less harmful products within a specific product category. The main motivation for taking the warnings into account for making purchase decisions was related to health interest. This is in agreement with previous studies that have identified health motivation as a key determinant of the use of nutrition information in decision-making(Reference Grunert, Celemín and Genannt Bonsmann41–Reference Cavaliere, De Marchi and Banterle43). Trust in the policy and the government emerged as another reason for taking the warnings into account in decision-making. Trust in the messenger has been previously highlighted as a cue for trust in and use of labelling(Reference Visschers, Hartmann and Leins-Hess42).
In some cases, the inclusion of warnings on products perceived as healthy caused surprise and shock among participants, who reported that they did not expect to find the warnings on such products. This surprise effect may disrupt the habitual nature of food purchases and encourage people to modify their purchase decisions. For this reason, the sales of products with a strong health association are expected to be the most affected by the implementation of nutritional warnings. Previous research has shown that FOP nutrition labelling is mainly expected to influence perception and choice of products incorrectly perceived as healthy(Reference Ares, Aschemann-Witzel and Curutchet9,Reference Arrúa, Machín and Curutchet37,Reference Cavaliere, De Marchi and Banterle43–Reference Maubach, Hoek and McCreanor45) . In the case of products perceived as unhealthy, people have reported to ignore nutritional information(Reference Balasubramanium and Cole46). However, results from the present work suggest that warnings may also encourage participants to reflect on their eating habits, and particularly their consumption of products regarded as unhealthy and not essential. This result suggests that warnings may have the potential to make the nutritional composition of products and its negative effects on health more salient in consumers’ mind, triggering changes in purchase behaviour. This mechanism of action has been previously reported for pictorial warnings on tobacco products(Reference Brewer, Parada and Hall47). Further research is needed to confirm this hypothesis and further explore the mechanisms that underlie the influence of warnings on purchase decisions.
Although the majority of participants who faced products with nutritional warnings when making their purchases modified their decision, 42 % reported having purchased the product anyway. The main reason for not taking the warnings into account was mainly related to lack of risk perception, mainly due to the perceived infrequent consumption of the product or perceived consumption in small quantities. Experimental studies have shown that lack of risk perception and a future-oriented view in decision-making decrease likelihood of taking the warnings into account in decision-making(Reference Rojas-Rivas, Antúnez and Cuffia48). Habit and hedonic-related factors were also identified as motives underlying lack of consideration of nutritional warnings, in agreement with the relevance of pleasure in food choice(Reference Tuorila and MacFie49).
The characteristics of the products available in the marketplace are expected to influence the effect of warnings on purchase decisions. Participants mentioned the nutritional composition, sensory characteristics and price of the alternative options within the product category as reasons for not changing their purchase decisions when facing a product with warnings. This is in agreement with results from an experimental study showing category-specific effects of nutritional warnings in within-category product substitution( Reference Ares, Aschemann-Witzel and Curutchet9).
Some participants identified lack of familiarity with the policy as a reason for not taking the warnings into account in decision-making. Doubts over the meaning of the warnings and lack of habit for searching this information emerged from the responses. In this sense, it is important to highlight that at the time of the study, the Uruguayan government had not implemented a communication campaign to raise awareness and promote the use of nutritional warnings. Participants’ awareness of the policy was mainly due to media coverage or direct exposure to warnings on food products. Communication campaigns raising awareness of nutritional warnings and promoting their use in decision-making are expected to positively contribute to their efficacy(Reference Mørk, Grunert and Fenger19). Such campaigns are one of the WHO recommended interventions to reduce unhealthy diets(4). According to citizens’ accounts, communication campaigns should position the warnings as a cue to action for changing eating habits, raise awareness of the negative health consequences of excessive intake of sugar, fat and Na and stress the positive effects of avoiding consumption of products with excessive content of such nutrients(Reference Ares, Machín and Vidal50).
Limitations of the study
The main limitation of the present work was that it was conducted with participants recruited using Facebook and was not representative of the Uruguayan population. However, results can be regarded as a relatively accurate approximation, given the widespread use of Internet and social media in the country(32) and the diversity of participants included in the study, in terms of gender, age, educational level, socio-economic status and nutritional status based on self-reported weight and height. Further research should explore differences in awareness and use of nutritional warnings across the Uruguayan population.
The second limitation of the study is reliance on self-reported measures of use of the warnings. Further research should include observational studies to assess the use of the warnings at the point of purchase. Changes in the sales of products in terms of within-category product substitution and category abandonment should be assessed as part of the evaluation of the impact of warnings. However, it should be highlighted that it is not feasible to detect changes in product sales yet, given the short time period elapsed since full compliance with the warnings.
Finally, the current study relied on a before and after comparison to assess changes in the ability to understand nutritional information, and therefore the causality of the effect cannot be established. Nevertheless, results suggest an improvement in the ability of Uruguayan citizens to use nutritional information for making comparisons between products and for identifying products with excessive content of nutrients associated with NCD.
Conclusions and suggestions for further research
Results from the present work showed high awareness and self-reported use of nutritional warnings during the first month after the date of full compliance by the industry in Uruguay. In addition, a before and after comparison showed that the implementation of warnings increased citizens’ ability to interpret nutritional information. A key novelty of the research is that it was conducted immediately after the date of full compliance with the policy by the food industry, without the influence of any official communication campaign. This suggests that nutritional warnings, designed to be easily noticed and understood, may not require the implementation of communication campaigns to ensure consumer awareness, understanding and use. Warnings seem to easily capture attention at the point of purchase, encouraging approximately 60 % of the consumers to modify their decision. Further research should be conducted to assess the use of nutritional warnings at the point of purchase.
Results from the present work suggest that warnings may cause a salience bias towards the sugar, fat and sodium content of ultra-processed products, which can trigger changes in consumption. In this sense, nutritional warnings on food packages seem to have a similar mechanism of action than tobacco warnings. Further studies should explore the impact of the warnings on the associations raised by labels of ultra-processed products.
The findings from the present work confirm results from experimental studies conducted before the implementation of warnings in several countries(Reference Ares, Aschemann-Witzel and Curutchet9–Reference Grummon and Hall12,Reference Arrúa, Machín and Curutchet37–Reference Deliza, de Alcantara and Pereira39) . In addition, results provide additional evidence to support the decision of several Latin American countries to put forward regulations to compulsorily implement nutritional warnings as part of their strategies to tackle obesity and NCD.
Future research should evaluate if the use of nutritional warnings in decision-making is sustained over time and how the policy impacts sales across and within product categories and encourages the food industry to reformulate their products. So far, evidence of the impact of warnings is scarce, given that Chilean data do not enable to disentangle the effects of the different components of the law.
Acknowledgements
Acknowledgements: None. Financial support: Financial support was obtained from Instituto Nacional de Alimentación (Ministerio de Desarrollo Social, Uruguay), Espacio Interdisciplinario (Universidad de la República, Uruguay) and UNICEF Uruguay. Researchers from Instituto Nacional de Alimentación and UNICEF Uruguay were involved in the design of the study, interpretation of the data and preparation/review/approval of the manuscript. Conflict of interest: The authors declare no conflict of interest. Authorship: All authors contributed to the development of the research. G.A. and L.A. analysed the data. G.A. and L.A. prepared a first version of the paper, to which all other authors then contributed substantially. Ethics of human subject participation: The current study was conducted according to the guidelines laid down in the Declaration of Helsinki and all procedures involving human subjects. The experimental protocol was approved by the Ethics Committee of the School of Chemistry of Universidad de la República (Uruguay). Informed consent was obtained from all participants in an online form and formally recorded.
Supplementary material
For supplementary material accompanying this paper visit https://doi.org/10.1017/S1368980020002517


