


Introduction
The time elapsed between when water enters and exits a hydrologic catchment (often considered the transit time of the water; Reference McDonnellMcDonnell and others, 2010, and references therein) affects a range of activities from microbial processes (Reference Murphy and GinnMurphy and Ginn, 2000) to biogeochemical cycling (Reference Scanlon, Raffensperger and HornbergerScanlon and others, 2001). Further, such a catchment-scale transit time is influenced by both the characteristics and the climatic setting of the catchment itself (e.g. Reference Hrachowitz, Soulsby, Tetzlaff, Malcolm and SchoupsHrachowitz and others, 2010; Reference Lyon, Laudon, Seibert, Mörth, Tetzlaff and BishopLyon and others, 2010). For example at a specific location with uniform geology and climate, the slope and aspect of the land surface will exert a strong control over the amount of received energy and will potentially influence the transit time (Reference Broxton, Troch and LyonBroxton and others, 2009) and the hydrologic response (Reference Lyon, Desilets and TrochLyon and others, 2009). This is especially true in snow-dominated systems found within high-latitude high-altitude landscapes where the sun is lower on the horizon, which results in a greater contrast between the energy inputs of north- and south-facing slopes.
Snow processes are inherently coupled to the land surface slope and aspect, as the amount of incoming solar radiation affects the sensible and latent heat storage of the ground and/or the snowpack (Reference Gustafson, Brooks, Molotch and VeatchGustafson and others, 2010), the metamorphic processes within the snowpack (e.g. Reference Veatch, Brooks, Gustafson and MolotchVeatch and others, 2009), the redistribution of snow with wind, the timing and intensity of snowmelt (Reference Pomeroy, Toth, Granger, Hedstrom and EsseryPomeroy and others, 2003; Reference López-Moreno and LatronLópez-Moreno and Latron, 2008) and thus the amount of snow that is accumulated in the landscape (Reference Marsh, Pomeroy and SpiteriMarsh and other, 2012). The ability to characterize the variability and influence of aspect on snow water equivalent (SWE) and snowpack chemical composition in high-elevation seasonally snow-covered basins is important both for water resources (as snowmelt water can account for a large percentage of recharge; Reference Liu, Bales, Conklin and ConradLiu and others, 2008) and for evaluation of the hydrologic and hydrochemical response of high-elevation catchments (Reference Kattelmann and ElderKattelmann and Elder, 1991; Reference Gustafson, Brooks, Molotch and VeatchGustafson and others, 2010). Additionally, the loss of snow cover is a key trigger to terrestrial and aquatic biota (e.g. Reference MonsonMonson and others, 2006) through its role as an insulator controlling processes such as soil respiration and carbon sequestration. Field studies investigating such variability in snowpack height, SWE and isotopic composition are becoming more common (e.g. Reference Rodhe, Kendall and McDonnellRodhe, 1998; Reference Taylor, Feng, Kirchner, Osterhuber, Klaue and RenshawTaylor and others, 2001; Reference Gustafson, Brooks, Molotch and VeatchGustafson and others, 2010; Reference LeeLee and others, 2010); however, only a few such studies coincide with hydrologic catchments where detailed observations of cryosphere interactions have been made over long periods of time such that the resulting snowpack evolution and variability can be explicitly incorporated into, and used to test, existing catchment-scale conceptualizations and process-based understanding.
In this study, we present an initial characterization of snowpack density, SWE and isotopic variability with respect to aspect differences for the Tarfala research catchment in northern Sweden. We use a short (but detailed) series of observations to develop a first attempt at a conceptualization of aspect-driven pre-freshet hydrologic response in this catchment relevant for many high-latitude high-altitude landscapes. Seasonal snow-cover and snowpack evolution play a unique role in high-altitude catchment hydrochemistry, as a snowpack tends to accrue chemicals through wet and dry deposition over the snow accumulation season and rapidly releases them during melt (Reference Pomeroy, Jones, Tranter, Lilbæk, Anderson and McDonnellPomeroy and others, 2005) via the snowmelt ion pulse (Reference Bales, Davis and StanleyBales and others, 1989; Reference Cragin, Hewitt and ColbeckCragin and others, 1996; Reference Harrington and BalesHarrington and Bales, 1998). Thus, this observation series allows investigation of how the snowpack isotopic profile forms during the pre-freshet period and influences stream isotopic composition. Such pre-freshet snowpack isotopic evolution sets the stage for the resultant snowmelt pulse associated with spring freshet. The results have further implications for interpretations of catchment-scale shifts in hydrology seen both in the long-term records of observations and with ongoing hydrologic tracer experiments in Tarfala research catchment.
Methods
Study site
This study was performed in the 21.7 km2 Tarfala catchment (outlet at 67853′56′′ N, 18837′57′′ E), which is located east of the highest mountain in Sweden, Kebnekaise (2097 m a.s.l.; Fig. 1). The Tarfala catchment is characterized by high gradients and steep topography with an average slope angle of 218 and a local relief ranging from 980 to 2097 m a.s.l. The catchment is located in the discontinuous permafrost zone and is characterized by alpine heath vegetation in the valley bottom where patches of organic soils of shallow depth (∼5–10cm) mantle the bedrock and glacial tills. Currently about 30% of the catchment area is covered by glaciers, of which Storglaciären (2.9 km2) offers continuous mass-balance measurements since 1946 (Reference Holmlund, Jansson and PetterssonHolmlund and others, 2005). The hydrologic regime in the catchment is dominated by snow and glacier melt during the summer period (i.e. June-September). The long-term average day for the onset of snowmelt is 11 June based on the period 19692011. The regional climate in northern Sweden is cold and humid. Annual variability in temperature and precipitation is generally influenced by local topography and dominant weather patterns. The mean annual air temperature recorded at the Tarfala research station (TRS; 67°55′N, 18°37′E; 1135 m a.s.l.) for the period 1965–2009 is –3.4°C. The mean annual precipitation measured at the TRS has been estimated as 1997±450 mm, of which ∼400–600mm falls between June and August (Reference Dahlke, Lyon, Stedinger, Rosqvist and JanssonDahlke and others, 2012).

Fig. 1. Location of the Tarfala research catchment in northern Sweden, the climate station (near Tarfala research station), gauging stations (Lillsjon and Rannan), snow profiles (Sf and Nf slope) and meltwater sampling sites (Sf slope meltwater).
Snow and isotopic sampling
In May 2011 seven consecutive snow cores (one every 2–3 days between 7 May and 22 May) were taken on both a north-facing (Nf) and a south-facing (Sf) slope at the base of the glacial moraines surrounding lake Lillsjon in the Tarfala catchment near the TRS (Fig. 1). The two sites have a slope of 2° (Nf slope) and 38 (Sf slope) and an approximate slope length of 50 and 90 m, respectively. The snow cores were taken in approximately the same position (within 1 m at each site) and elevation (1120 m a.s.l.) using an 8 cm diameter Ice Drilling and Design Office (IDDO) snow corer. The retrieved snow cores were broken up into 15–25 cm long segments, with the interval depending on the stratigraphy of the snowpack. Each segment was bagged hermetically in plastic bags until laboratory analysis on the same day at the TRS. The snow density, p s (kgm−3), and the SWE (cm) were estimated based on the volume and weight of each core segment.
In addition to these segment measures of the snowpack physical characteristics, the snow-core segment samples were analyzed for stable water isotopic composition. Using oxygen or hydrogen isotopes of meltwater, streamwater and groundwater allows estimation of the contribution of snowmelt to freshet discharge through an isotopic hydrograph separation. During snowmelt the new water input typically used for hydrograph separation should be the meltwater exiting the base of the snowpack (Reference Rodhe, Kendall and McDonnellRodhe, 1998). The isotopic composition of meltwater is usually assumed to be the average composition of the snowpack, which is often obtained by melting a snow core (Reference Rodhe, Kendall and McDonnellRodhe, 1998; Reference Taylor, Feng, Kirchner, Osterhuber, Klaue and RenshawTaylor and others, 2001). However, as the snowpack becomes isothermal during the snowmelt period, the diurnal melt-freeze cycles result in an isotope exchange between the ice and meltwater in the snowpack, which leads to an isotopic enrichment of the meltwater contributed to streamflow (Reference Taylor, Feng, Williams and McNamaraTaylor and others, 2002). Thus, knowledge of the spatiotemporal variation of the snowpack and snowmelt isotopic composition is needed to reduce uncertainties in meltwater contributions to streamflow estimated through isotope hydrograph separations.
Snow samples were melted slowly in sealed plastic bags at 4°C at the TRS and the resulting snowmelt water was then bottled in 50 mL high-density polyethylene (HDPE) bottles with Polyseal caps until laboratory analysis at Stockholm University. To complement the snow-core isotopic samples, grab samples of streamwater were collected daily at the catchment outlet (i.e. Rannan) and at the Lillsjon gauging station at approximately 17:30 local time using 60 mL HDPE bottles (Fig. 1). In addition, at the same time as the snow coring on the Sf slope, a meltwater sample was collected at the base of the Sf slope ∼5 m below the coring location. All samples (both melted snow-core samples and liquid water grab samples) were kept refrigerated until laboratory analysis for stable water isotopes at Stockholm University. Samples were analyzed for their 18O/1 6O ratio and 2H/1H content (expressed as δ18O and δD) using a laser absorption spectrometer (Liquid-Water Isotope Analyzer DLT-100, Los Gatos Research Inc., Mountain View, CA, USA) with a precision of 0.15% and 0.6% for δ18O and δD, respectively. These δ18O and δdD contents are reported in % relative to Vienna Standard Mean Ocean Water (VSMOW). Weighted mean δ18O and δD values were calculated for each of the snow profiles. Values of SWE were determined for each core segment and multiplied by the observed isotopic concentrations. For each snow profile these products were integrated over the entire snowpack profile and divided by the total SWE of the snow profile to give a weighted average value (Reference Unnikrishna, McDonnell and KendallUnnikrishna and others, 2002).
Additional hydrometric and meteorological data
For the study period, discharge and meteorological data were available at 10 min resolution. Discharge was monitored at the outlet of Tarfala catchment at Rännan (67°53′56′′ N, 18°37′57′′ E) by means of a pressure transducer (unvented OnsetTM U20, 9 m ± 0.5 cm, Bourne, MA, USA) and a stage-discharge rating curve. Meteorological variables such as precipitation, average ventilated air temperature, relative humidity, wind speed and average global radiation were recorded at the Tarfala climate station (67°54′44′′ N, 18°36′46′′ E) located near the TRS at 1135 m a.s.l.
Results and Discussion
The study period of May 2011 was characterized by precipitation, discharge, air temperature, relative humidity, wind speed and average global radiation conditions shown in Figure 2. During the period 7–22 May 2011 a total of 45 mm of precipitation was recorded. Most of this precipitation fell as snow in three events after 16 May 2011. Daily minimum, maximum and mean air temperatures for this period were –6.3°C, 4.8°C and –0.6°C, respectively. Daily temperatures were above 0°C mainly during the first half of the study period. In response to this increase in temperature, discharge was slightly above the mean value for the study period of 0.05 m3s−1. The average maximum daily global radiation from 7 May through 22 May 2011 was 382 W m−2.
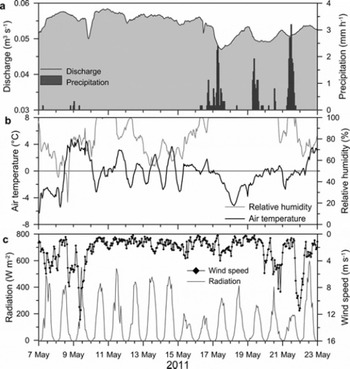
Fig. 2. (a) Hourly precipitation (grey bars) measured at the TRS and discharge measured at the outlet (Rannan) of Tarfala catchment. (b) Hourly ventilated air temperature (black line) and relative humidity (grey line) and (c) hourly global solar radiation (grey line) and wind speed (diamonds) measured at the TRS climate station for the study period 7–22 May 2011. The horizontal line in (b) highlights the 0°C temperature.
Snowpack physical characteristics
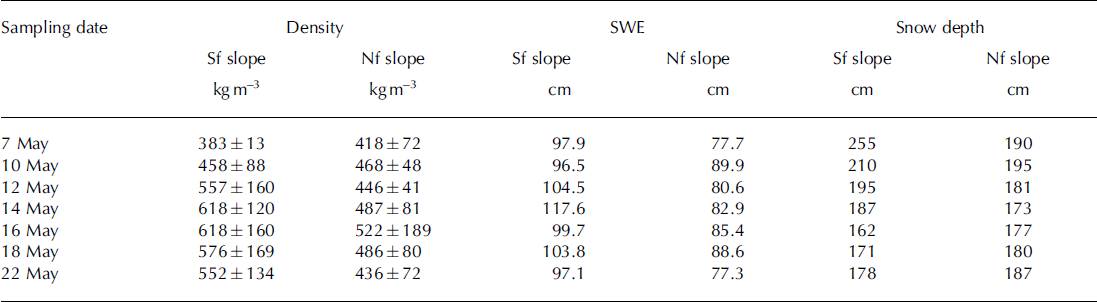
Figure 3 shows the variability in p s and SWE for both the Nf and Sf snowpack from 7 May to 22 May 2011. Table 1 summarizes the daily average snowpack density and total SWE for both the Nf and Sf snowpack. At the beginning of the study period both the Nf and Sf snowpack showed little variation in p s with depth. Despite having a greater snow depth (255 cm on 7 May 2011) the Sf snowpack showed a lower average p s of 383 ± 13 kgm−3 at the beginning of the study period than the shallower Nf snowpack (190cm on 7 May 2011), which had an average p s of 418 ± 7 2 kg m−3 (Table 1).
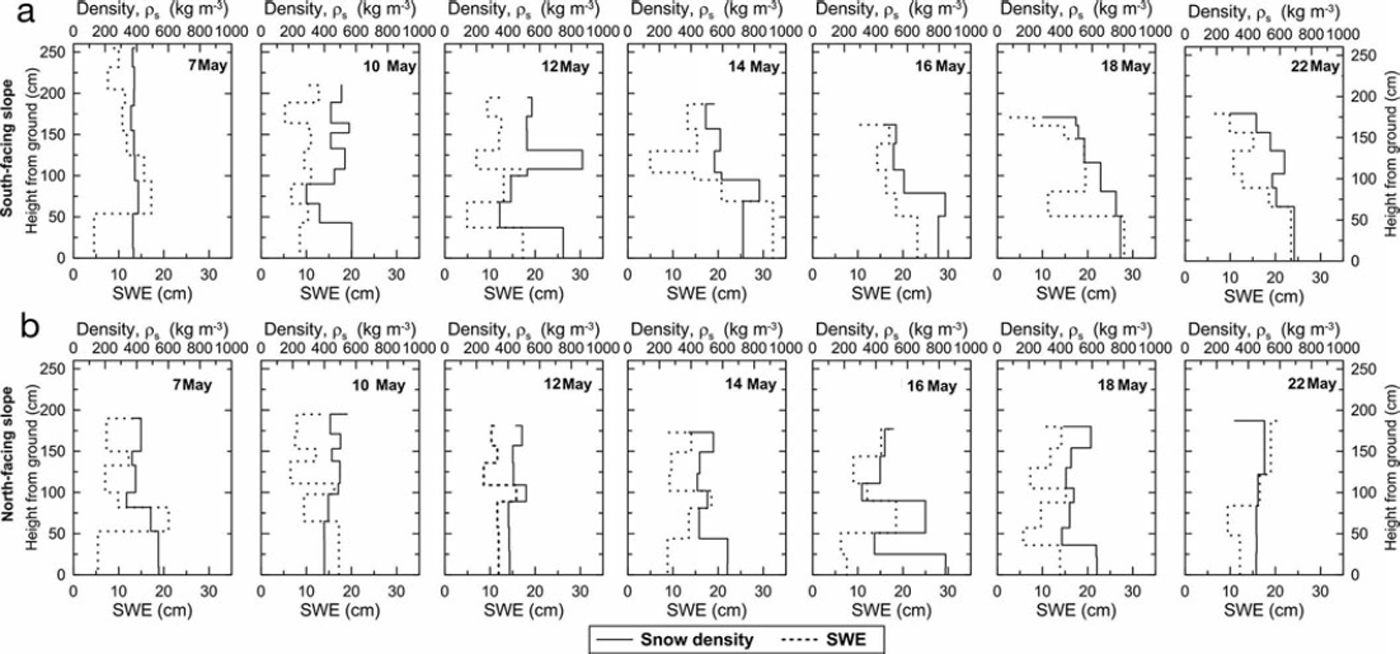
Fig. 3. Variability in snow density p s and snow water equivalent (SWE) for two snowpacks located on (a) a south-facing (Sf) and (b) a north-facing (Nf) slope in the Tarfala catchment for seven dates in May 2011.
Table 1. Average snow density p s (±1 SD), snowwater equivalent (SWE) and snow depth of two snowpacks located on a south-facing (Sf) and north-facing (Nf) slope in the Tarfala catchment for seven dates in May 2011
The Sf snowpack showed an increase in p s variability and clearly distinguishable layers with greater p s at 120 and 80 cm above ground during the period 7–14 May 2011. From 14 May 2011 onwards, however, the Sf snowpack showed a clear trend towards increasing p s with depth (Fig. 3). The Sf snowpack showed a consistent decrease in snow depth from 255 to 162 cm and a corresponding increase in the average p s from 383 to 618kgm−3 until 16 May 2011 followed by a decrease in p s to 552 kg m−3 and an increase in snow depth to 178cm until the end of the study period. The increase in average p s was partly due to formation of ice layers within the profile. Similarly, SWE increased from 97.9 cm at the beginning of the study period to 117.6 cm on 14 May 2011 and then decreased to 97.1 cm at the end of the study period. From 14 May 2011 onwards the snow at the base of the Sf snowpack (i.e. within 20 cm above ground) was saturated with meltwater as indicated by the high ps values (Fig. 3).
In contrast, the Nf snowpack showed little increase in p s variability over the entire study period, except on 16 May 2011 when the Nf snowpack reached its greatest average p s of 0.52 ± 0.19 kg m−3 and thus exhibited a clearly visible increase in p s with depth into the snowpack (Table 1). This corresponds in time to the occurrence of the first precipitation event occurring during the study period (Fig. 2). The average snowpack p s and SWE of the Nf snowpack showed no clear increasing or decreasing trends over the study period, with average values varying around 470 ± 40 kgm−3 and 83 ± 5 cm, respectively. Over the study period the Nf snowpack did not show signs of saturation or capillary uptake at the base of the profile due to running meltwater (with the possible exception of the 16 May 2011 sampling). The Nf snowpack showed some signs of depth hoar at ∼100cm above the base.
Snowpack isotopic characteristics
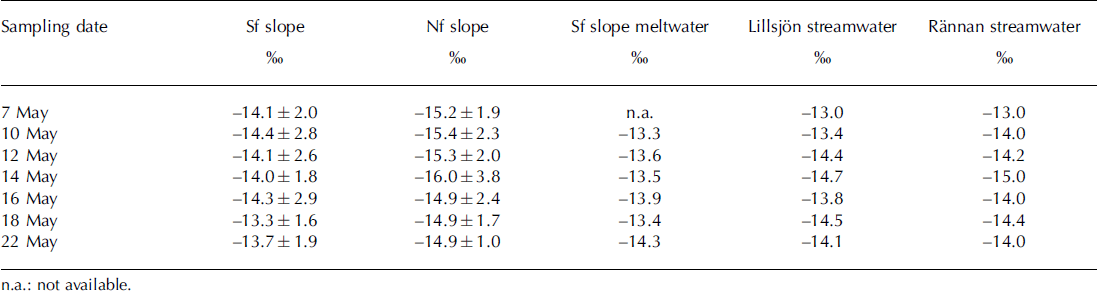
Figure 4 shows the δ18O and δD for the Nf and Sf snow profiles for seven dates between 7 and 22 May 2011. In Figure 4 the lines represent the meltwater δ18O collected at the base of the Sf slope, the streamwater δ18O collected at the Lillsjon gauging station and the catchment outlet (Rannan) and the weighted average δ18O value of each snow profile. Table 2 lists the weighted mean δ18O values for each sampling date of both the Nf and Sf snowpack, the isotopic composition of the meltwater collected at the base of the Sf slope and the streamwater collected at the Lillsjon gauging station and the catchment outlet. The total population of δ18O and δD values observed in the Sf snowpack was significantly different (p<0.01, two-sided t test at a significance level of 1%) from the isotope values observed in the Nf snowpack. The δ18O values within the Sf snowpack were generally more enriched, and varied between –18.7% and –8.7% over the study period, with a mean value of –13.8 ± 2.2% (Table 2). In contrast, the Nf snowpack showed consistently more depleted values and varied between –23.5% and –11.1%, with a mean of –15.3 ± 2.2% (Table 2). Over the entire study period, the Sf snowpack showed a consistently larger range of isotopic values than the Nf snowpack, potentially indicating more pronounced isotopic redistribution (Fig. 4).
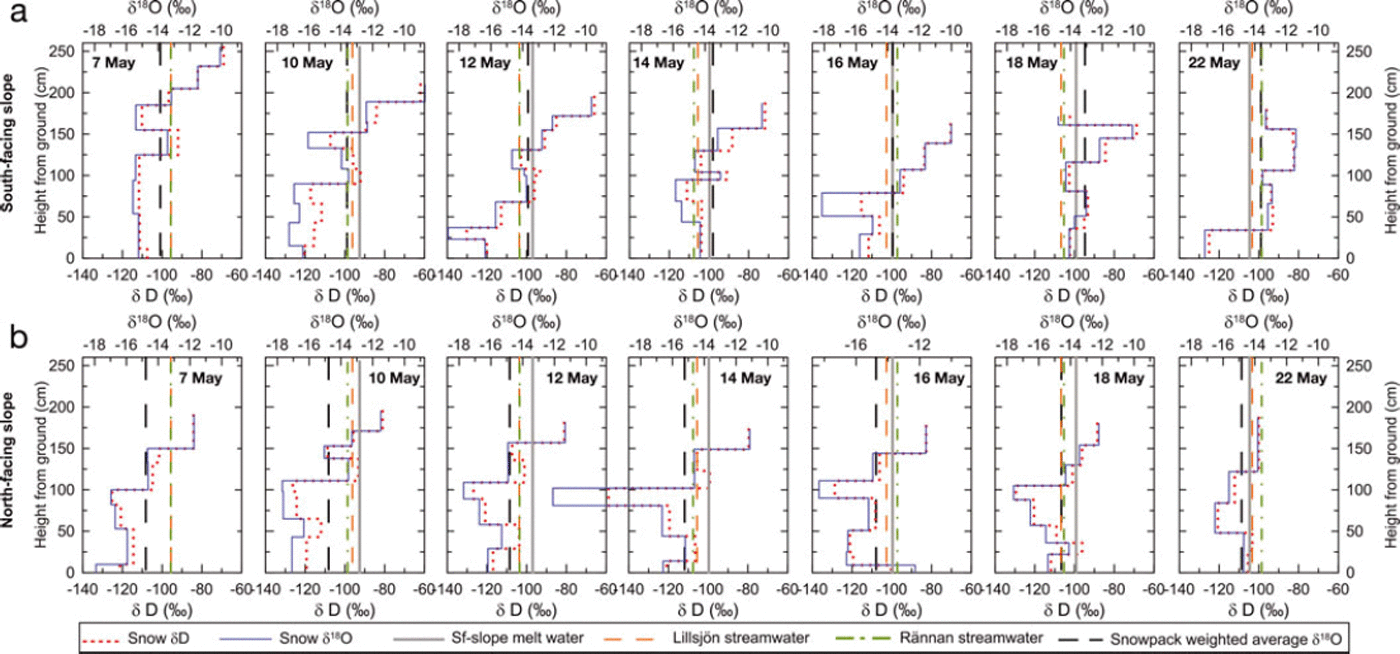
Fig. 4. Isotopic evolution of two snowpacks located on (a) a south-facing (Sf) and (b) a north-facing (Nf) slope in the Tarfala catchment for seven dates in May 2011. Step plots show the δ18O (blue solid line) and δD profiles (red dotted line). The vertical lines represent the meltwater δ18O collected at the base of the Sf slope (grey solid line), the streamwater δ18O collected at the Lillsjon gauging station (orange dashed line) and the catchment outlet Rännan (green dashed/dotted line) and the weighted average δ18O value of each snow profile (black dashed line).
Table 2. Statistical summary of the δ18O isotopic composition of the two snow profiles (Sf slope and Nf slope) (weighted averages), the meltwater collected at the base of the Sf slope, and streamwater collected at the Lillsjön gauging station and the catchment outlet (Rännan)
Although the distribution of isotope values within each snowpack showed a characteristic decrease from the top to the bottom of the snowpack profile, comparison of the isotopic composition between the Nf and Sf snowpack (and their respective evolution over time) highlights several main differences. As illustrated in Figure 4, the decrease in isotope values with depth into the snowpack was more pronounced in the Sf snowpack than in the Nf snowpack. There was a clear difference in the depth over which the decrease in isotope values occurred, with a greater range of decrease into the Sf snowpack than into the Nf snowpack (Fig. 4). Also, prior to the first precipitation event occurring on 16 May 2011, the snow at the surface of the Sf snowpack exhibited isotopic compositions between about –10% and –8% for δ18O. Counter to this, the surface of the Nf snowpack was consistently about 2–3% more negative for δ18O. This indicates that the top the Sf snowpack was isotopically more enriched relative to the top of the Nf snowpack during the period before the precipitation event on 16 May 2011. This is also supported as the isotopically depleted new snow (e.g. on 16–17 May 2011 with δ18O = –17.2%) became heavier (δ1 8O=–13.3%) within just 5 days after deposition for the Sf slope, while not much change was seen for the Nf slope after this precipitation event (Fig. 4).
Over the course of the study period the weighted mean δ18O value of both snowpacks became isotopically heavier (Table 2). The Sf snowpack showed clear signs of isotopic redistribution within the snowpack via percolating meltwater and isotopic enrichment at the base of the snowpack due to loss of isotopically lighter meltwater as lateral runoff. Counter to this, the Nf snowpack showed mean weighted isotope values that were ∼0.6–2.0% more negative than the values observed in the Sf snowpack. Over the course of the study period, however, the mean weighted isotopic composition of the Nf snowpack (and particularly that of the base of the Nf snowpack) approached the mean weighted isotopic composition observed in the Sf snowpack.
At the beginning of the study period, the isotopic composition of streamwater collected at the Lillsjon gauging station was less depleted than the δ18O values observed at the base of either the Nf and Sf snowpack or the weighted mean δ18O values for either snowpack. Over the study period, however, the streamwater isotopic composition at Lillsjon and at the catchment outlet became more similar to the isotopic composition of the Sf snowpack base. Towards the end of the study period the Sf snowpack weighted mean δ18O value was isotopically more enriched than the streamwater isotopic composition collected at either Lillsjon or the catchment outlet. In contrast, the weighted mean δ18O values of the Nf snowpack were consistently lower than the isotopic composition of the streamwater collected at Lillsjon and the catchment outlet. Based on three streamwater samples collected in January and mid-March, when discharge was lowest and presumably dominated by groundwater-derived base flow, a median isotopic value of –13.66% was observed (Reference Dahlke, Lyon, Jansson, Karlin and RosqvistDahlke and others, 2013). A comparison of the mean weighted δ18O values of either snowpack with the streamwater isotopic composition suggests that snowmelt contributions were small at the beginning and increased towards the end of the study period (Table 2).
Developing a conceptual framework for early-period snowmelt
There was a clear enrichment in stable water isotopes in both snowpacks moving towards the surface of the snowpacks (Fig. 4). Similar to other studies this isotopic enrichment can be attributed largely to isotopic redistribution and fractionation of water isotopes in the surface layers of the snowpacks due to evaporation or sublimation and percolation of isotopically lighter meltwater into the snowpack (e.g. Reference Colbeck and ChowColbeck, 1978; Reference Moser, Stichler, Fritz and FonteMoser and Stichler, 1980; Reference Taylor, Feng, Kirchner, Osterhuber, Klaue and RenshawTaylor and others, 2001, Reference Taylor, Feng, Williams and McNamara2002; Reference Feng, Taylor, Renshaw and KirchnerFeng and others, 2002; Reference Zhou, Nakawo, Hashimoto and SakaiZhou and others, 2008). Isotopic enrichment due to these processes was particularly visible in the Sf snowpack where isotopically depleted new snow became enriched in heavy isotopes by >4% within 5 days. Since both snowpacks were located at the same elevation in close proximity to each other, the observed increase in 18O cannot result from altitudinal or temporal variation in the precipitation isotopic composition. In addition, similar to the findings of Reference Moser, Stichler, Fritz and FonteMoser and Stichler (1980) both snowpacks formed a distinct natural profile of isotopic composition that was maintained during the onset of the pre-freshet melt in this system. The snowpacks on the Sf and Nf slopes, however, showed a statistically significant difference in their mean weighted isotopic composition, indicating temporal differences in the degree to which isotopic fractionation due to melting–freezing mass exchange occurred. As such, there were spatio-temporal differences in the contribution of meltwater to streams within Tarfala valley over this period. The influence of these differences can be seen in the resulting streamwater isotopic composition (Fig. 4; Table 2).
The comparison of snowpacks and their isotopic profiles on slopes with opposing aspects can feed into the development of a conceptualization of the early-period snowmelt at Tarfala valley. During early melt periods when the average daily temperature is still low, melting occurs primarily on sun-exposed slopes as these slopes receive the largest influx of solar radiation. For the Tarfala valley and other northern-latitude systems with steep topography, these areas correspond to southern-facing slopes. Further, since the angle of the sun is still low during the pre-freshet periods, isotopic redistribution and fractionation within a snowpack and meltwater formation occur predominately on Sf slopes with greater slope angles and thus greater insolation. In the present study, this corresponds to the upslope areas of the Sf slope. As this meltwater makes its way downslope towards the stream, it flows largely at the ground-surface–snowpack interface due to the typically frozen subsurface conditions. This concentrated lateral flux of isotopically enriched meltwater mixes with meltwater generated in situ that has percolated through the snow column of downslope snow-packs. Eventually, this mixed snowmelt water is contributed to the stream only if the concentrated lateral meltwater flux from Sf upslope areas connects to the stream via, for example, preferential flow pathways. As the freshet period progresses, meltwater production from Sf upslope areas will increase and expand downslope to areas with smaller slope angles (e.g. footslopes) and longitudinally across slopes (e.g. to slopes with more southeasterly and southwesterly aspects), resulting in a progressive contribution of isotopically enriched meltwater from a relatively small but actively melting portion of the catchment.
Counter to this, Nf slopes remain largely shadowed throughout the freshet period due to the low angle of the sun. Thus, the Nf snowpack primarily sees a metamorphic and isotopic evolution of the snowpack without large meltwater generation during the same periods when the Sf slopes are actively melting. However, the Nf snowpack contributes isotopically enriched meltwater towards the end of the freshet period when snowpacks in Sf positions have melted away. This is seen in the Nf slope in this study, which experiences little change in SWE and snow density over the period considered. Rather, there is isotopic fractionation and redistribution in its profile due to melting–freezing mass exchange (Reference Zhou, Nakawo, Hashimoto and SakaiZhou and others, 2008) that causes enrichment in the mean weighted isotopic composition of the snowpack such that it approaches isotopic values similar to those observed in the Sf snowpack.
This simple conceptualization is confirmed by observations at the catchment outlet and supports the applicability of a distributed snowmelt source area model for the Tarfala catchment. In this study the isotopic composition of the streamwater, which integrates meltwater from both the Nf slope (contributing little) and Sf slope (contributing much) during the period of observation, follows the isotopic composition seen at the base of the Sf slope. Consistent with the previous conceptualization, this isotopic composition at the base of the Sf slope is similar to, and controlled by, the vertical flux of isotopically enriched meltwater through the snow column and the lateral flux of snow meltwater from Sf upslope areas. This indicates that the water going into the stream during this early melt season period comes predominantly from southern-facing slopes and looks isotopically like a mixture of meltwater percolating through snow column and meltwater from upslope areas flowing at the ground-surface–snowpack interface. At the catchment scale, this potentially means that the source and amount of meltwater contributed to streams during the prefreshet (and potentially the freshet) period can be represented by three fundamental groups of processes: (1) processes controlling the mass balance and isotopic evolution of an individual snowpack (i.e. energy balance); (2) processes controlling the flow pathways by which meltwater is transported at the ground-surface–snowpack interface from melting areas to streams (e.g. topography); and (3) processes controlling the expansion of meltwater-producing areas over time. Processes in (1) are well conceptualized, for example by one-dimensional models that simulate the isotopic composition of meltwater exiting the base of a snowpack (e.g. Reference JordanJordan, 1991; Reference Taylor, Feng, Kirchner, Osterhuber, Klaue and RenshawTaylor and others, 2001, Reference Taylor, Feng, Williams and McNamara2002; Reference Feng, Taylor, Renshaw and KirchnerFeng and others, 2002) or by distributed energy-balance-based melt models such as Alpine3D (Reference Lehning, Völksch, Gustafsson, Nguyen, Stähli and ZappaLehning and others, 2006). However, the accuracy of distributed energy-balance snowmelt models in predicting snowmelt source areas across a landscape does not necessarily match the accuracy that these models achieve when simulating the timing and magnitude of the ionic pulse. Based on the conceptual understanding of spatio-temporal snowmelt processes in the Tarfala catchment gained from this isotope study, we believe that distributed snowmelt models can be improved by coupling the existing energy-balance approaches with the topography-based partial area concepts (e.g. Reference Engman and RogowskiEngman and Rogowski, 1974; Reference Dahlke, Easton, Fuka, Lyon and SteenhuisDahlke and others, 2009) of runoff generation. This concept, which could be realized in a GIS-based modelling framework, would allow the more accurate identification of snowmelt hotspots (i.e. Sf slopes with high insulation) and their spatial expansion over time, while at the same time allowing for a more realistic routing of the concentrated lateral flux of meltwater to streams via, for example, a topographic index approach (Reference Beven and KirkbyBeven and Kirkby, 1979; Reference Lyon, Walter, Gérard-Marchant and SteenhuisLyon and others, 2004).
Concluding Remarks
This study presents an investigation of the isotopic variability and evolution for the snowpack of two distinct slopes, a north- and a south-facing slope, within the Tarfala catchment. Aspect was found to be a strong control on the pre-freshet snowpack isotopic evolution and early season meltwater generation. The investigation could be incorporated into the development of a conceptual framework of spatio-temporal snowmelt dynamics. Such a conceptualization is a first step towards the development of an improved understanding of spatio-temporal snowmelt processes and their conceptualization in distributed snowmelt models. This is relevant for the estimation of snowmelt contributions to streamflow and identification of snowmelt source areas within the Tarfala catchment and (potentially) other high-latitude high-altitude landscapes.
Acknowledgements
We thank Torbjörn Karlin for his assistance in the field and the Swedish Society for Anthropology and Geography for funding. We also thank Tarfala research station for invaluable logistical support and the Delta Facility of Stockholm University for the isotope analysis.


