


I. INTRODUCTION
The successful experimental isolation of single-layer two-dimensional (2D) graphene in 2004 has sparked surging interests in this class of carbon-based nanomaterials. Reference Novoselov, Geim, Morozov, Jiang, Zhang, Dubonos, Grigorieva and Firsov1 With their unique 2D structural feature and outstanding physicochemical properties, Reference Novoselov, Jiang, Schedin, Booth, Khotkevich, Morozov and Geim2–Reference Dreyer, Todd and Bielawski9 notably exceptional electrical conductivity, outstanding thermal conductivity, excellent mechanical strength, versatile surface chemistry, and high biocompatibility, graphene and its derivatives have been actively explored for a wide range of potential applications, spanning from nanoelectronics and energy to nanobiotechnology and biomedicine. Reference Novoselov, Falko, Colombo, Gellert, Schwab and Kim10–Reference Georgakilas, Tiwari, Kemp, Perman, Bourlinos, Kim and Zboril15 Specifically for biological and biomedical applications, such as biosensing, bioimaging, drug delivery, and tissue engineering and regenerative medicine, graphene and its derivatives, particularly graphene oxide (GO) and reduced graphene oxide (rGO), have been demonstrated to be highly promising. Reference Feng and Liu16–Reference Ng, Kenry, Teck Lim, Low and Loh24
While active research and scientific activities have been devoted to unravel more unknown physicochemical properties and potential bioapplications of graphene nanomaterials, parallel efforts have been ramped up recently to gain deeper insights into their overall biological effects, especially their biocompatibility and nanotoxicological profile, through their interactions with various biological moieties. Although information on the in vitro and in vivo nanotoxicity of graphene nanomaterials has been increasingly published in the last several years, Reference Zhang, Yang, Feng and Liu25–Reference Kenry, Chaudhuri, Loh and Lim33 a complete picture on the biocompatibility of graphene nanomaterials has not been established. As graphene nanomaterials are anticipated to play a substantial role in enabling advanced technologies in nanomedicine and bionanotechnology, a comprehensive understanding of the biocompatibility of these engineered nanomaterials, in particular their hemocompatibility with various blood constituents, is necessary.
Blood is one of the most important biological fluids in the physiological systems. With a volume of approximately 5 L in a human adult, it constitutes about 7–8% of the total body weight. Constituently, blood comprises blood cells [i.e., red blood cells (RBCs) or erythrocytes, white blood cells (WBCs) or leukocytes, and platelets] (45%) suspended in protein-rich plasma (55%). Furthermore, blood plasma is fundamentally an aqueous body consisting of approximately 92% water and 8% plasma proteins. Each of these blood components possesses distinct and specific biological functions. For instance, RBCs maintain the regulation of oxygen and nutrient transports to different tissues and organs, WBCs facilitate the defense and fight against infections and foreign bodies, platelets are responsible for the regulation of blood coagulation process, blood plasma acts as the primary medium in removing various metabolic and excretory products.
In general, most of the in vivo bioapplications of graphene nanomaterials require their administration into the blood circulatory system. Because of this, graphene nanomaterials will unavoidably be exposed to the surrounding biomolecules and cells in the circulatory system, notably plasma proteins and blood cells. Interestingly, the molecular and cellular interactions of graphene nanomaterials with these hematological moieties are crucial as the hematological response toward graphene nanomaterials and the overall efficacy of graphene nanomaterial-based bioapplications will be dependent on these nano-bio interactions. As such, an in-depth understanding of the hemocompatibility and hemotoxicological profile of graphene nanomaterials is essential for their development and optimization for specific bioapplications as well as for their effective translation into practical and clinical utility.
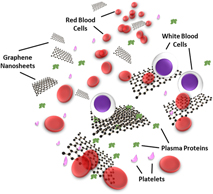
Motivated by this, this review presents a broad overview on the recent advances on the hemocompatibility and hemotoxicity of graphene nanomaterials through their interactions with blood proteins and cells (Fig. 1). To start with, various physicochemical properties of graphene nanomaterials crucial in affecting their hemocompatibility and hemotoxicity are discussed. Subsequently, the nano-bio interactions of graphene nanomaterials with different serum proteins and blood cells are highlighted. This review then concludes with a summary and offers some perspectives on the current challenges, opportunities, and future development of this crucial field.
Nano-bio interactions of graphene nanomaterials with various blood plasma proteins and cells.

II. PHYSICOCHEMICAL PARAMETERS INFLUENCING THE HEMOTOXICITY OF GRAPHENE NANOMATERIALS
As the earliest 2D nanomaterials to be experimentally isolated, Reference Novoselov, Geim, Morozov, Jiang, Zhang, Dubonos, Grigorieva and Firsov1 graphene and its derivatives possess numerous outstanding physicochemical properties, Reference Novoselov, Jiang, Schedin, Booth, Khotkevich, Morozov and Geim2–Reference Dreyer, Todd and Bielawski9 such as excellent electrical conductivity, robust mechanical strength, versatile surface chemistry, excellent biocompatibility, and minimal cytotoxicity. In fact, the unique features and versatility of graphene nanomaterials have motivated their active exploitations for a wide variety of biological and biomedical applications. Reference Feng and Liu16–Reference Ng, Kenry, Teck Lim, Low and Loh24 Nonetheless, in spite of the significant potential they have in advancing the fields of nanobiotechnology and nanomedicine, several concerns exist and require in-depth investigations before the proof-of-concept applications can be further improved and translated.
One of the most critical and growing concerns revolves around the biocompatibility and nanotoxicity of graphene and its related nanomaterials. Reference Yang, Li, Tan, Peng and Liu34,Reference Kenry and Lim35 In fact, the nanotoxicity of graphene nanomaterials has been increasingly assessed in recent years. Reference Zhang, Yang, Feng and Liu25–Reference Kenry, Chaudhuri, Loh and Lim33 For example, the in vitro evaluations of the potential cytotoxic effects of graphene nanomaterials have been actively conducted on different human cell lines, Reference Zhang, Yang, Feng and Liu25,Reference Liao, Lin, Macosko and Haynes36–Reference Mullick Chowdhury, Lalwani, Zhang, Yang, Neville and Sitharaman41 such as human fibroblasts, human umbilical vein endothelial cells (HUVEC), normal human lung cells (BEAS-2B), human lung cancer cells (A549), human hepatocarcinoma cells (HepG2), HeLa cells, and human breast cancer cells MCF-7. A majority of these investigations have demonstrated the time- and dose-dependent cytotoxicity of graphene nanomaterials. Furthermore, numerous in vitro experimental and theoretical investigations have attributed the cytotoxicity of both graphene and its oxygenated derivative GO on mammalian cells and bacteria to cellular membrane penetration, followed by phospholipid molecule extraction from the lipid bilayer. Reference Li, Yuan, von dem Bussche, Creighton, Hurt, Kane and Gao42,Reference Liu and Chen43
A small number of in vivo studies have also previously demonstrated that after intravenously administered into rats or mice, GO accumulated in lungs for a prolonged period of time, displayed dose-dependent pulmonary toxicity, and caused lung granuloma death. This shows that, while graphene nanomaterials possess tremendous potential for bioapplications, they may also induce undesirable toxicity under certain conditions. As such, before progressing to realize their possible bioapplications, a thorough understanding of their nanotoxicological profile, in particular their hemotoxicity, is necessary. Nonetheless, due to the novelty of this family of nanomaterials, up to date, limited studies have been performed on elucidating the hemocompatiblity of graphene nanomaterials. The safety information on graphene nanomaterials is, therefore, considerably scarce, and their hemotoxicological profile is still far from being established. It is also important to note that it may not be possible to infer the hemocompatibility and hemotoxicity of graphene nanomaterials directly from their bulk graphite counterpart. This is because the interactions between graphene nanomaterials and biological moieties are distinct and significantly influenced by numerous physicochemical characteristics of nanomaterials. These include lateral size, shape, dose, exposure time, number of layers, chemical composition, surface charge, stability, purity, and surface functionality of graphene nanomaterials (Fig. 2).
Physicochemical parameters influencing the hemotoxicity of graphene nanomaterials. These parameters include size, shape, dose, number of layers, chemical composition, surface charge, stability, purity, and surface functionality of graphene nanomaterials as well as the time the biological entities are exposed to these nanomaterials.
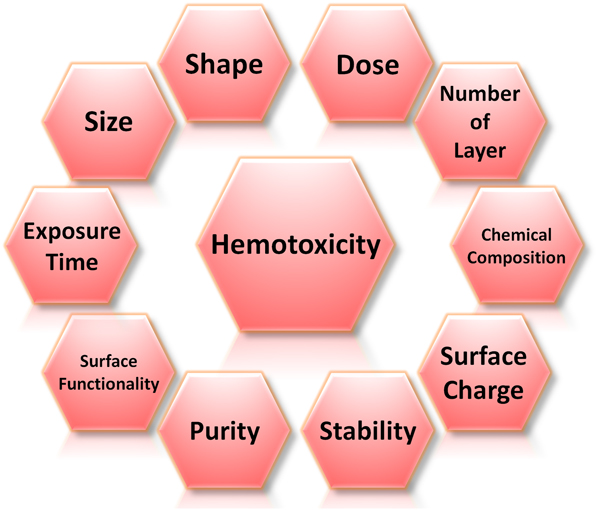
In fact, these physicochemical parameters of graphene nanomaterials have been identified as one of the primary elements driving the occurrence of numerous molecular and cellular mechanisms triggering their blood toxicity. Intriguingly, the physicochemical features of graphene nanomaterials are highly interdependent, and certain properties can be tuned via the manipulation of other parameters. For instance, the chemical modifications of graphene nanomaterials to endow them with different surface functionalities have been reported to vary their surface charge, stability, and purity to a certain degree. As such, the physicochemical characteristics of graphene nanomaterials possess an active role in directing their hemocompatiblity and hemotoxicity.
III. INTERACTIONS OF GRAPHENE NANOMATERIALS WITH SERUM BIOMOLECULES AND BLOOD PROTEINS
The effective utilization of graphene nanomaterials for a variety of biological and biomedical applications requires an in-depth understanding of their hemocompatibility and hemotoxicological profile. The use of graphene nanomaterials for a majority of in vivo biomedical applications, especially through intravenous, intramuscular, or intraperitoneal administration into living bodies, will inevitably require them to enter the blood circulatory system. As a result, these nanomaterials will be exposed to biological fluids, including serum and plasma, and interact immediately with various hematological components and vasculature. In fact, upon entering the bloodstream microenvironment, a large number of serum biomolecules and plasma proteins will interact with the graphene nanomaterial surface. Depending on the nanomaterial properties, these interactions will manifest as a specific or a combination of different associations, such as hydrophobic π–π stacking, electrostatic interaction, hydrogen bonding, and covalent bonding. Interestingly, the graphene–biomolecule associations will, in turn, affect and alter the physicochemical properties of graphene nanomaterials significantly and endow them with new biological characteristics. Indeed, these events will be decisive in influencing the eventual fate of graphene nanomaterials in physiological systems as well as the subsequent biological responses toward them.
While graphene nanomaterials stand out among the wide array of 2D nanomaterials Reference Kenry and Lim35,Reference Kenry, Geldert, Lai, Huang, Yu, Tan, Liu, Zhang and Lim44–Reference Geldert, Kenry, Zhang, Zhang and Lim46 and have been regarded as highly attractive for a plethora of biomedical applications, the fundamental mechanisms driving the graphene-protein associations and the physiological effects of graphene nanomaterials on proteins, particularly on their conformational stability as well as physiological activities, are still poorly understood. A comprehensive understanding of these aspects is thus essential for identifying the undesirable adverse effects of graphene nanomaterials, establishing the potential risks of graphene nanomaterials, and importantly, avoiding their manifestations in biological systems. In fact, carbon nanomaterials have been shown to destabilize and perturb the native protein conformations under particular conditions, which may evoke certain undesirable biological effects, such as protein aggregation and increased reactive oxygen species (ROS) generation.
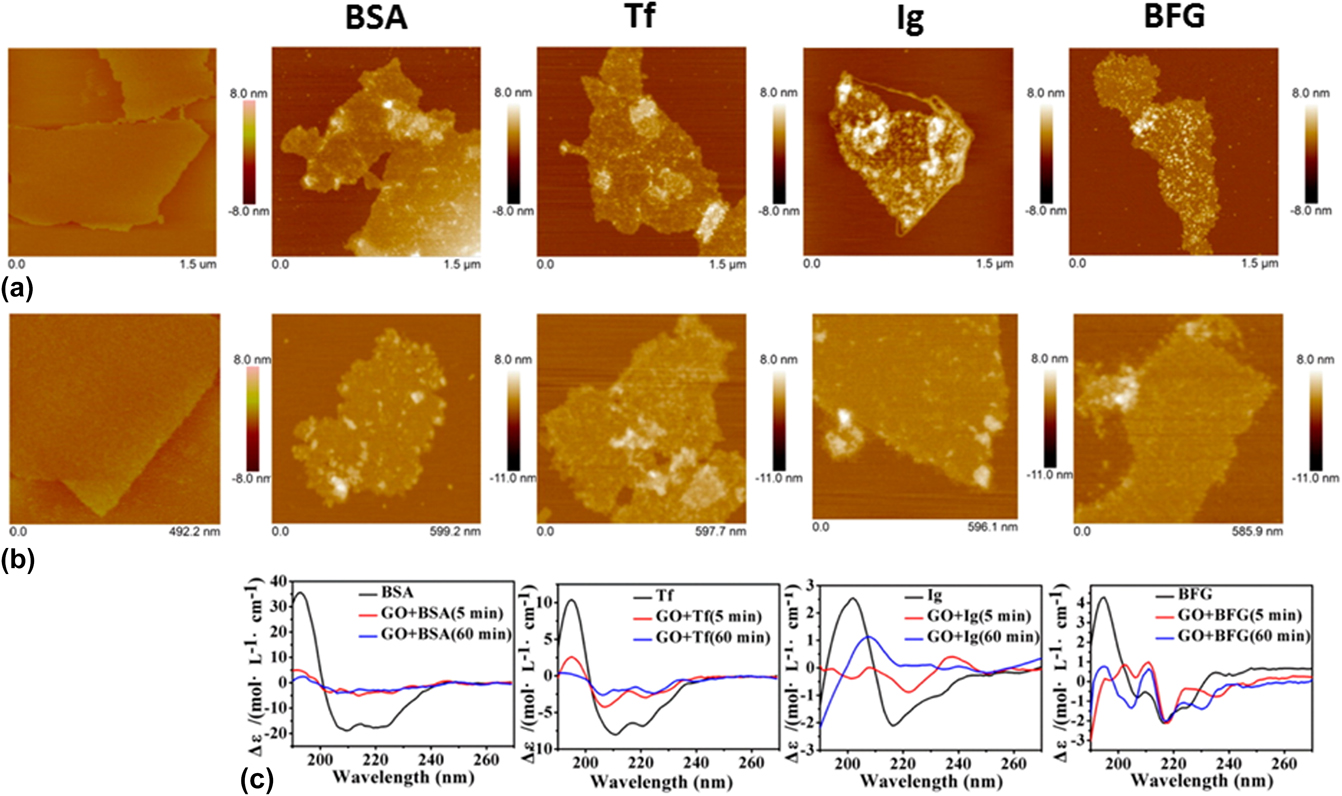
Encouragingly, an increasing number of studies aiming to characterize the graphene–protein interactions have been actively reported in the last few years. Reference Chong, Ge, Yang, Garate, Gu, Weber, Liu and Zhou47–Reference Gu, Yang, Wang, Zhou, Jimenez-Cruz and Zhou53 For example, a recent study investigated the adsorption of the four most abundant serum proteins, i.e., bovine serum albumin (BSA), transferrin (Tf), immunoglobulin (Ig), and bovine fibrinogen (BFG) on two graphene nanomaterials, i.e., GO and rGO nanosheets (Fig. 3). Reference Chong, Ge, Yang, Garate, Gu, Weber, Liu and Zhou47 It was reported that these proteins displayed distinct adsorption behaviors on the nanosheet surfaces. BSA, for instance, formed complex aggregates upon its first interaction with GO [Fig. 3(a) BSA]. Furthermore, these aggregates spread uniformly over the surface of GO and display a negligible change over time [Fig. 3(b) BSA]. This was further observed from the circular dichroism (CD) spectra of BSA before and after interacting with GO. More clearly, the CD spectrum of BSA varied significantly after only a 5-min incubation with GO [Fig. 3(c) BSA]. The α-helical feature of BSA reduced while its β-sheet characteristic enhanced considerably, suggesting that β-rich aggregates formed on the GO surface. A longer incubation with GO did not vary the CD spectrum of BSA, implying that the BSA adsorption had reached a thermodynamic equilibrium. Tf also displayed an adsorption behavior similar to that of BSA [Figs. 3(a) and 3(b) Tf], with a significant enhancement to the β-sheet characteristic, as observed from the adsorbed Tf aggregates on the GO surface [Fig. 3(c) Tf]. Similar to BSA and Tf, both Ig and BFG molecules adsorbed and spread uniformly on GO surfaces upon their initial interactions [Fig. 3(a) Ig and BFG]. However, over time, their uniform adsorption behavior shifted to one that was more heterogeneous [Fig. 3(b) Ig and BFG]. In fact, the CD spectra of both Ig and BFG varied dramatically over time from 5 to 60 min, indicating the structural heterogeneity on GO surfaces [Fig. 3(c) Ig and BFG]. BSA and BFG were observed to have the lowest and highest binding affinity with GO, respectively. The binding affinities of Ig and Tf with GO, meanwhile, were in between those of BSA and BFG. The difference in the adsorption behaviors of the serum proteins on GO surfaces was ascribed to the structural variations of the native proteins and the prevalence of the surface-exposed residues. Furthermore, the strong serum protein adsorption on the GO surface was enthalpically driven via hydrophobic interactions and essentially, strong π–π stacking interactions between the aromatic protein residues and GO surface. Crucially, this study demonstrated that the four serum proteins could adsorb on the graphene nanomaterial surface competitively to induce the formation of protein-coated graphene nanomaterial complexes, which might fundamentally change their cellular interaction pathways and, importantly, decrease their effective cytotoxicity.
Interactions of GO nanosheets with different proteins, i.e., BSA, Tf, Ig, and BFG. (a, b) Surface morphology of GO nanosheets (first column) and different GO-protein complexes (subsequent columns) after incubations with GO nanosheets for (a) 5 min and (b) 60 min, as obtained using atomic force microscope. (c) CD spectra of the corresponding GO-protein complexes. Adapted with permission from Ref. Reference Chong, Ge, Yang, Garate, Gu, Weber, Liu and Zhou47. Copyright 2015 American Chemical Society.
Separately, GO has been demonstrated to possess a high loading capacity for albumin and fibrinogen in a recent work. Reference Kenry, Loh and Lim48 Both plasma proteins were noted to adsorb well on the GO surface. Nevertheless, while the secondary structure and conformational stability of adsorbed albumin were minimally perturbed upon its interaction with GO, those of fibrinogen were significantly disrupted. Interestingly, these interactions between plasma proteins and GO may be significantly dependent on its physicochemical parameters, as increasingly being reported. For example, in one of the latest studies, the interactions between GO nanosheets with different lateral size and size distribution and three essential human plasma proteins, i.e., albumin, globulin, and fibrinogen, were investigated. Reference Kenry, Loh and Lim49 It was revealed that these nano-bio interactions were protein-specific and might be considerably influenced by the mean lateral size and size distribution of GO nanosheets. In addition, the surface chemistry of graphene nanomaterials may be crucial in determining their hemotoxicity and biocompatibility. As such, it is anticipated that graphene nanomaterials with different surface functionalities will exhibit different toxicological profiles. This was shown in a recent report which investigated the in vitro hemocompatiblity of GO modified with different surface functionalities, i.e., p-GO, GO-COOH, and GO-PEI, with human serum albumin (HSA). Reference Ding, Zhang, Ma and Chen51 It was observed that both p-GO and GO-PEI induced significant toxicity on HSA upon their interactions, while HSA displayed negligible conformation change upon binding with GO-COOH.
While numerous studies have reported observations on graphene nanomaterial-induced protein conformational change, the underlying mechanisms are still poorly understood and far from being established. Using molecular dynamic simulations, a recent study attempted to examine the influence of graphene and its two derivatives, i.e., GO and rGO, on the conformational structure of cytoplasmic protein upon its adsorption on graphene nanomaterial surface as well as the underlying molecular mechanisms (Fig. 4). Reference Baweja, Balamurugan, Subramanian and Dhawan52 In the study, the α-helical region of the positively charged cytoplasmic protein was chosen as a specific model site for investigation. In the physiological microenvironment, the α-helical part of the protein typically interacts with its natural receptor, i.e., the soluble attachment protein receptor (SNARE). GO possessed a surface area of 25 nm2 and randomly decorated hydroxyl and epoxy groups on its surface. In addition, a carboxyl group was attached to the GO edges. While having the same surface area, in comparison to GO, the rGO model possesses fewer oxygenated functional groups. In fact, the oxygen (O)-to-carbon (C) ratio in rGO and GO was approximately 1-to-20 and 1-to-5, respectively. For all systems, the protein was initially placed in a diagonal configuration, separated from the graphene nanomaterial surface by a distance of 10.5 Å [Fig. 4(a)].
Molecular dynamic simulation study of the adsorption of proteins on graphene nanomaterials. (a) Initial and (b) final conformations of different graphene nanomaterial–protein complexes: GO-protein (left), rGO (center), and graphene-protein (right). Oxygen, hydrogen, and carbon are highlighted in red, white, and gray, respectively. Yellow and cyan represent Tyr 21 and Tyr 39, respectively. (c) Schematic illustration showing the proposed mechanisms of protein adsorption on GO and graphene. Adapted with permission from Ref. Reference Baweja, Balamurugan, Subramanian and Dhawan52. Copyright 2013 American Chemical Society.
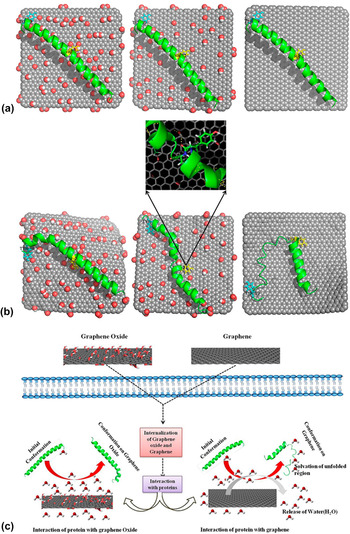
On its interactions with different graphene nanomaterials, the protein displayed unique adsorption behaviors on GO, rGO, and graphene. The protein exhibited the most stable conformation when it adsorbed on GO, followed by on rGO and graphene [Fig. 4(b)]. In fact, the protein retained its α-helical conformation on the GO surface upon adsorption. For the protein adsorbed on the GO surface, it was further revealed that, while some minor variations occurred at the C-terminal, most of its amino acid residues still maintained their original conformation. For protein adsorbed on rGO, meanwhile, α to turn transitions in the middle and C-terminal regions were observed. In contrast, the conformation of most amino acid residues was not preserved for the protein adsorbed on graphene, and these amino acid residues also experienced α to turn and 310 helical transitions. The analysis of the protein secondary structure revealed that the high stability of the protein conformation on GO might be due to the extensive hydration on the surface of GO as well as the lack of the involvement of tyrosine residues in the π–π stacking interactions with GO. In fact, of the different amino acid residues, only the aromatic (i.e., Tyr) and positively charged (i.e., Arg and Lys) residues interacted with GO selectively via hydrogen bonding. Also, it was noted that the π–π stacking of tyrosine residues, particularly Tyr 21 and Tyr 39, decreased with an increase in the amount of functional groups on the graphene nanomaterial surfaces. Interestingly, the nature of the protein-GO interaction resembled that formed between the protein and its SNARE as the GO surface was capable of accepting hydrogen bonds similar to the natural receptor of the protein typically exists in a physiological environment. Eventually, it was proposed that the electrostatic interactions were the primary driving forces behind the highly selective adsorption of protein on GO whilst the protein adsorption on both rGO and graphene was mediated through the van der Waals and π–π stacking interactions [Fig. 4(c)]. Ultimately, this study showed that the difference in the surface chemistries of graphene nanomaterials might significantly influence the adsorption patterns and conformational stability of the biomolecules.
Similarly, using extensive all-atom molecular dynamic simulations, a separate study aimed to unravel the molecular mechanisms underlying the adsorption of blood proteins on the graphene surface in the formation of protein-coated graphene nanomaterial complexes. Reference Gu, Yang, Wang, Zhou, Jimenez-Cruz and Zhou53 This study highlighted the significant role of aromatic residues in the adsorption process, specifically through their aromatic rings in facilitating strong π–π stacking interactions with the graphene sp 2-carbons. Intriguingly, basic residues, such as arginine, were observed to play an equally crucial or stronger role in this adsorption process, leading to the formation of protein-graphene complexes. The tight binding of basic residues to the graphene surface was suggested to be driven by strong dispersion interactions formed between the nanomaterial surface and the basic residue side chains.
In addition to the biological effects on individual plasma proteins, the molecular hemocompatiblity of graphene nanomaterials is also typically evaluated in terms of their anticoagulant activity, as characterized by plasma coagulation time factors. These are metrics normally utilized for assessing the plasma coagulation pathways. Plasma coagulation cascade generally consists of two different pathways, i.e., extrinsic and intrinsic pathways, which converge to transform prothrombin to thrombin to activate the conversion of fibrinogen to fibrin for the generation of blood clots. As such, plasma coagulation time factors are normally classified into prothrombin time (PT) and activated partial thromboplastin time (aPTT), which evaluate the abnormalities of factors involved in the extrinsic and intrinsic coagulation pathways, respectively.
In one of the recent reports, the anticoagulant activity of pristine and functionalized graphene nanomaterials, particularly their biological effect on the intrinsic and extrinsic plasma coagulation pathways, was assessed. Reference Sasidharan, Panchakarla, Sadanandan, Ashokan, Chandran, Girish, Menon, Nair, Rao and Koyakutty54 It was reported that, in the presence of both pristine and functionalized graphene with concentrations up to 75 μg/mL, all aPTT and PT values fell within the standard normal ranges. This suggests that both graphene nanomaterials did not affect the two plasma coagulation pathways. In a separate study, chemically reduced graphene was noncovalently modified with unfractioned heparin (UFH) and the anticoagulant activity of the conjugate was then examined. Heparin is an anionic glycosaminoglycan broadly known for its anticoagulant effect and consequently, the direct heparinization of nanomaterials is anticipated to enhance their hemocompatibility. Interestingly, the graphene/UFH conjugate displayed significantly enhanced antifactor Xa (FXa) activity and overall blood compatibility in contrast to pristine GO. Similarly, based on heparin, another investigation demonstrated the synthesis of functionalized rGO with improved stability in aqueous solution and excellent anticoagulant activity and biocompatibility. In the study, heparin acted as both a reducing agent and an efficient stabilizer. More clearly, the incorporation of heparin induced the removal of some oxygen functionalities of GO, leading to the generation of rGO. Heparin was subsequently functionalized on rGO via hydrogen bonding and hydrophobic interactions. Following its preparation, the anticoagulant activity of heparin-functionalized rGO (heparin-rGO) was assessed based on aPTT and PT tests. It was observed that both aPTT and PT were prolonged in the presence of heparin-rGO, suggesting that heparin-rGO was capable of inhibiting both the intrinsic and extrinsic blood coagulation pathways. Interestingly, as control, the anticoagulant activity of GO and hydrazine-rGO was also examined. It was noted that both GO and hydrazine-rGO were able to prolong aPTT but not PT, indicating that only the intrinsic coagulation pathway could be inhibited by these two graphene nanomaterials. Furthermore, the aPTT prolongation by GO and hydrazine-rGO was considerably weaker than that of heparin-rGO, implying that heparin-rGO possessed excellent anticoagulant behavior, and different inhibitory coagulation pathways might be realized with the use of graphene nanomaterials with different surface functionalities.
IV. INTERACTIONS OF GRAPHENE NANOMATERIALS WITH PERIPHERAL BLOOD CELLS
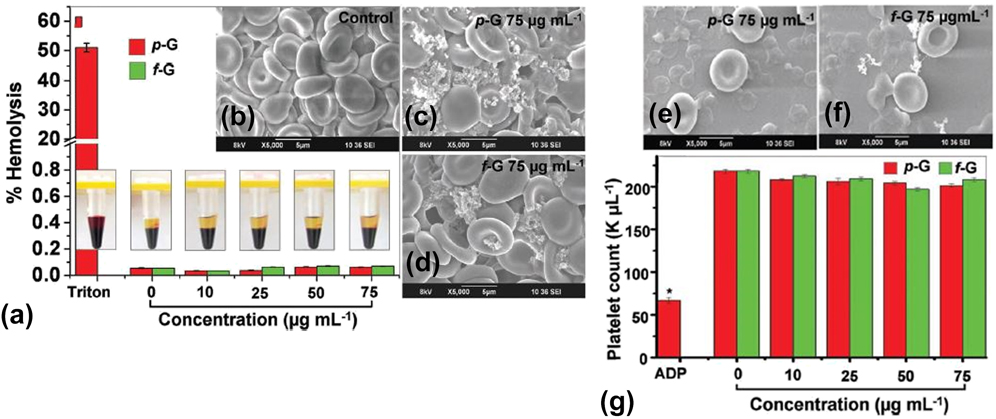
The cellular hemocompatibility of graphene nanomaterials may be assessed based on numerous parameters, such as platelet activation, platelet aggregation, and hemolysis or the release of hemoglobin upon rupture of the RBC membrane. For example, the in vitro interactions between two different graphene nanomaterials and human peripheral blood were assessed lately (Fig. 5). Reference Sasidharan, Panchakarla, Sadanandan, Ashokan, Chandran, Girish, Menon, Nair, Rao and Koyakutty54 Subsequently, the thrombogenecity and blood compatibility of these graphene nanomaterials were deduced. It was observed that up to a dose of 75 μg/mL, both hydrophobic pristine graphene and hydrophilic functionalized graphene did not elicit hemolysis [Fig. 5(a)]. The morphological characterization of RBCs incubated with negative control [Fig. 5(b)], 75 μg/mL pristine graphene [Fig. 5(c)], and 75 μg/mL functionalized graphene [Fig. 5(d)] further confirmed the biocompatibility of graphene nanomaterials with RBCs. It was clear that the membrane integrity of the pristine and functionalized graphene-treated RBCs was minimally perturbed, and they still maintained their biconcave morphology similar to that of untreated RBCs. Intriguingly, it was also noticed that up to a dose of 75 μg/mL, both graphene nanomaterials did not induce the activation of platelets. Moreover, the colloidal morphology of these platelets was still retained in the presence of graphene nanomaterials [Figs. 5(e) and 5(f)]. Interestingly, these graphene-treated platelets also preserved a normal count [Fig. 5(g)], implying that platelet aggregation was not triggered by both graphene systems.
Blood compatibility of different graphene nanomaterials. (a) Hemolysis assessment of whole blood treated with both pristine and functionalized graphene nanomaterials with different concentrations ranging from 0 to 75 μg/mL. (b–d) Morphology of RBCs treated with: (b) negative control, (c) pristine graphene, and (d) functionalized graphene. Both graphene nanomaterials were fixed at 75 μg/mL. (e, f) Morphology of platelets treated with: (e) pristine graphene and (f) functionalized graphene. Both graphene nanomaterials were fixed at 75 μg/mL. (g) Platelet count analysis of whole blood treated with both pristine and functionalized graphene nanomaterials with different concentrations ranging from 0 to 75 μg/mL. Adapted with permission from Ref. Reference Sasidharan, Panchakarla, Sadanandan, Ashokan, Chandran, Girish, Menon, Nair, Rao and Koyakutty54. Copyright 2012 Wiley-VERLAG GmbH & Co.
In a more recent investigation, the in vitro hematological effect of dextran-functionalized graphene nanoplatelets (GNP-Dex) on platelet activation and blood cell hemolysis were evaluated. Reference Chowdhury, Kanakia, Toussaint, Frame, Dewar, Shroyer, Moore and Sitharaman55 The study revealed that after treating human whole blood with GNP-Dex, both in vitro platelet activation and blood cell hemolysis in human whole blood were not induced, demonstrating the hemocompatibility of the GNP-Dex complex. Separately, the in vitro hematological effects of other modified graphene nanomaterials were examined through a systematic assessment of their anticoagulation potential. Reference Liu, Cao, Zhao, Deng, Li and Li56 Here, graphene was implanted with COOH+ ions to generate a COOH–graphene complex with improved anticoagulant properties. Encouragingly, it was observed that the COOH–graphene complex did not cause any toxicity on RBCs and platelets. It was further demonstrated that under the same conditions, as compared to pristine graphene, the COOH-implanted graphene induced a significantly lower platelet activation, adhesion, and aggregation. The considerable enhancement in the anticoagulation property of the COOH–graphene complex was suggested to be influenced by the amount of carboxyl groups possessed by the modified graphene. Besides, graphene has been modified with amine (G-NH2) and reported to be highly hemocompatible. Reference Singh, Singh, Kulkarni, Sonkar, Grácio and Dash57 It was demonstrated that the positively charged G-NH2 did not induce hemolysis, and it showed no stimulatory effect on platelets. Moreover, following intravenous injection in mice, G-NH2 did not evoke pulmonary thromboembolism.
In addition to that of pristine and functionalized graphene, the cellular hemocompatibility of other graphene-based nanomaterials has been increasingly characterized. For instance, GO nanosheets have been reported to possess a strong thrombus-inducing potential and considerable thrombogenecity. Reference Singh, Singh, Nayak, Kumari, Shrivastava, Grácio and Dash58 They could also trigger the activation of platelets and their strong aggregatory response similar to that evoked by thrombin, an active physiological platelet agonist. The platelet activation by GO was suggested to be extensively dependent on the surface charge distribution of GO as it was revealed that, in contrast to GO, rGO with reduced surface charge density was less capable in activating and aggregating platelets. The prothrombotic characteristic of GO nanosheets was further verified through the occurrence of significant pulmonary thromboembolism after their intravenous administration in mice. Separately, the hemocompatibility of graphene and GO sheets with different size, degree of exfoliation, and oxygen content on RBCs has also been assessed. Reference Liao, Lin, Macosko and Haynes36 Graphene and GO sheets were noted to elicit dose-dependent hemolysis. In fact, the extent of RBC hemolysis was heavily influenced by the size of graphene nanomaterials and the degree of their exfoliation. More clearly, the smaller sonicated GO sheets displayed a more pronounced hemolytic effect as compared to the larger untreated GO sheets. Also, a higher hemolytic effect was noted from the well-dispersed GO sheets with a higher surface oxygen density as compared to the aggregated graphene sheets. The hemolytic activity of GO sheets, however, could be considerably reduced by coating them with chitosan. Essentially, this study highlighted the strong impact of the physicochemical properties of graphene nanomaterials, such as physical size and oxygen content/surface charge, on their biological and toxicological effects on RBCs. In another report, peripheral blood mononuclear cells were treated with GO nanomaterials, which possessed different dimensions and were dispersed in different aqueous solutions, i.e., GO with dimensions of about 100 nm and more than 2 μm dispersed in water as well as GO with a dimension of roughly 100 nm dispersed in phosphate-buffered saline. Reference Campos-Delgado, Castro, Munguia-Lopez, González, Mendoza, Fragneaud, Verdan, Araujo, González, Navarro-Contreras, Pérez-Maldonado, León-Rodríguez and Achete59 It was reported that after 24 h, no adverse biological effect was detected on these GO-treated blood cells.
In addition to RBCs and platelets, a recent study has evaluated the in vitro hemotoxicity of various GO nanomaterials on human peripheral blood T lymphocytes (Fig. 6). Reference Ding, Zhang, Ma and Chen51 Possessing an essential role in the immune system, blood T lymphocytes are a specific type of white blood cells which typically maintain a nonproliferative resting state. An induced deficiency or activation of T lymphocytes may result in undesirable health conditions and diseases, such as autoimmune diseases and cancer. In the study, three different GO nanomaterials, i.e., pristine GO (p-GO) and GO modified with two distinct surface functionalities (GO-COOH and GO-PEI), were used. The cytotoxicity of GO nanomaterials was first evaluated after they were exposed, at varying concentrations from 0 to 100 μg/mL, to T lymphocytes for 24 h [Fig. 6(a)]. p-GO was noted to be highly hemocompatible and induced negligible cytotoxicity at concentrations below 25 μg/mL. Nevertheless, the relative viability of T lymphocytes started to decrease when the concentration of p-GO increased beyond 50 μg/mL. Similar to p-GO, GO-COOH exhibited a dose-dependent cytotoxic effect on T lymphocytes. Contrastingly, with an increasing GO-PEI concentration, the GO-PEI-treated T lymphocytes displayed a corresponding reduction in their viability. In fact, GO-PEI elicited significant cytotoxicity even at a low concentration of 1.6 μg/mL. This might be attributed to the high content of conjugated PEI in the GO-PEI complex. Interestingly, the continuous cell membrane structure of the p-GO- and GO-COOH-treated T lymphocytes was observed to be minimally compromised and remained intact [Fig. 6(b)]. Moreover, there was no trace of p-GO and GO-COOH detected within the T lymphocyte cytoplasm and nucleus, and only a small amount of p-GO and GO-COOH aggregates were noted to adsorb on the cell membrane [Fig. 6(c)]. This further suggests that p-GO and GO-COOH did not damage the cell membrane upon their binding with T lymphocytes, and it was highly likely that both GO nanomaterials were not internalized into the cytoplasm. In contrast, large hollow areas due to the discharge of cytoplasm and endonuclear materials were seen from the GO-PEI-treated T lymphocytes. Additional examination revealed the discontinuous cell membrane structure of these GO-PEI-treated cells and the localization of GO-PEI in the nucleus, implying that GO-PEI might induce cytotoxicity on T lymphocytes via the physical interaction-mediated cellular membrane damage.
Hemotoxicity of GO nanomaterials on peripheral blood T lymphocytes. (a) Relative cellular viability of T lymphocytes after an incubation with various GO nanomaterials with different concentrations for 24 h. (b) Transmission electron microscopy (TEM) images of the sectioned T lymphocytes treated with p-GO (left), GO-COOH (center), and GO-PEI (right) at a concentration of 100 μg/mL. (c) Magnified TEM images of (b). Red arrows indicate GO aggregates. (d) Plasma membrane integrity of T lymphocytes as evaluated using an LDH leakage assay after a 24 h incubation with GO at a concentration of 100 μg/mL. (e) ROS level of T lymphocytes as evaluated using DCFH-DA assay after an incubation with GO at a concentration of 100 μg/mL. *Indicates statistically significant difference with respect to control for P < 0.05. (f) Schematic illustration showing the proposed mechanisms underlying the hemotoxicity of different GO nanomaterials on peripheral blood T lymphocytes. Adapted with permission from Ref. Reference Ding, Zhang, Ma and Chen51. Copyright 2014 American Chemical Society.

The membrane integrity of the GO nanomaterial-treated T lymphocytes was further examined using a lactate dehydrogenase (LDH) release assay [Fig. 6(d)]. No considerable LDH leakage was observed from both the p-GO- and GO-COOH-treated T lymphocytes, indicating that these GO nanomaterials did not physically compromise the plasma membrane integrity although they exhibited significant cytotoxicity at high concentrations. Comparatively, the GO-PEI-treated T lymphocytes displayed significant LDH leakage, further confirming the cell membrane damage-based cytotoxicity of GO-PEI. Intriguingly, in addition to cell membrane damage, oxidative stress due to an increased ROS generation was also hypothesized as another possible mechanism underlying the cytotoxicity of GO nanomaterials. As such, the oxidative stress response of the GO nanomaterial-treated T lymphocytes was subsequently evaluated using a fluorescence-based 2,7-dichlorofl uorescein diacetate (DCFH-DA) assay [Fig. 6(e)]. An increased generation of intracellular ROS was noted from the p-GO-treated T lymphocytes, while the GO-COOH-treated cells displayed a normal intracellular ROS level. In contrast, a low fluorescence signal was detected from the GO-PEI-treated cells as their plasma membrane was damaged, leading to the discharge of their fluorescent products. While the adsorption of pGO on the cell membrane did not physically damage it nor cause the internalization of pGO into the cell, the pGO-T lymphocyte interactions resulted in an increased ROS level, intranuclear DNA damage, and cell apoptosis [Fig. 6(f)]. However, with its apoptosis-inducing potential, pGO surprisingly did not suppress the immune response of T lymphocytes. As pGO possessed a protein binding capability, it was proposed that the cytotoxicity of pGO might stem from its direct interactions with the membrane protein receptors, such as TCR and CKR, as well as its inhibition of the protein receptor-ligand binding capability, resulting in the occurrence of ROS-dependent, DNA fracture-inducing passive apoptosis via the B-cell lymphoma-2 (Bcl-2) pathway. Similar to pGO, GO-COOH elicited a comparable cytotoxic effect on T lymphocytes. However, a normal ROS level was maintained, indicating that the membrane protein receptor-ligand binding inhibition and the passive apoptosis signal transduction to the nucleus DNA were carried out via an ROS-independent pathway. GO-PEI, in contrast, evoked a significant hemotoxicity on T lymphocytes by physically damaging the plasma membrane.
While a large number of studies on the molecular and cellular hemocompatibility of graphene nanomaterials have been conducted in the last several years, a majority of these investigations have been performed in a static in vitro setting. However, the analysis and conclusions obtained under static in vitro conditions may not be able to be translated directly to infer the hemotological properties of graphene nanomaterials in dynamic in vivo environments. Consequently, to assess the real hematological impacts of graphene nanomaterials, more tests should be carried out under in vivo conditions. In vivo testing, nevertheless, presents a certain level of technical challenges. Therefore, recent years have seen the emergence of microfluidic technology for vascular and thrombosis research. This is because microfluidic devices allow experiments to be conducted in a controlled three-dimensional in vitro setting, mimicking the dynamic in vivo physiological environment. Reference Muthard and Diamond60–Reference Schoeman, Rana, Danes, Lehmann, Di Paola, Fogelson, Leiderman and Neeves65 Consequently, in addition to the biological effects and toxicity of graphene nanomaterials on plasma proteins and individual blood cells under static in vitro condition, the hemocompatibility of graphene nanomaterials has been assessed on whole blood under active in vivo-mimicking conditions.
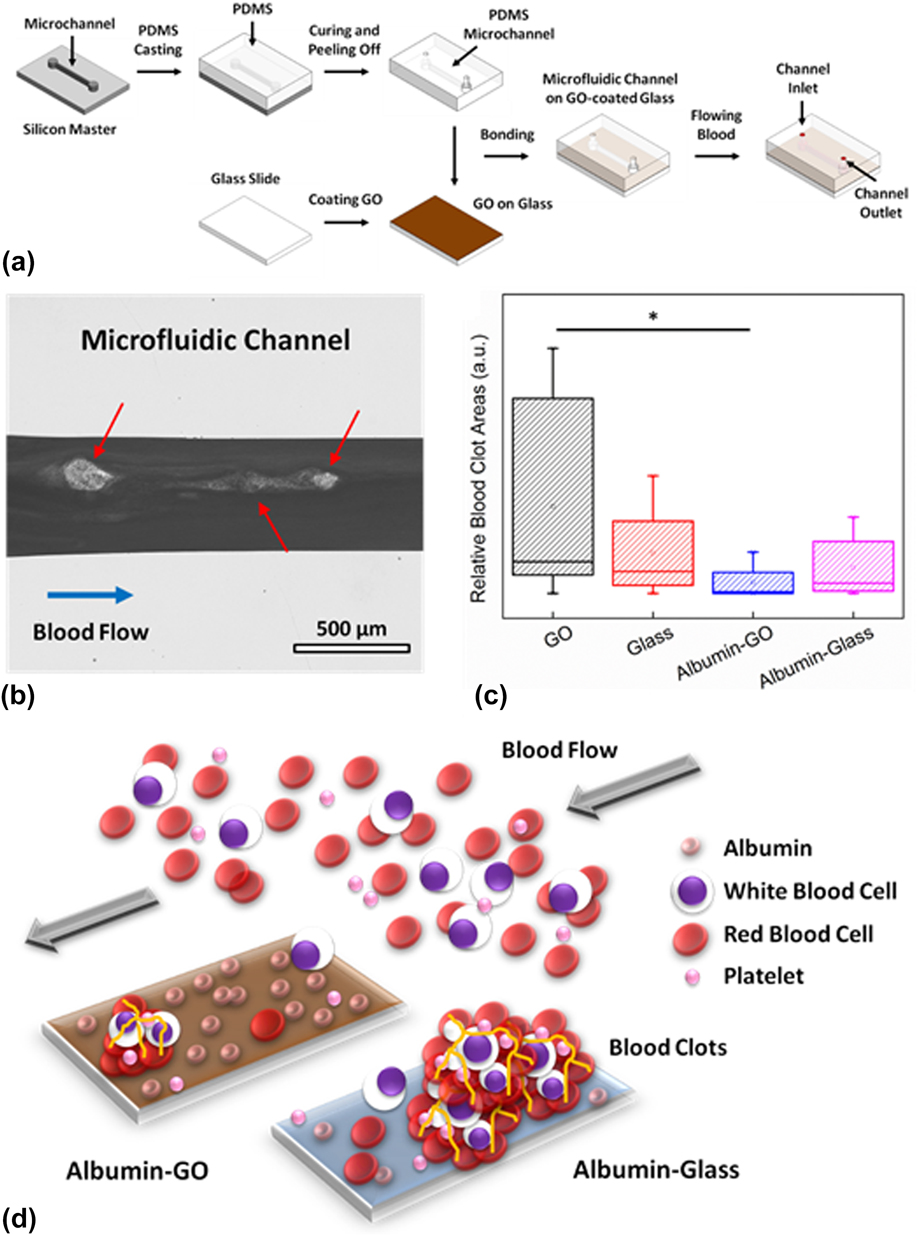
In one of the latest studies, the effect of pristine GO and albumin-functionalized GO (albumin-GO) on human whole blood was assessed under a dynamic flow condition using microvascular vessel–mimicking microfluidic channels (Fig. 7). Reference Kenry, Loh and Lim48 In the study, microfluidic devices with four different base materials, i.e., GO, albumin-GO, glass (uncoated control), and albumin-glass (coated control), were fabricated based on the standard soft lithography techniques [Fig. 7(a)]. The blood clot-inducing potential of GO nanomaterials was examined through the formation of blood clots in the microchannels under a blood flow rate of 10 μL/min for 20 min [Fig. 7(b)]. The formation of blood clots in the presence of synthetic biomaterials, in fact, is one of the most widely used in vitro metrics for evaluating their hemocompatibility. Interestingly, it was observed that the GO-coated microchannel elicited the formation of the highest amount of blood clots whilst the lowest amount of blood clots was formed in the albumin-GO-coated microchannel [Fig. 7(c)]. The higher amount of blood clots formed within the GO-coated microchannel was suggested to be driven by the existence of the higher density of oxygenated functional groups and surface charge on GO. This could, in fact, lead to a higher fibrinogen loading on the GO surface, resulting in the formation of fibrin and fibrin clots, which facilitated platelet adhesion and aggregation as well as the subsequent generation of blood clots. In contrast, the strong adsorption and high loading capacity of albumin on GO were proposed to be the underlying mechanisms fueling the formation of the lowest amount of blood clots in the albumin-GO-coated microchannel. More clearly, with a high albumin adsorption, the GO surface was considerably passivated from nonspecific binding with various blood clot-promoting biomolecules, leading to a minimal formation of contact-activated blood clots and occurrence of thrombosis [Fig. 7(d)]. Therefore, the enhanced antithrombotic property of albumin-functionalized GO under dynamic blood flow as well as its potential application for antithrombotic coating of blood-contacting biomedical devices were highlighted in this study. Essentially, it demonstrated that the hemocompatibility of GO nanomaterials under dynamic blood flow could be tuned via appropriate surface functionalization.
Blood clot-inducing potential of GO under dynamic flow. (a) Schematic illustration showing the fabrication of the GO-coated microfluidic channel for the assessment of the blood clot-inducing potential of pristine and functionalized GO. (b) Optical micrograph showing the formation of blood clots within a microfluidic channel. Scale bar represents 500 μm. (c) Relative blood clot areas formed within the microchannels with different base materials: GO, glass, albumin-GO, and albumin-glass. *Indicates statistically significant difference for P < 0.05 based on the two-tailed student’s t-test. (d) Schematic illustration showing the low blood-clot inducing potential of albumin-functionalized GO. Adapted with permission from Ref. Reference Kenry, Loh and Lim48. Copyright 2015 Wiley-VERLAG GmbH & Co.
V. SUMMARY AND PERSPECTIVES
Over the past decade, graphene nanomaterials have emerged as one of the most promising 2D nanomaterials with exciting potential for a wide range of biological and biomedical applications. Active research and scientific explorations over the last several years have revealed the unique structural features and an assortment of remarkable physicochemical properties of graphene nanomaterials, as well as established their potential applications in diverse areas of bionanotechnology and nanomedicine.
While promising advancements in relevant fields have been actively demonstrated, it is clear that up to date, a majority of the reported biomedical applications of graphene nanomaterials are still in their infancy. In fact, the translation of these proof-of-concept demonstrations into practical and clinical applications is still in its early phase due to the many unanswered questions and unresolved challenges. Tremendous efforts are thus necessary to address these concerns to realize the practical bioapplications of graphene nanomaterials. One of the most fundamental concerns regarding the practical bioapplications of graphene nanomaterials is their hemotoxicity. Graphene nanomaterials, with a thickness spanning from a single to few atomic layers, are anticipated to exhibit unique interactions with hematological entities, raising critical questions on their hematological effects. As such, comprehensive characterization and elucidation of their molecular and cellular interactions with individual blood components in the blood circulatory system, notably plasma proteins, platelets, RBCs, and WBCs, are essential. Additionally, in-depth evaluations of the in vitro and in vivo hematological effects of graphene nanomaterials, specifically the effects of their physicochemical properties on their hemocompatibility, are crucial to enable the safe design and engineering of functional graphene nanomaterials with minimal hemotoxicity.
While developing a thorough understanding on the graphene-blood interactions is not trivial but highly challenging, one may possibly draw inspirations from emerging biotechniques for assistance. For example, to further elucidate the molecular interactions between graphene nanomaterials and blood plasma proteins, one may probably turn to the evolutionary phage-display technology. Reference Cui, Kim, Jones, Wissler, Naik and McAlpine66–Reference Yang, Sunderland and Mao69 Through this assay, short peptide motifs possessing enhanced affinity and selective binding to graphene nanomaterials can be discovered and identified. In fact, peptides that are capable of binding preferentially to either the edges or the basal plane of graphene nanomaterials have recently been identified through phage-display analysis. Reference Cui, Kim, Jones, Wissler, Naik and McAlpine66,Reference Katoch, Kim, Kuang, Farmer, Naik, Tatulian and Ishigami67 Coupled with other techniques, such as atomistic molecular dynamic simulations, the precise structures and sequences of adsorbed plasma proteins as well as the mechanisms and dynamics of the interactions between graphene nanomaterials and plasma proteins may be further determined. Reference Dragneva, Rubel and Floriano70
It is interesting to note that, as the evaluations of the hemotoxicological profile of graphene nanomaterials have started picking up only several years ago, conflicting findings have been demonstrated. These apparent contradictions may stem from variations in the synthesis and processing of graphene nanomaterials, yielding graphene nanomaterials with a wide spectrum of morphological features and physicochemical characteristics. The physical size and size distribution, shape, number of layers, purity, oxidation level, and surface functionality of graphene nanomaterials are some of the physicochemical parameters that differ from one study to another, rendering it tremendously challenging to draw substantial conclusions from the available sources. Since many investigations are not directly comparable, there is an urgent need for standardized protocols and systematic approaches for assessing the hemotoxicological profile of graphene nanomaterials. Nevertheless, this has been largely hindered by the lack of precise manipulation over the morphological features and physical dimensions of graphene nanomaterials. Therefore, major improvements in this area are essential to achieve significant breakthroughs. Separately, many hemocompatibility and hemotoxicity assessments have been carried out over a short-term period. The long-term hematological effects of graphene nanomaterials, in fact, are still largely unknown or poorly understood. Consequently, it is important to characterize the long-term hematological risks of graphene nanomaterials to unravel the ultimate fate of graphene nanomaterials in living bodies.
Moving forward, progressive and sustained advancements in various areas are expected. These include controlled synthesis, processing, and characterization of graphene nanomaterials, as well as examination of the graphene-blood associations. In fact, more synergistic integrations of theoretical, experimental, and simulation approaches are anticipated to push the boundary of our current knowledge on the relationship between graphene nanomaterials and various hematological entities in the circulatory system. A deeper understanding on the hemocompatibility and hemotoxicity of graphene nanomaterials may, therefore, be achieved. Importantly, the translation of the proof-of-concept demonstrations into practical and clinical applications will no longer be insurmountable, and transformative breakthroughs in the biological and biomedical applications of graphene nanomaterials may be realized in the near future.


 Open access