

Energy metabolism, insulin resistance and adiposity contribute independently and interactively to breast cancer risk, prognosis and survival(Reference Patterson, Cadmus and Emond1–Reference McTiernan4). Metabolic profiles related to energy balance and insulin metabolism can be modulated through the manipulation of dietary macronutrient composition which has implications for cancer aetiology and outcomes. Diet composition may modify cancer-related processes through multiple pathways, and understanding these mechanisms is essential for designing targeted interventions to successfully improve cancer outcomes.
At a molecular level, macronutrient components (e.g. glucose and amino acids) participate in nutrient signalling pathways that activate energy metabolism-related cascades important for cell growth, proliferation and survival(Reference Marshall5). Thus, manipulation of growth and proliferation pathways through targeted dietary modification holds promise for reducing cancer risk and improving outcomes after a cancer diagnosis. Nevertheless, many dietary interventions designed to reduce cancer mortality and morbidity have, in general, had limited success(Reference Patterson, Cadmus and Emond1), which may have resulted from a lack of specificity in the dietary prescription towards these mechanisms.
MicroRNA (miRNA) are short, non-coding RNA that alter gene expression through the post-transcriptional modification of RNA, generally resulting in decreased target protein expression. miRNA participate in cellular proliferation, differentiation and apoptosis, are integral to growth and development, are involved in glucose, lipid and adipocyte metabolism, and many of these miRNA are frequently dysregulated in cancer(Reference Bartel6–Reference Zhang, Zhang and Didelot10). Modification of miRNA expression through dietary change has the potential to affect the production of related proteins and subsequent metabolic profiles(Reference Baek, Villen and Shin11, Reference Selbach, Schwanhausser and Thierfelder12). Among other mechanisms related to energy balance, miRNA control insulin signalling and glucose homeostasis(Reference Poy, Spranger and Stoffel8, Reference Gauthier and Wollheim13).
Glycaemic load is the effect that a food or combination of foods has on blood glucose disposition after consumption, taking into account the carbohydrate content of the food(s)(Reference Kendall, Augustin and Emam14). Compared with a high glycaemic load, a lower glycaemic load tends to produce a slower and more even rise in blood glucose after consumption, and consequently a lower insulin demand. In this regard, energy balance and insulin-dependent metabolism may be modulated through the modification of the dietary glycaemic load. Circulating glucose participates in the transcriptional up-regulation of insulin mRNA, as well as in the post-transcriptional promotion of insulin biosynthesis(Reference Jahr, Schroder and Ziegler15). Furthermore, integral to the function of insulin, insulin receptors are highly expressed in adipose tissue and other tissues, and are mediated through the phosphoinositol-3 kinase-Akt pathway(Reference Lee and Gorospe16). In summary, modification of dietary glycaemic load has the potential to affect the control of energy metabolism through multiple pathways. Given the role of miRNA in the control of energy balance-related metabolism and the potential for these changes to have an impact on cancer risk, we assessed the effect of dietary glycaemic load on miRNA expression in a sample of healthy, pre-menopausal women participating in a 12-month intervention designed to lower dietary glycaemic load. The primary goal of the present analyses was to determine whether modification of dietary glycaemic load affected the expression of miRNA, and to describe the relevant pathways involved.
Experimental methods
Study design
Data and samples for the present analyses were obtained from thirty-four healthy, pre-menopausal women who participated in the Diet and Breast Health Study conducted between August 2006 and June 2008 at the Roswell Park Cancer Institute (RPCI), Buffalo, New York. The Diet and Breast Health Study was a 12-month pilot dietary intervention study testing the feasibility of a low-glycaemic load dietary intervention to reduce breast cancer-related risk factors in women at a higher risk for breast cancer. Occurrence of breast cancer was not an outcome in the study. The present study was conducted according to the guidelines laid down in the Declaration of Helsinki and all procedures involving human subjects were approved by the RPCI Institutional Review Board. The study was registered at ClinicalTrials.gov as NCT01237938 (http://clinicaltrials.gov/ct2/show/NCT01237938?term=McCann&rank=8). Written informed consent was obtained from all subjects. Otherwise healthy women with a baseline mammographic density of at least 50 % (described as a risk factor for breast cancer(Reference Boyd, Byng and Jong17, Reference Boyd, Lockwood and Byng18)) as estimated by mammography were recruited from Windsong Radiology (Williamsville, NY). Women were eligible if they were between 40 and 60 years of age, still menstruating with at least ten menstrual cycles in the 12 months before study enrolment, and, if using oral contraceptives, stable use (no changes in use in the past 12 months nor changes intended during the intervention period). Women were excluded for any of the following: currently taking hormone replacement therapy; previous diagnosis of breast cancer or other malignancy other than non-melanoma skin cancer, ductal carcinoma in situ, lobular carcinoma in situ, atypical lobular hyperplasia, or atypical ductal hyperplasia; history of breast augmentation or reduction surgery; history of diabetes or other metabolic disease requiring dietary modification; weight reduction or Atkins-type diet in the previous 6 months; pregnant or lactating in the past 12 months, or intending pregnancy during the study period. All participants were further required to successfully complete three baseline telephone-administered 24 h dietary recalls. Of 115 women screened for eligibility, 42 % were ineligible, 19 % refused and 39 % (n 45) consented and were randomised into the study. Of these forty-five women, twenty-four were randomised to the intervention group and twenty-one to the control group. Finally, eighteen intervention and twenty control participants completed the 12-month study period.
To assess the potential for compliance with the telephone-administered dietary intervention, eligible and consenting participants were required to complete three 24 h dietary recalls within a 3-week run-in period. After successful completion of the recalls, each woman was randomly (simple randomisation) assigned to receive either the low-glycaemic load dietary counselling intervention or written materials providing only general information on diet and health, aimed at maintenance of the usual diet.
The dietary counselling intervention was administered by trained counsellors at the Nutrition Shared Resource at the Moores Cancer Center, University of California, San Diego, and consisted of up to sixteen telephone calls over 7–8 months. The diet was designed to lower the overall glycaemic load by approximately 15 %. Specific dietary recommendations included: consumption of low-glycaemic index (GI) foods (GI<55) instead of high-GI foods (GI>70) and limiting added sugars to < 10 % of daily energy. Daily macronutrient goals were approximately 50 % carbohydrates, 20 % protein and 30 % fat. Participants were provided with substitution lists to guide choices of low-GI foods. Additional recommendations were to favour whole fruits over juices, whole grains over refined, avoid simple sugars and include protein (such as nuts and legumes) at each meal.
Data were collected at four clinic visits: baseline; 4 months; 8 months; 12 months. At each visit, a fasting blood draw and a spot urine sample were obtained, and weight, height, waist and hip circumference were measured by trained study personnel using a standardised protocol. Whole blood was obtained by trained phlebotomists after an overnight fast. The blood samples were immediately sent to the Cancer Prevention and Control laboratories via a pneumatic tube, where they were processed and stored at − 80°C within 1 h. Dietary intake was assessed at baseline and again at 8 months through a set of three repeated 24 h dietary recalls conducted by telephone by the Nutrition Shared Resource. Dietary assessors conducted recalls on random days over a 3-week period, stratified for weekend and weekdays using the Nutrition Data System software (NDS-R 2006; University of Minnesota). Data on demographics, health history, reproductive history, lifestyle factors and usual diet were also collected at baseline from self-administered questionnaires.
Because of limited resources, the present analyses included data and serum from the first fourteen women randomised to the active intervention with sufficient serum samples for miRNA microarray expression analyses, with RT-PCR validation in the twenty control participants. The characteristics of the included participants are summarised in Table 1. These women were representative of the overall sample (data not shown). Furthermore, we investigated the change in miRNA expression from baseline to month 4, as this was the time point by which all intervention participants had achieved a reduction in glycaemic load (Fig. 1).
Baseline characteristics of the participants in the Diet and Breast Health Study, Roswell Park Cancer Institute (Mean values and standard deviations; number of participants and percentages)

Means compared with t tests for independent samples and categorical variables with the χ2 test, all values P>0·05.
Change in mean daily glycaemic load across time × intervention assignment. ![]() , Intervention;
, Intervention; ![]() , control. Values are least-squares means estimated with mixed models adjusting for visit-specific energy intake and baseline glycaemic load.
, control. Values are least-squares means estimated with mixed models adjusting for visit-specific energy intake and baseline glycaemic load.

RNA isolation
Total RNA, including miRNA from serum, was isolated using the miRNeasy kit (Qiagen) with minor modifications. The quality and quantity of the RNA was evaluated by 260/280 ratio using NanoDrop spectrophotometry (NanoDrop ND-1000 Technologies, Inc.) and an Agilent 2100 Bioanalyzer (Agilent Technologies). The efficiency of small RNA isolation was monitored by the amount of spiked-in miRNA recovered by using PCR with sequence specific primers (IDT).
MicroRNA microarrays
We used the Illumina Human v2 MicroRNA Expression BeadChips (catalogue no. MI-102–1024; Illumina, Inc.) for miRNA analysis according to the manufacturer's recommendations (Illumina MicroRNA Expression Profiling Assay Guide). From each sample, 200 ng of total RNA were labelled and hybridised to each array using standard Illumina protocols. All data are MIAME (minimum information about a microaray experiment) compliant, and the expression profiles of all twenty-eight samples have been deposited at NCBI's Gene Expression Omnibus with accession no. GSE22474.
Data processing
The raw intensity of Illumina Serum V2 MicroRNA expression array was scanned and extracted using BeadScan (Illumina, Inc.), with the data corrected by background subtraction in the GenomeStudio module. The lumi package in the R-based Bioconductor Package was used to normalise the log2-transformed intensity data with the Quantile normalisation algorithm. For data quality control, we filtered out the genes whose expression-detection P value was >0·05 (i.e. indistinguishable from the background intensity) across >80 % of samples. A total of 744 miRNA among 1145 miRNA passed this filtering for downstream analysis.
Data analysis
All data analyses were performed under the R programming environment (www.r-project.org).
Differential expression testing
For each of the 744 miRNA, we compared expression profiles from month 4 to baseline in fourteen participants who received the dietary intervention. For miRNA with at least 2-fold expression change, we used the Limma package to calculate the level of differential expression by fitting a linear model to the data (with cell means corresponding to the different conditions and a random effect for array, allowing for sib-pair effects)(Reference Smyth19). We obtained the list of differentially expressed miRNA with false discovery rate (FDR) less than 0·1 and constrained by at least 2-fold expression change. The FDR was calculated using the approach of Benjamini & Hochberg(Reference Benjamini and Hochberg20).
Clustering
Following single miRNA-based significance testing, we used the expression value of differentially expressed miRNA to cluster the samples. Our purpose was to check whether the identified miRNA, as a whole, were able to serve as potential miRNA signature to classify participant samples according to pre- or post-intervention status. Hierarchical clustering based on the average linkage of Pearson's correlation was employed(Reference Eisen, Spellman and Brown21).
Pathway enrichment analysis
We first obtained the predicted gene targets for each differentially expressed miRNA, using established algorithms commonly used to predict human miRNA gene targets, TargetScan(Reference Friedman, Farh and Burge22), miRanda(Reference Betel, Wilson and Gabow23), RNA22(Reference Miranda, Huynh and Tay24), miRDB(Reference Wang25) and miRWALK(Reference Dweep, Sticht and Pandey26) and specifically identified genes consensually predicted by at least four methods. The computational predictions of different algorithms were combined by using miRWalk server (http://www.umm.uni-heidelberg.de/apps/zmf/mirwalk). It has been shown that combining different prediction programs improves the accuracy for target gene prediction(Reference Sethupathy, Megraw and Hatzigeorgiou27). We then analysed the predicted miRNA target genes for enriched Kyoto Encyclopedia of Genes and Genomes pathways by using the NCBI DAVID API (http://david.abcc.ncifcrf.gov), in which the null hypothesis is that no difference exists between the number of genes falling into a given pathway in the target gene list and the genome as a whole(Reference Huang, Sherman and Tan28). Statistical significance for pathway prediction was set at P< 0·10, which is also the default of DAVID API.
Quantitative real-time PCR analysis
The expression levels of miRNA were confirmed with a Taqman-based quantitative real-time (qRT)-PCR using individual miRNA-specific primers and probes as described by the manufacturer (Applied Biosystems). The first-strand miRNA-complementary DNA PCR template was generated from 50 ng of total RNA according to the manufacturer's instructions. Approximately 2·5 ng of complementary DNA were then used in the PCR on a StepOnePlus Real-Time PCR System from Applied Biosystems. Triplicate samples, validated endogenous controls and inter-assay controls were used throughout. The qRT-PCR results were analysed by SDS 2.2.2 (Applied Biosystems). qRT-PCR data were the normalised expression values in which the endogenous control miR-16 was used as the reference gene. For each assay, the C t (cycle threshold) of miRNA of interest in the TaqMan qPCR assay was subtracted from the average miR-16 C t value to obtain a ΔC t value (miR-16 − miRNA of interest). A higher ΔC t value indicates a higher expression level of the miRNA of interest.
Results
As shown in Fig. 1, the women in the intervention were able to successfully lower their dietary glycaemic load. Most of the change in glycaemic load was accomplished through a reduction in carbohydrate intake and was reflected through reductions in serum TAG (data not shown). We collected a single, in-person 24 h dietary recall at each visit and three 24 h recalls by telephone at baseline and month 8. The three 24 h recalls were utilised to assess changes in dietary intake, as 3 d of intake better captures intra-individual variation in food use. As evidenced by the set of three repeated 24 h recalls collected at baseline and again at month 8, dietary fibre intake also increased across the intervention period which was reflected in increases in whole grains (baseline, 0·8 servings/d; month 8, 1·4 servings/d) and vegetables (baseline, 2·3 servings/d; month 8, 3·9 servings/d), and decreases in refined grains (baseline, 1·8 servings/d; month 8, 0·7 servings/d).
Comparing post-intervention with baseline expression data of the fourteen participants receiving the dietary counselling intervention, we identified twenty miRNA with at least a 2-fold differential expression at the FDR of 0·1, with twelve miRNA up-regulated and eight miRNA down-regulated in the post-intervention samples. The most strongly up-regulated miRNA was let-7b* with a 7·6-fold increase, and the most strongly down-regulated miRNA was miR-623 with a 4·3-fold decrease. A detailed list of the differentially expressed miRNA is shown in Table 2.
Differentially expressed microRNA (FDR <0·1) with at least 2-fold expression change obtained from the comparison of post-intervention v. baseline

ID, identification.
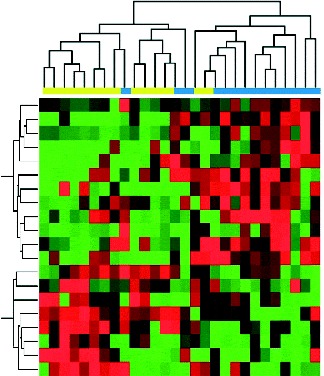
The expression values of differentially expressed miRNA were used to cluster the samples into their corresponding baseline or post-intervention status. As shown in Fig. 2, the twenty differentially expressed miRNA reasonably separate the fourteen post-intervention samples from their corresponding baseline samples. These data indicate a diet-modulated global perturbation in miRNA expression pattern in healthy women at elevated risk for breast cancer.
Hierarchical clustering of participant samples based on differentially expressed genes with at least 2-fold change and controlled by a false discovery rate of 0·1, as inferred from post-intervention (![]() , 4 month) v. baseline (
, 4 month) v. baseline (![]() ). In the clustering heat map, red indicates up-regulated while green indicates down-regulated. In the sample clustering dendrogram, blue indicates post-intervention samples while yellow indicates baseline samples.
). In the clustering heat map, red indicates up-regulated while green indicates down-regulated. In the sample clustering dendrogram, blue indicates post-intervention samples while yellow indicates baseline samples.
We also calculated correlations between miRNA expression and several serum biomarkers related to carbohydrate metabolism and steroid hormones. Among the differentially expressed miRNA in Table 2, we observed these statistically significant correlations with serum biomarkers: HS_261.1 with Serum hormone binding globulin (SHBG) (r − 0·56, P= 0·002) and dehydroepiandrosterone sulfate (DHEAS) (r 0·42, P= 0·03); hsa-miR-1224-3p with oestradiol (r − 0·55, P= 0·002) and glucose (r 0·48, P= 0·009); hsa-miR-663b with VLDL (r 0·48, P= 0·009), TAG (r 0·48, P= 0·010) and insulin (r 0·41, P= 0·03); hsa-miR-424* with HDL (r 0·41, P= 0·03); hsa-miR-664 with insulin (r − 0·40, P= 0·03).
To explore the potential role of diet-related miRNA expression perturbation in our sample, we obtained the list of consensus predictions of target genes from miRWalk server for differentially expressed miRNA. The list of miRNA with at least one consensus target gene prediction by miRWalk includes hsa-miR-10b, hsa-miR-1179, hsa-miR-1182, hsa-miR-1224-3p, hsa-miR-1281, hsa-miR-205, hsa-miR-338-3p, hsa-miR-521, hsa-miR-550, hsa-miR-623, hsa-miR-663b, hsa-miR-664, hsa-miR-942 and hsa-miR-944 (Table S1, available online). We then used NCBI DAVID API to identify the significantly enriched canonical pathways in these predicted targets. As shown in Table 3, pathways enriched in the potential gene targets of differentially expressed miRNA include various cancer-related pathways, various signalling transduction pathways critical for energy balance or cancer-related processes (e.g. insulin signalling pathway, TGF-β signalling pathway, p53 signalling pathway, cytokine–cytokine receptor interaction), cell and cell interactions, and others. Representative genes predicted to be associated with the top differentially expressed miRNA include v-akt murine thymoma viral oncogene homolog 2 (AKT2) (seven pathways), cyclin D1 (CCND1) (six pathways), nuclear factor of kappa light polypeptide gene enhancer in B-cells 1 (NFKB1) (five pathways) and neuroblastoma RAS viral (v-ras) oncogene homolog (NRAS) (five pathways). Several genes that were in one pathway only also shared pathways with AKT2, a major factor in energy metabolism and cancer (Table S2, available online).
Enriched pathways in the genes predicted to be targeted by differentially expressed microRNA obtained from the comparison of post-intervention v. baseline samples

We selected three differentially expressed miRNA identified from microarray for validation by Taqman qRT-PCR. Selected miRNA include let-7b* which is up-regulated (Fig. 3), and miR-130a* and miR-663b which are down-regulated (Fig. 4) in the post-intervention v. baseline samples. The expression fold change of let-7b* was 7·6 (P= 1·0 × 10− 4, FDR = 0·01) by microarray, and this expression change was validated by qRT-PCR (expression fold change 13·9, P= 4·8 × 10− 4). The expression fold-change of miR-130a* was − 3·0 (P= 0·025, FDR = 0·097) by microarray, and the expression fold change estimated by qRT-PCR was − 3·7 (P= 0·024). Similarly, qRT-PCR data of miR-663b (expression fold change − 4·9, P= 0·0027) was concordant with that estimated by microarray (expression fold change − 3·0, P= 0·013). Overall, the microarray-estimated expression differences for selected miRNA were highly concordant with those estimated by quantitative PCR.
Quantitative real-time (qRT)-PCR validations of let-7b* as a differentially expressed microRNA identified by microarray. (a) Data from qRT-PCR experiments. (b) Data from microarray experiments. The red point denotes the normalised expression value from baseline samples, while the black point denotes the normalised expression value from post-intervention samples. The normalised expression value is shown in log2 scale.

Quantitative real-time (qRT)-PCR validations of miR-130a* and miR-663b as differentially expressed microRNA identified by microarray. (a, b) Data for miR-130a* from the qRT-PCR and microarray experiments, respectively. (c, d) Data for miR-663b from the qRT-PCR and microarray experiments, respectively. The red point denotes the normalised expression value from baseline samples, while the black point denotes the normalised expression value from post-intervention samples. The normalised expression value is shown in log2 scale.

To confirm that changes in miRNA expression resulted from the dietary intervention and were not merely a function of time, we selected four differentially expressed miRNA to evaluate their expression in the twenty control participants. Selected miRNA include let-7b*, miR-521, miR-130a and miR-663b. Among the fourteen women receiving the intervention, let-7b* and miR-521 were significantly up-regulated and miR-130a and miR-663b were significantly down-regulated in post-intervention samples compared with baseline (Table 2). However, among the control participants, who did not receive the dietary intervention, we observed no significant changes between baseline and month 4 for these selected miRNA (expression fold change 1·23, P= 0·678, let-7b*; expression fold change − 1·34, P= 0·543, miR-521; expression fold change 1·44, P= 0·723, miR-130; expression fold change 1·47, P= 0·437, miR-663b; data not shown).
Discussion
In the early 1980s, Doll & Peto(Reference Doll and Peto29) concluded that as much as one-third of cancer could be prevented through dietary change, much of which has been reinforced by subsequent reports from the World Cancer Research Fund/American Institute of Cancer Research(30, 31). On the other hand, to date, dietary interventions to reduce cancer burden have had limited success, which may be partly a result of a lack of specificity in the dietary targets. Therefore, research is necessary to identify the molecular mechanisms by which diet can affect cancer-related metabolic pathways. Although preliminary, results from the present study suggest that changes in energy-related diet composition may modify the expression of miRNA associated with cancer and energy metabolism-related pathways. These preliminary data suggest direction for future studies that may improve our understanding of the role of energy balance and diet composition related to these pathways.
The potential involvement of the insulin signalling pathway is of particular interest for investigations of diet and cancer risk factors. First, the diet was designed to lower glycaemic load, which has been shown to have beneficial effects on glucose and insulin homeostasis(Reference Finley, Barlow and Halton32). Women in the intervention group successfully reduced their glycaemic load by as much as 25 %. Interestingly, although none of the women was diabetic, we also observed non-significant reductions in fasting insulin and C-peptide in response to the diet in the intervention participants (data not shown), suggesting that insulin homeostasis can also be improved in healthy subjects. Identification of differentially expressed miRNA predicted to be related to insulin signalling and a correlation of those miRNA with serum biomarkers of carbohydrate metabolism suggests that the intervention may be affecting the metabolic pathway targeted by the intervention. Dietary glycaemic load has been criticised as a measure, as the index represents the summed effect of individual food items on blood glucose disposition, which may be affected by the particular combination of foods consumed. Identification of miRNA related to insulin signalling and other energy balance pathways holds promise for the development of biomarkers that more accurately reflect glycaemic load effects. Finally, energy balance and insulin metabolism has been implicated in breast cancer, as well as other cancers(Reference Fair, Dai and Shu33–Reference Saxton36). Although none of the women in our sample had breast cancer, they were all considered to be at higher risk. Future studies are warranted to establish the associations of these miRNA with cancer risk and prognosis.
Several pathways relevant to energy metabolism, insulin signalling and cancer are putatively associated with differentially expressed miRNA in the present study. Among the most strongly differentially expressed miRNA identified in the present study, let-7b* belongs to the let-7 family of miRNA, which has been associated with oestrogen receptor α signalling in oestrogen receptor-positive breast cancer(Reference Zhao, Deng and Wang37), is involved in the regulation of tumorigenicity of breast cancer cells(Reference Yu, Yao and Zhu38) and has been frequently described as a tumour-suppressor miRNA(Reference O'Day and Lal39, Reference Zhang, Pan and Cobb40). Let-7b is also responsive to dietary intake. In an experimental setting, a maternal high-fat diet reduced hepatic expression in the offspring of several let-7 miRNA, including let-7b(Reference Zhang, Zhang and Didelot10). Another strongly differentially expressed miRNA in our data, miR-205, has been shown to be highly expressed in stem cell-enriched mammary gland cell cultures, suggesting a role for these miR in normal mammary stem cell maintenance(Reference Greene, Herschkowitz and Rosen41, Reference Wu and Mo42). Among the miRNA significantly down-regulated in the present study in response to the intervention, miR-663 expression has been shown to be modified by resveratrol(Reference Tili, Michaille and Alder43, Reference Tili, Michaille and Adair44) and, in breast cancer cells, is susceptible to modification by hypermethylation(Reference Lehmann, Hasemeier and Christgen45), which may also be affected by dietary intake. Of note, miR-663 expression was correlated with serum insulin levels in the present study.
These data suggest that miRNA expression can be modified by dietary change and that the miRNA affected may be important in relevant metabolic pathways. While promising, it should be emphasised that the pathway analysis conducted here is exploratory by nature and should be interpreted with caution. A thorough understanding of the functional role of diet in modulating miRNA expression in women at high risk for breast cancer can only be established using functional experiments.
The experimental design employed herein provides reasonable credibility that diet composition can be manipulated to modulate miRNA expression, with the potential to subsequently alter metabolism. However, we acknowledge that the sample size was small, and the present findings should be replicated in larger studies. Additionally, although the dietary intervention was designed to lower glycaemic load, we did not conduct a controlled feeding trial. Therefore, there may be aspects of dietary change not accounted for contributing to the present findings. Finally, miRNA are promiscuous, with multiple miRNA targeting a specific gene, or conversely, with any one miRNA targeting multiple genes. Accordingly, there may be other miRNA and pathways not identified that may be important.
In summary, in the present exploratory analysis, we have identified several miRNA significantly differentially expressed from baseline after an intervention that lowers dietary glycaemic load. These results provide important direction to assist with improving our understanding of the molecular basis of diet effects in cancer. Future studies with larger sample sizes and in-depth functional experiments are necessary to confirm these observations, and to further explore the effects of diet in cancer.
Acknowledgements
This study was supported in part by funding from the Roswell Park Cancer Institute Alliance Foundation. The authors' contributions are as follows: S. E. M., S. L., C.-C. H., V. A. N. and H. Z. provided substantial contributions to the study conception and design; S. E. M., S. L., D. W., J. S., V. A. N. and H. Z. contributed to the acquisition of the data; S. E. M., S. L., D. W., Q. H. and H. Z. contributed to the analysis and the interpretation of the data; all authors contributed to the drafting, revising and final approval of the manuscript. The authors declare that they have no conflict of interest.
Supplementary tables are available online at http://www.journals.cambridge.org/bjn


