

More than 150 unique cases of herbicide resistance (e.g., species by site of action) have been confirmed in the United States (Heap Reference Heap2017). Evolved resistance to the acetolactate synthase inhibitors, acetohydroxyacid synthase inhibitors, acetyl Co-A carboxylase inhibitors, and triazines characterize the majority of these reports. Recently, population shifts in several species towards glyphosate-resistant biotypes and biotypes exhibiting resistance to multiple sites of action have become the principal management concerns in several agricultural commodities including corn (Zea mays L.), soybean [Glycine max (L.) Merr.], and cotton (Gossypium hirsutum L.) (Beckie and Hall Reference Beckie and Hall2014; Frisvold and Reeves Reference Frisvold and Reeves2014; Riar et al. Reference Riar, Norsworthy, Steckel, Stephenson, Eubank, Bond and Scott2013; Sosnoskie and Culpepper Reference Sosnoskie and Culpepper2014). The economic impact of herbicide-resistant weeds can be substantial. For example, in Georgia cotton, herbicide input costs more than doubled following the evolution and spread of resistant Palmer amaranth (Amaranthus Palmeri S. Watson), and hand-weeding costs increased by 475% (Sosnoskie and Culpepper Reference Sosnoskie and Culpepper2014). Livingston et al (Reference Livingston, Fernandez-Cornejo, Unger, Osteen, Schimmelpfennig, Park and Lambert2015) reported that glyphosate-resistant weed infestations could lead to substantially reduced corn and soybean operating returns as a result of lower yields and increased input costs associated with weed management.
New tools for the management of herbicide-resistant weeds include the commercialization of transgenic agronomic crop cultivars with 2,4-D or dicamba resistance stacked with tolerance traits to other modes of action (Behrens et al. Reference Behrens, Mutlu, Chakraborty, Dumitru, Jiang, LaVallee, Herman, Clemente and Weeks2007; Green Reference Green2012; Johnson et al. 2010; Simpson et al. Reference Simpson, Rune, Scherder, Peterson, Ditmars, Ellis, Richburg and Ellis2009; Wright et al. Reference Wright, Shan, Walsh, Lira, Cui, Song, Zhuang, Arnold, Lin, Russell, Cicchillo, Peterson, Simpson, Zhou, Ponsamuel, Yau and Zhang2010). Both 2,4-D and dicamba weed management programs have been found to be effective against Palmer amaranth, common waterhemp [Amaranthus tuberculatus (Moq.) J. D. Sauer] (Cahoon et al. Reference Cahoon, York, Jordan, Everman, Seagroves, Culpepper and Eure2015; Inman et al. Reference Inman, Jordan, York, Jennings, Monks, Everman, Bollman, Fowler, Cole and Soteres2016; Meyer et al. Reference Meyer, Norsworthy, Young, Steckel, Bradley, Johnson, Loux, Davis, Kruger, Bararpour and Ikley2015), horseweed (Erigeron canadensis L.) (Byker et al. Reference Byker, Soltani, Robinson, Tardif, Lawton and Sikkema2013; Flessner et al. Reference Flessner, McElroy, McCurdy, Toombs, Wehtje, Burmester, Price and Ducar2015; Ford et al. Reference Ford, Soltani, Robinson, Nurse, McFadden and Sikkema2014), and giant ragweed (Ambrosia trifida L.) (Jhala et al. Reference Jhala, Sandell and Kruger2014; Mahoney et al. Reference Mahoney, McNaughton and Sikkema2016), which are some of the most troublesome weedy pests in the United States (Van Wychen Reference Van Wychen2016).
The adoption of 2,4-D- and dicamba-resistant cotton and soybean have expanded both the temporal and spatial use profile of these herbicides. This has raised concerns about the potential for off-target damage to sensitive crops, such as fruits and vegetables lacking natural or engineered tolerance to synthetic auxins, resulting from spray drift, volatility, and spray tank contamination. Injury due to sublethal doses of synthetic auxins has been demonstrated for many commodities, including soybean (Al-Khatib and Peterson Reference Al-Khatib and Peterson1999; Robinson et al. Reference Robinson, Davis, Simpson and Johnson2013), cotton (Byrd et al. Reference Byrd, Collins, Culpepper, Dodds, Edmisten, Wright, Morgan, Baumann, Dotray, Manuchehri, Jones, Grey, Webster, Davis, Whitaker, Roberts, Snider and Porter2016; Everitt and Keeling Reference Everitt and Keeling2009; Solomon and Bradley Reference Solomon and Bradley2014), wine grapes (Vitis vinifera L.) (Mohseni-Moghadan et al. Reference Mohseni-Moghadam, Wolfe, Dami and Doohan2016), and vegetables (Colquhoun et al. Reference Colquhoun, Heider and Rittmeyer2014; Dittmar et al. Reference Dittmar, Ferrell, Fernandez and Smith2016).
According to recent statistics, 13,000 farms in the United States harvested approximately 48,000 ha of watermelons worth $5.6 billion (USDA ERS 2013). While almost 50% of the U.S. production occurs in Texas, Florida, Georgia, and California, commercial operations can be found in almost every state. In Georgia, watermelon is the second most valuable vegetable crop, following Vidalia onion (Allium L.), with a farm gate value of over $134 million (Wolfe and Stubbs Reference Wolfe and Stubbs2015). The increased use of 2,4-D and dicamba associated with the commercialization of resistant agronomic crops has the potential to impact the growth, development, and yield of specialty crops, including watermelon, that are grown in close proximity. The objective of this study was to determine the effects of low doses of 2,4-D and dicamba on visual injury, vine growth, crop yield, and the accumulation of herbicide residues in marketable fruit of watermelon, as a response to watermelon maturity at time of treatment.
Materials and Methods
Site Selection and Trial Establishment
Experiments were conducted during 2014 and 2015 at the Tifton Vegetable Park on the University of Georgia–Tifton campus (31.45°N, 83.51°W, elevation 110 m). Soil at the site is a Tifton loamy sand (fine-loamy, kaolinitic, thermic Plinthic Kandiudult) with 84% sand, 11% silt, 5% clay, 0.5% organic matter, and a pH of 6.5. Soil within the experimental area was tilled in January of each year. Within two weeks of tillage, raised beds (0.9 m wide, 7.5 m long, 15 cm tall) were formed using a combination bedder shaper and plastic mulch layer (Kennco Manufacturing, Inc., Ruskin, FL 33570). As beds were being formed, the entire trial area was treated with 468 L ha−1 dimethyl disulfide:chloropicrin (79:21) (Paladin Pic–21, Arkema, King of Prussia, PA 19406) with the fumigant being injected 20 cm below the bed top using three shanks evenly spaced across the bed. While the fumigants were being injected, drip tape was laid in the center of the bed 2.5 cm below the bed surface, and the entire treated bed was covered with a black on black totally impermeable film (Guardian Agro Plastics, 10417 Greendale Drive Tampa, FL 33626).
Transplant holes were mechanically made in the plastic mulch using a transplant hole punch wheel (Kennco Manufacturing, Inc., 1105 3rd St. NE, Ruskin, FL 33570) on April 4, 2014, and March 30, 2015. ‘Trobador’ (2014) and ‘Charismatic’ (2015) seedless watermelons (13 cm in height) were transplanted, on the same day, in single rows with a spacing of 364 cm between beds and 69 cm between plants within a row (for a total of 18 plants plot−1); alleys were 460 cm wide. Pollinator diploid watermelons (‘860 F1’) were included as the first, middle, and last plant of each plot; pollinator plants were transplanted at the same time as the seedless varieties. The studies were managed for irrigation, fertility and other pests following University of Georgia recommendations.
The treatments were a factorial combination of two herbicides, two spray rates, and three application timings. A nontreated control was also included for comparison. Herbicides included 2,4-D (Weedar 64®, Nufarm, Inc, 11901 S. Austin Ave., Alsip, IL 60803) and dicamba (Clarity®, BASF Corporation, Research Triangle Park, NC). Watermelon transplants were treated with herbicide doses that were either 1/75 or 1/250 the recommended field rates of 2,4-D (1,120 g ha−1) and dicamba (560 g ha−1) at approximately 20, 40, or 60 days after planting (DAP). The 20 DAP applications were made on April 24, 2014, and April 22, 2015. At this time, watermelon vines were, on average, 20 to 30 cm in length, and the plants had not yet begun to flower. The 40 DAP applications were made on May 17, 2014, and May 11, 2015. Mean vine length ranged from 180 to 210 cm and the largest fruit were 4 cm in diameter. The 60 DAP applications were made on May 30, 2014, and May 29, 2015. Watermelon vines ranged from 200 to 270 cm in length and the largest fruit were 8 cm in diameter.
Herbicide applications were made directly to watermelon foliage using a CO2-pressurized backpack sprayer equipped with 11002 AIXR nozzles when spraying 2,4-D or 110015 TTI nozzles when applying dicamba (TeeJet Technologies, Wheaton, IL 60187). No adjuvants were included. The sprayer was calibrated to deliver the carrier at a rate of 140 L ha−1. The spray boom was 138 cm long with a nozzle spacing of 46 cm and was held at a height of 41 cm above the vines. To avoid drift, distances between individual plots were large (364 to 460 cm), wind speeds and boom heights were minimized, and a board was carried on the downwind side of each plot to collect potential drift particles. Air temperature at the time of application ranged from 16 to 26 C, relative humidity ranged from 53% to 80%, and wind speeds did not exceed 8 km h−1.
Crop Injury and Yield
Visual crop injury (chlorosis, epinasty, leaf deformations) was rated on a scale of 0% to 100% (0% meaning no injury, 100% meaning complete plant death) every 7 days starting at 1 day after application (DAA). The length of the longest vine, measured from the base of the plant to the tip of the terminal leaf, was recorded for eight plants per plot 17 DAA. Melons were harvested, counted, and weighed on June 30, 2014, and June 28, 2015. The first two mature marketable fruit from each plot were harvested separately and delivered immediately to the Georgia Department of Agriculture in preparation for residue analysis. Weights from these fruit were included in the overall yield for each treatment. Each plot sample, including the nontreated control, was analyzed for both 2,4-D and dicamba residues.
Residue Analysis
Watermelons from each plot were cut into cubes approximately 5 cm in height, width, and length. The cubes were then placed into a Robot Coupe chopper (Robot Coupe U.S.A., Inc., Ridgeland, MS 39157) until the chopper reservoir was half full. The tissue was blended until no large chunks were visible. The homogenized sample was placed into a sample container and appropriately labeled for cataloging and storage. Between samples, the knife, chopping board, and Robot Coupe reservoir and blade were all triple rinsed with acetone. The robot coupe top was triple rinsed with methanol and the counter was wiped down with acetone.
Five grams of chopped watermelon from each plot was transferred into a 50 ml centrifuge vial and 10 ml of 18 megaohm water was added. Three hundred μl of a 5N sodium hydroxide solution was subsequently added, and the solution was shaken vigorously for 1 minute. After 30 minutes, 300 μl of 5N sulfuric acid solution was added followed by 10 ml of acetonitrile. The resulting solution was again shaken vigorously for 1 minute. Following this agitation, 4 g magnesium sulfate, 1 g sodium chloride, 1 g trisodium citrate dihydride, and 0.5 g disodium citrate sesquihydrate were added and the mixture was again shaken vigorously for 1 minute. The mixture was then centrifuged for 5 minutes at 3,000 rpm, and the top layer was filtered and removed for analysis.
Residue detection for each plot sample was performed utilizing a Shimadzu Prominence 20A Series LC (Shimadzu Scientific Instruments, Columbia, MD 21046) with an AB Sciex API 3200 Mass Spectrometer detector (AB Sciex LLC, Framingham, MA 01701) as well as a Shimadzu Prominence 20A Series LC with an AB Sciex Q-Trap 5500 Mass Spectrometer detector (Shimadzu Scientific Instruments, Columbia, MD 21046). Chromatography utilized 0.1% acetic acid in water and 0.1% acetic acid in acetonitrile for the mobile phases with an Agilent Zorbax Eclipse XDB-C18 column (Agilent Technologies, Inc, Santa Clara, CA 95051) to separate the desired compounds.
Statistical Analysis
Data were analyzed using PROC GLIMMIX in SAS (version 9.2, SAS Institute Inc., Cary, NC 27513) to determine if the combined treatment effects of herbicide, herbicide rate, and crop stage of growth influenced crop injury, vine length, and melon yield. Years and replications (nested within years) were considered random effects. The interaction between year and treatment was also evaluated; if a significant interaction between the variables was observed, data were analyzed and presented separately by year. Injury and vine length, which were expressed as a percentage of the nontreated control to adjust for plant size differences among application dates, were arcsine square-root transformed to improve normality and homogeneity of variance prior to analysis. Fruit yield (both number and weight) were log-transformed. Yield data for small nonmarketable melons (≤4.5 kg) and large marketable melons (>4.5 kg) were analyzed individually. Because of the large number of multiple pairwise assessments, differences in dependent variable response to herbicides, herbicide rates, and application timings were assessed using contrast statements and Tukey-Kramer adjusted P values. If a significant effect of application timing was observed, linear regression analysis was used to further describe variable response.
Results and Discussion
Herbicide-induced melon injury at 14 DAA was affected by year; therefore, 2014 and 2015 data were analyzed separately. In 2014, melon injury was affected by the main effects of herbicide, rate, and the timing of applications relative to planting. Averaged over rates and timings, injury to melons was greater when dicamba (24% injury) was applied as compared to 2,4-D (20% injury). Melons treated with the 1/75 rate of either 2,4-D or dicamba exhibited 26% injury, when averaged across timings, whereas melons treated with the 1/250 use rate were injured 18%. Averaged over herbicides and rates, injury resulting from the 60 DAP application timing (16%) was significantly lower than the injury resulting from the 20 (26%) and 40 (25%) DAP timings; there was no difference in the amount of injury observed between the 20 and 40 DAP application timings.
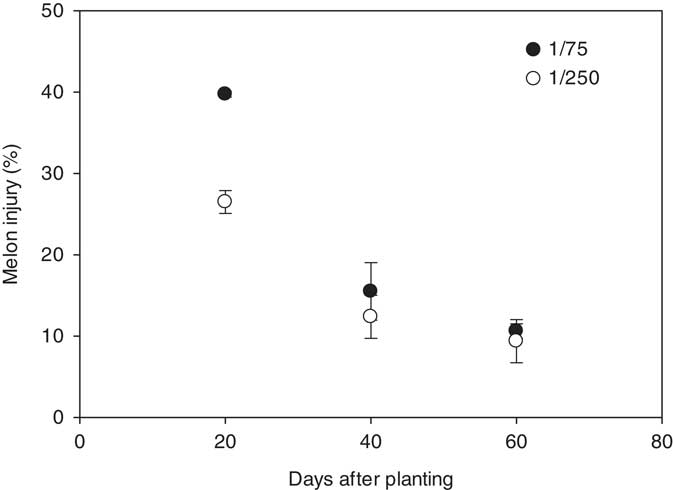
In 2015, melon injury at 14 DAA was influenced by the interaction between herbicide and rate and the interaction between timing and rate. Melons treated with the 1/75 rate of 2,4-D or dicamba exhibited 22% injury across all timings, whereas melons treated with the 1/250 rate of either herbicide were injured 17% (Figure 1). Averaged over herbicides, melon injury at 20, 40, and 60 DAP was 40%, 16%, and 11%, respectively, for the 1/75 rate and 27%, 12%, and 9% for the 1/250 rate. No melon injury was observed in the nontreated control in either year. Other researchers have shown similar results with lower levels of visual damage from auxin herbicides when plants are in a reproductive stage of growth as compared to a vegetative stage of growth (Byrd et al. Reference Byrd, Collins, Culpepper, Dodds, Edmisten, Wright, Morgan, Baumann, Dotray, Manuchehri, Jones, Grey, Webster, Davis, Whitaker, Roberts, Snider and Porter2016). In the current trials, melons treated at 20 DAP had not yet begun to flower, whereas melons treated at 40 and 60 DAP were beginning to set fruit.
Watermelon injury (2015) at 14 days after application in response to the rate of auxinic herbicides and the timing of treatments with respect to planting. Crop injury data were linearly regressed against application date using the equations y 1/75=51.1−0.75x (R2=0.82) and y 1/250=33.2−0.43x (R2=0.79). Data were averaged over herbicides.
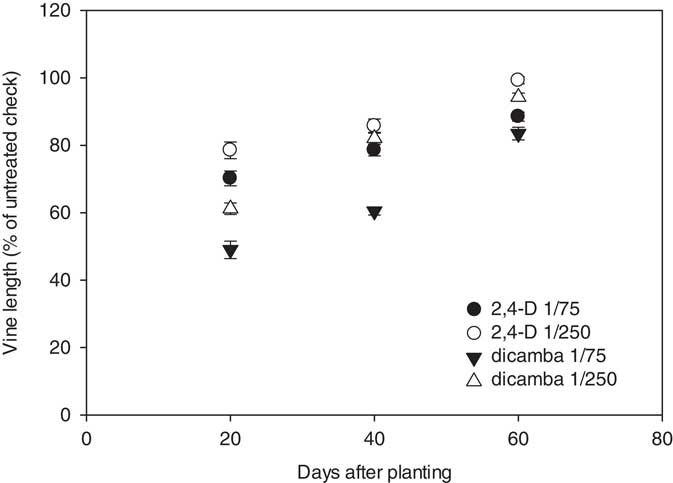
Vine length was not significantly affected by year; therefore, data were combined for analysis and presentation. The interactions between herbicide, herbicide rate, and the timing of applications influenced relative vine length (expressed as a percentage of the untreated check) at 17 DAA. The nontreated melon vines were, on average, 77, 251, and 294 cm in length at 20, 40, and 60 DAP, respectively. The closer to harvest herbicide applications were made, the less stunting was observed (Figure 2). Watermelon vines treated with the 1/75 rate of 2,4-D were 70%, 79%, and 89% the length of the nontreated check when herbicide applications were made at 20, 40, and 60 DAP, respectively; vines treated with the 1/250 rate of 2,4-D were and 79%, 86%, and 99% the length of the control when treatments were applied at 20, 40, and 60 DAP. Reductions in vine length were greater in the dicamba treatments as compared to 2,4-D. Vine lengths for melons treated with the 1/75 rate of dicamba at 20, 40, and 60 DAP were 49%, 61%, and 84% the length of the nontreated check, respectively; vines treated with the 1/250 rate of dicamba were 61%, 82%, and 94% the length of the untreated check when applications were made at 20, 40, and 60 DAP.
Watermelon vine length, expressed as a percentage of the untreated check, in response to herbicide, rate, and timing of treatments with respect to planting. Vine length data in response to 2,4-D were linearly regressed against application date using the equations y 1/75=60.8+0.45x (R2=0.71) and y 1/250=67.1+0.52x (R2=0.71). Vine length data in response to dicamba were linearly regressed against application date using the equations y 1/75=29.8+0.86x (R2=0.85) and y 1/250=46.1+0.83x (R2=0.89). Data are averaged over years.
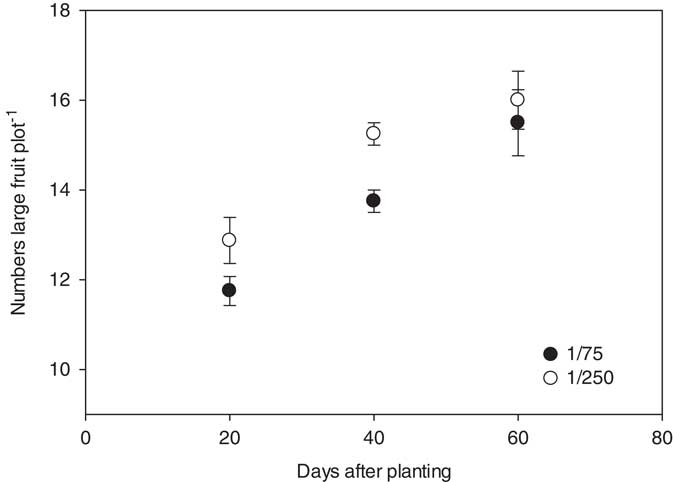
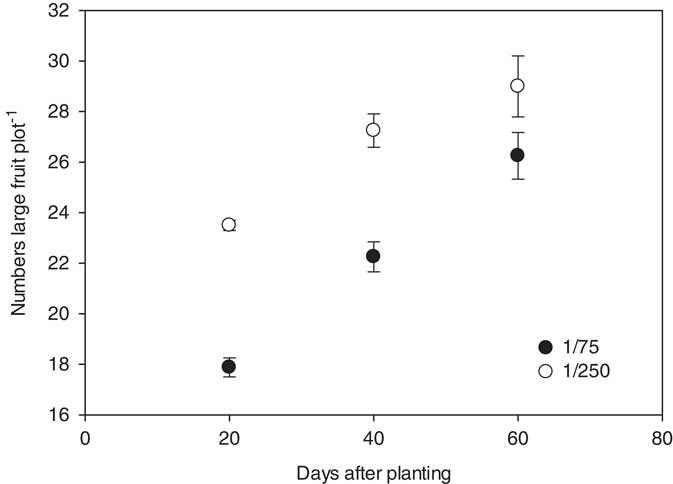
The number of marketable fruit (>4.5 kg in size) produced was influenced by the interactions between rate, timing, and year, but was not influenced by the herbicide applied. In 2014, the nontreated control yielded 15 melons plot−1. Plots treated with the 1/75 or 1/250 rate of either 2,4-D or dicamba at 20, 40, and 60 DAP yielded 12 to 13, 14 to 15, and 16 fruit plot−1, respectively; only the 20 DAP treatments differed significantly from the check plots (Figure 3). In 2015, the nontreated checks produced 31 fruit plot−1. Plots treated with 1/75 and 1/250 herbicide rates at 20, 40, and 60 DAP produced 18 and 24, 22 and 27, and 26 and 29 large fruit, respectively; only plots treated with a 1/75 rate of 2,4-D or dicamba at 20 and 40 DAP produced significantly fewer fruit than the nontreated check (Figure 4).
Number of marketable watermelon fruit (>4.5 kg) production plot−1 for 2014 in response to herbicide rate and the timing of treatments with respect to planting. Marketable fruit number data were linearly regressed against application date using the equations y 1/75=9.9+0.09x (R2=0.76) and y 1/250=11.6+0.08x (R2=0.67). Data were averaged over herbicides. The start of the y axis was set at 9, instead of zero, to improve data visualization.
Number of marketable watermelon fruit (>4.5 kg) production plot−1 for 2015 in response to herbicide rate and the timing of treatments with respect to planting. Marketable fruit number data were linearly regressed against application date using the equations y 1/75=17.9+0.21x (R2=0.89) and y 1/250=21.1+0.14x (R2=0.70). Data were averaged over herbicides. The start of the y axis was set at 16, instead of zero, to improve data visualization.
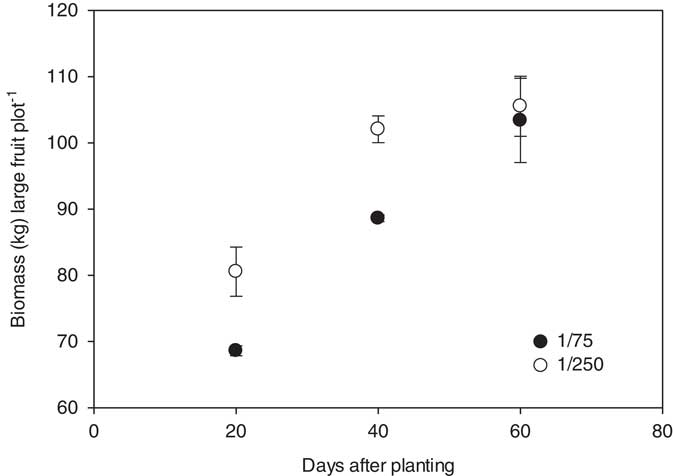
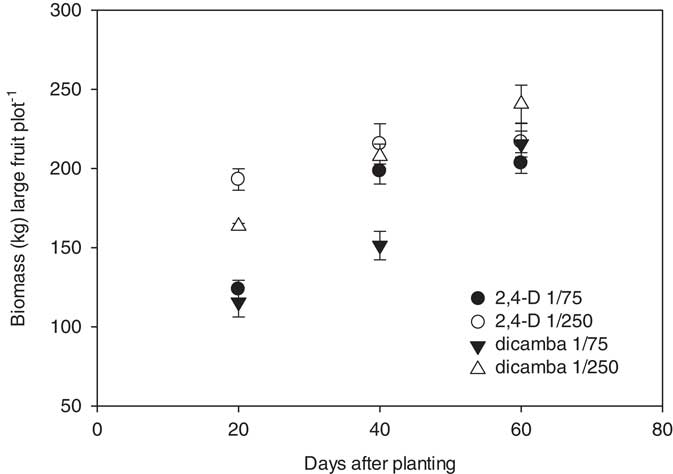
In 2014, marketable watermelon fruit biomass was significantly influenced by the interaction between herbicide rate and the timing of herbicide applications following planting; there were no differences observed between the 2,4-D and dicamba treatments. Total biomass of marketable melons was 69, 89, and 103 kg plot−1 when a 1/75 rate of either herbicide was applied at 20, 40, and 60 DAP; 81, 103, and 105 kg plot−1 of melons were produced for the 1/250 rate treatments (Figure 5). The nontreated control plots yielded 94 kg plot−1; only the 1/75 rate applied at 20 DAP, averaged over herbicides, differed from the check. In 2015, herbicide, herbicide rate, and the timing of herbicide applications influenced large melon biomass. Marketable melons treated with 1/75 and 1/250 rates of 2,4-D at 20, 40, and 60 DAP produced a total of 124 and 193, 198 and 216, and 203 and 217 kg large fruit plot−1, respectively. For dicamba, the 1/75 and 1/250 rate applied at 20, 40, and 60 DAP resulted in 116 and 164, 151 and 205, and 217 and 241 kg plot−1, respectively (Figure 6). In 2015, 2,4-D and dicamba applications made at 20 DAP reduced melon weights when compared to the nontreated control (238 kg plot−1).
Biomass of marketable watermelon fruit (>4.5 kg) production plot−1 for 2014 in response to herbicide rate and the timing of treatments with respect to planting. Marketable fruit biomass data were linearly regressed against application date using the equations y 1/75=52.1+0.87x (R2=0.83) and y 1/250=71.1+0.62x (R2=0.65). Data were averaged over herbicides. The start of the y axis was set at 60, instead of zero, to improve data visualization.
Biomass of marketable watermelon fruit (>4.5 kg) production plot−1 for 2015 in response to herbicide, herbicide rate, and the timing of treatments with respect to planting. Marketable fruit biomass yield in response to 2,4-D was linearly regressed against application date using the equation y 1/75=95+1.99x (R2=0.72); data for the 1/250 2,4-D treatment could not be linearly regressed. Fruit biomass yield in response to dicamba was linearly regressed against application date using the equations y 1/75=60.8+2.50x (R2=0.86) and y 1/250=127.0+1.93x (R2=0.82). The start of the y axis was set at 50, instead of zero, to improve data visualization.
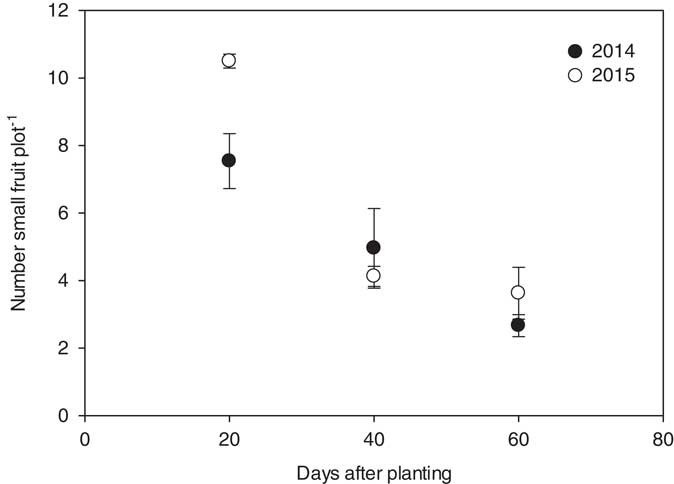
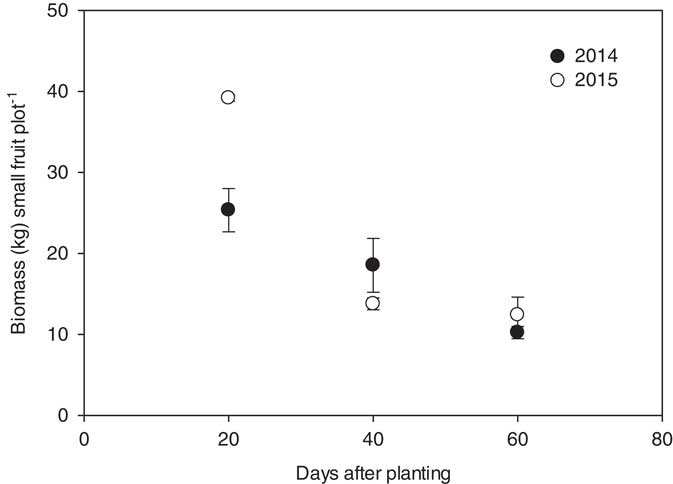
Nonmarketable fruit (≤4.5 kg in size) numbers and weights were recorded as an approach to determine a potential delay in crop maturity. In Georgia, watermelon harvest coincides with the Fourth of July, thus a one- or two-week delay in maturity could reduce marketable fruit value in excess of 33% (Bill Brim, Lewis Taylor Farms, Personal Communication). For both years, the numbers of nonmarketable melons produced per plot were affected by herbicide application timing only; the effects of herbicide and rate and the interactions between main effects were not significant. In 2014 and 2015, the nontreated controls yielded 18 and 13 kg of small fruit per plot, respectively. Greater numbers of nonmarketable melons were produced when herbicides were applied at 20 DAP (7 and 11 fruit plot−1) as compared to 40 DAP (5 and 4 fruit plot−1) and 60 DAP (3 and 4 fruit plot−1) (Figure 7). Six and four small, nonmarketable fruit were produced per plot in the nontreated checks in 2014 and 2015, respectively. Similar trends were observed for small fruit biomass. In 2014, 25, 19, and 10 kg of small fruit were produced per plot, averaged over rate, when either 2,4-D or dicamba was applied to watermelon at 20, 40, and 60 DAP. In 2015, the total mass of fruit produced per plot at 20, 40, and 60 DAP was 39, 14, and 12 kg, respectively (Figure 8).
Number of small, nonmarketable watermelon fruit (≤4.5 kg) production plot−1 for 2014 and 2015 in response to the timing of treatments with respect to planting. Nonmarketable fruit number data for 2014 were linearly regressed against application date using the equation y 2014=9.9–0.12x (R2=0.65). Number data for 2015 were linearly regressed against application date using the equation y 2015=13−0.17x (R2=0.75). Data were averaged over herbicides and rates.
Biomass of small, nonmarketable watermelon fruit (≤4.5 kg) production plot−1 for 2014 and 2015 in response to the timing of treatments with respect to planting. Nonmarketable fruit biomass data for 2014 were linearly regressed against application date using the equation y 2014=33.3–0.38x (R2=0.67). Biomass data for 2015 were linearly regressed against application date using the equation y 2015=48.6−0.67x (R2=0.76). Data were averaged over herbicides and rates.
In 2014, no herbicide residue was detected in melon fruit treated with 2.4-D, regardless of rate and timing of applications. Similarly, no dicamba residue was detected in fruit from plots that were treated with the 1/250 use rate, regardless of application date. For dicamba applied at the 1/75 rate at 40 and 60 DAP, laboratory testing identified herbicide residue at a concentration of 0.010 ppm. In 2015, 2,4-D residues were detected in fruit that was treated with 1/75 and 1/250 rates at 60 DAP, although the concentrations were less than 0.010 ppm. Dicamba residues for both the 40 and 60 DAP application were 0.030 and 0.010 ppm for the 1/75 and 1/250 rates, respectively. No residues were found in any samples collected from the nontreated checks for both years; dicamba was never detected in samples treated with 2,4-D and vice versa.
Drift of 2,4-D or dicamba to watermelons poses a serious risk for visual injury, reduced vine growth, yield loss, and detectable residue in marketable fruit. The greatest factor influencing the level of damage observed from 2,4-D or dicamba is the stage of melon growth at time of the incident. For visual injury, vine growth, and yield, damage in the vegetative stage of growth will often lead to greater injury and vine length reductions as well as lower yields as compared to damage on more mature melons. However, the opposite scenario occurs with herbicide residues, as the potential for herbicide residue detection is more likely in fruit where damage occurs closer to harvest. Although our research consistently showed more negative impact from a 1/75 rate as compared to a 1/250 rate, the rate factor was far less influential than the stage of growth factor. For watermelon, minimal differences were noted when comparing 2,4-D and dicamba, although greater vine growth reduction and residue detection were noted with dicamba.


