


1. Introduction
When investigating understudied languages, it is often necessary to analyze the prosodic system from scratch. In other cases, there are previous analyses of the prosodic system which stem from largely impressionistic descriptions, usually by non-native speakers, without any formal study of the acoustic properties utilized in the language. This can lead to a lack of consensus in accounts of the system in question, as researchers are guided by their individual subjective interpretations of what they hear, rather than by the acoustic facts.
Plains Cree is a case in point. Despite no formal phonetic analysis (production or perception) having been conducted, stress is widely assumed on the antepenultimate syllable of polysyllabic words (Bloomfield Reference Bloomfield1930; Edwards Reference Edwards1954; Pentland Reference Pentland1979; Cook Reference Cook and Cowan1991; Wolfart Reference Wolfart and Goddard1996; Russell & Reinholtz Reference Russell, Reinholtz, Agbayani and Tang1997; Russell Reference Russell, Alan Hall and Kleinhenz1999; Rosen Reference Rosen2006, Reference Rosen2007; Flynn Reference Flynn2008; Okimāsis & Wolvengrey Reference Okimāsis and Wolvengrey2008; Wolvengrey Reference Wolvengrey2011; Shwayder Reference Shwayder2015; McLeod & Wolvengrey Reference McLeod and Wolvengrey2016; Buckley Reference Buckley, Daniel Siddiqi, Gillon, Haugen and Mathieu2020: 74; Bogomolets Reference Bogomolets and van de Weijer2023: 80, fn. 8; Gordon Reference Gordon, Dagostino, Mithun and Rice2023: 149–150; Rice Reference Rice, Bogomolets and van der Hulst2023: 131–132; Zykoski Reference Zykoski2023: 19ff.). However, there have also been claims of primary stress falling on the final syllable (Lacombe Reference Lacombe1874) or the penultimate (Edwards Reference Edwards1954; MacKenzie Reference MacKenzie1980; Mühlbauer Reference Mühlbauer and Wolfart2006). As one expert bemoans:
Unfortunately, extremely little is certain about the prosody of Plains Cree—there is not even agreement over such basic questions as which syllable of a word stress falls on or whether Cree even has a stress system as such. (Russell Reference Russell2008: 459)
Citing Mühlbauer (Reference Mühlbauer and Wolfart2006), Himmelmann (Reference Himmelmann2023) highlights that “three different authors, one of them being Leonard Bloomfield, hear stress differently in Plains Cree” (p. 349, fn. 5) and suggests that the problem is rather general in stress studies:
As for the auditory prominence of stressed syllables, most statements on this topic in the literature are impressionistic. That is, the analysts hear one syllable in a word as more prominent. But a number of studies have made amply clear that hearers are strongly influenced by their native language(s) with regard to hearing prominence. (Himmelmann Reference Himmelmann2023: 349)
Himmelmann (Reference Himmelmann2023) argues that the most promising solution to this general problem is to study the acoustic and auditory prominence of stress with special attention to differences between words and phrases (see also Gordon Reference Gordon and van der Hulst2014 and van Heuven Reference van Heuven, Goedemans, Heinz and van der Hulst2018). In this vein, the present study investigates the acoustic properties of word-level prosody in Plains Cree in an effort to explain the disagreements in the extant literature. The patterns we uncover regarding duration and pitch of individual words and of words in phrases point to different prosodic patterns being interpreted as prominence in the literature. After providing some general information about Plains Cree (section 2), we present our investigation of individual words (section 3) and of words in phrases (section 4). We then discuss our results from both sets of data in relation to the position of prominence and its typological status in Plains Cree (section 5) and conclude with a summary of our main points (section 6).
2. Plains Cree
Cree, a member of the Algonquian family, is the largest Indigenous language in Canada both in terms of geographical distribution and in terms of speakers. It forms a dialect continuum all across the country, from Labrador on the Atlantic Ocean (Naskapi and Innu dialects) to British Columbia on the Pacific Ocean (Plains Cree dialect). There are approximately 103,655 native speakers of Cree (Cook & Flynn Reference Cook, Flynn, Archibald and O’Grady2020). About a third of these speakers know Plains Cree, which is considered vulnerable in terms of language endangerment (Moseley Reference Moseley2010). In the United States, 870 report Cree (no dialect specified) as a home language (U.S. Census Bureau 2015).
2.1 The segmental system
In Plains Cree, there are four contrastive vowel qualities and two contrastive length categories (as shown in Figure 1). These short and long counterparts also differ in quality, with long vowels being more peripheral or tense than short lax vowels (Mühlbauer Reference Mühlbauer2012; Harrigan & Tucker Reference Harrigan and Tucker2015; Athanasopoulou & Flynn Reference Athanasopoulou and Flynn2018). Long vowels are approximately 2 to 2.5 times longer than the short vowels. The only vowel with no short counterpart is long /eː/, which is very close in quality to the short /i/. There is also some evidence that duration is not always a reliable cue to distinguish the two vowel length categories, at least in some positions (e.g., syllables with /h/-coda; Athanasopoulou & Flynn Reference Athanasopoulou and Flynn2018). All this has been taken as evidence by some that the Plains Cree vowel system is changing into a system that no longer has contrastive vowel length (e.g., Athanasopoulou & Flynn Reference Athanasopoulou and Flynn2018), a change that Eastern varieties have already completed (Dyck, Junker & Longan Reference Dyck, Junker, Logan, Rogers and Szakay2010).

The consonants of the language include the glides /j/ and /w/, the stops /p/, /t/, and /k/, the affricate /t͡s/ (sometimes /t͡ʃ/), the fricatives /s/ and /h/, and the nasals /m/ and /n/. We only draw attention to two phonological phenomena that are pertinent to the present study, as a full description of the sound system is beyond the scope of this article. For more detailed descriptions of the Plains Cree sound system, see among others, Wolfart and Carroll (Reference Christoph and Carroll1981), Ellis (Reference Ellis2000), McLeod and Wolvengrey (Reference McLeod and Wolvengrey2016), and Okimāsis (Reference Okimāsis2018). The first phenomenon we wish to highlight is the ubiquity of aspiration (Hodgson et al. Reference Hodgson, Windsor and Flynn2019), which is often present at the end of a word or phrase without necessarily being present in the written forms of words, as in (1).Footnote 1 In section 3 we will discuss how we treated items with final glottal frication, whether written or not.
(1) Examples of final aspiration, [h] Footnote 2

Vowel deletion is another pervasive process in Plains Cree that results in the frequent absence of short vowels (particularly /i/), as in (2a). This deletion can take place in any syllable position, in sequences of vowels, and in sequences of vowels and glides, causing some compensatory lengthening, as in (2b–d). The latter has been described as vowel coalescence (Wolfart Reference Wolfart and Goddard1996; Russell Reference Russell2008; Harrigan & Tucker Reference Harrigan and Tucker2015). For further discussion on vowel deletion, see Cook (Reference Cook and Cowan1991), Russell (Reference Russell2008), Wolfart (Reference Wolfart and Goddard1996), and Harrigan and Tucker (Reference Harrigan and Tucker2015). What is relevant for our study is that we avoided words with deletion or coalescence, as we will describe in section 3.
(2) Examples of vowel deletion (a–b) and coalescence (c–d) Footnote 3

2.2 The prosodic system
Stress is not contrastive in Plains Cree; there are no minimal pairs that differ only in stress since the position of stress is fixed (Bloomfield Reference Bloomfield1930; Longacre Reference Longacre1957; Wolfart Reference Wolfart1973). There is no agreement, however, about the location of stress or its acoustic nature. There are contradictory accounts that locate stress in the final syllable (e.g., Lacombe Reference Lacombe1874), in the penult (e.g., Mühlbauer Reference Mühlbauer and Wolfart2006), in the final of disyllabic words and in the antepenult of longer words (e.g., Wolfart Reference Wolfart and Goddard1996), in the penult of disyllabic words and in the antepenult of longer words (e.g., Russell Reference Russell, Alan Hall and Kleinhenz1999), in the penult or antepenult depending on which has a long vowel (e.g., Longacre Reference Longacre1957), in the penult if it has a long vowel, else in the antepenult (e.g., Edwards Reference Edwards1954), in the final if it has a long vowel, else in the penult or antepenult (e.g., MacKenzie Reference MacKenzie1980), and so on. These accounts stem primarily from impressionistic data, with no formal acoustic analysis to clarify the exact acoustic dimensions defining prosodic prominence and their perception.
The most commonly accepted description of Plains Cree stress position is the antepenultimate syllable. As one of the first descriptions from Bloomfield (Reference Bloomfield1930) puts it, “[a] non-significant stress accent falls on the third syllable from the ends of words or close-knit phrases” (p. 2; see also Edwards Reference Edwards1954: 5.3; Pentland Reference Pentland1979: 118; Cook Reference Cook and Cowan1991: 22–24; Wolfart Reference Wolfart and Goddard1996: 431; Russell & Reinholtz Reference Russell, Reinholtz, Agbayani and Tang1997; Russell Reference Russell, Alan Hall and Kleinhenz1999: 208; Rosen Reference Rosen2006: 181, Reference Rosen2007: 230; Okimāsis & Wolvengrey Reference Okimāsis and Wolvengrey2008: 11–12, 41ff.; Wolvengrey Reference Wolvengrey2011: xxiv; Shwayder Reference Shwayder2015: 137; McLeod & Wolvengrey Reference McLeod and Wolvengrey2016: 275; Buckley Reference Buckley, Daniel Siddiqi, Gillon, Haugen and Mathieu2020: 74; Bogomolets Reference Bogomolets and van de Weijer2023: 80, fn. 8; Gordon Reference Gordon, Dagostino, Mithun and Rice2023: 149–150; Rice Reference Rice, Bogomolets and van der Hulst2023: 131–132; Zykoski Reference Zykoski2023: 19ff.). See examples in (3). This pattern has been analyzed with a right-to-left iambic foot structure and a left prominence at the phonological word level (Rosen Reference Rosen2006, Reference Rosen2007). Note that the last foot is analyzed as extrametrical in words like (3c).
(3) Examples of antepenult stress and foot structure. (F=Foot, PW=Phonological Word)

As mentioned in Bloomfield’s quote above, disyllabic words are said to participate in the stress assignment of the preceding word when the two words are grouped in a “close-knit” phrase (4). (See section 4 for a discussion of “close-knit” phrases.) In this case, disyllabic words behave similarly to suffixes and the stress is assigned to the antepenult of the whole phrase. Mühlbauer (Reference Mühlbauer and Wolfart2006) focuses on pitch falls in the penultimate syllable of nominals, but he observes a rising F0 in the antepenult of the whole phrase. We discuss Mühlbauer’s account later.
(4) Examples of antepenult stress in “close-knit” phrases.

When not so grouped with a preceding word, disyllabic words are widely described as having final stress (Edwards Reference Edwards1954; Longacre Reference Longacre1957; Pentland Reference Pentland1979; Wolfart Reference Wolfart and Goddard1996; Rosen Reference Rosen2006, Reference Rosen2007; Flynn Reference Flynn2008; Okimāsis & Wolvengrey Reference Okimāsis and Wolvengrey2008; Wolvengrey Reference Wolvengrey2011, Reference Wolvengrey, McLeod and Wolvengrey2016; Okimāsis Reference Okimāsis2018; Gordon Reference Gordon, Dagostino, Mithun and Rice2023: 149). These sources report final stress in disyllabic words even when the first syllable has a long vowel and the final has a short vowel (5a–b). Similarly, in longer words, the final syllable is said to bear secondary stress (see (5c–d); Edwards Reference Edwards1954: 5.3; Wolfart Reference Wolfart and Goddard1996; Okimāsis & Wolvengrey Reference Okimāsis and Wolvengrey2008; Buckley Reference Buckley, Daniel Siddiqi, Gillon, Haugen and Mathieu2020: 74; Gordon Reference Gordon, Dagostino, Mithun and Rice2023: 149–150; Rice Reference Rice, Bogomolets and van der Hulst2023: 132). In fact, there are claims of multiple secondary stresses in longer words falling on alternate syllables from the antepenult (ibid.). Other descriptions claim that vowel length plays a role in stress assignment: a penult with a long vowel is claimed to attract stress in longer words (Edwards Reference Edwards1954; Longacre Reference Longacre1957; Pentland Reference Pentland1979; MacKenzie Reference MacKenzie1980). Such quantity sensitivity is a general property of many Cree varieties according to MacKenzie (Reference MacKenzie1980: 48). More recently, however, specialists deny that vowel length plays any role in Cree stress assignment (Wolfart Reference Wolfart and Goddard1996; Rosen Reference Rosen2006, Reference Rosen2007; Flynn Reference Flynn2008; Okimāsis & Wolvengrey Reference Okimāsis and Wolvengrey2008; Wolvengrey Reference Wolvengrey2011, among others).
(5) Examples of final stress in disyllabic words (a–b) and final secondary stress in longer words (c–d)

Exceptions to the antepenultimate stress rule, such as (6a–b), are said by Cook (Reference Cook and Cowan1991) to involve penultimate vowel deletion (6a) or vowel-glide coalescence (6b); see also section 2.2 for discussion of these processes. According to Cook, these surface processes only obscure the normal antepenultimate location of stress. He reports that in cases where the antepenultimate vowel is deleted, stress shifts to the “new” antepenult (6c).Footnote 5
(6) Examples of interactions between stress and vowel deletion

Notwithstanding the ubiquity of antepenultimate stress in the literature, Lacombe (Reference Lacombe1874: xviii) claimed that word-final syllables are “accentuées” through vowel lengthening, suggesting a possible final stress. On the other hand, Russell (Reference Russell, Alan Hall and Kleinhenz1999) claims that disyllabic words show penultimate stress. Mühlbauer (Reference Mühlbauer and Wolfart2006) makes the stronger claim that the penult always carries a pitch prominence. Focusing on nominals, he concluded that the penult is the prominent syllable and analyzed this with a disyllabic trochaic foot, as in (7). While Mühlbauer focused on a specific part of the lexicon, previous works base their claims on a variety of word types (nouns, verbs, adjectives, etc.), so there is no indication that there is a stress pattern specific to word types. Moreover, all the accounts agree that stress is rule-based and not a property of the lexical items.
(7) Mühlbauer’s (Reference Mühlbauer and Wolfart2006) foot analysis and word-level prominence. Parentheses mark the foot (F)

The foregoing illustrates that debate also surrounds the claims about the acoustic features employed by the language, although the acoustic dimensions of stress are very often not defined. Lacombe (Reference Lacombe1874) implies that stress is realized with vowel lengthening and – anticipating Mühlbauer’s (Reference Mühlbauer and Wolfart2006) penultimate analysis – Edwards (Reference Edwards1954) reports that long vowels sound longer and short vowels sound shorter on the penult, whereas both vowel length categories sound shorter on the antepenult. Others counter that length does not play a role in determining the position of word stress (Rosen Reference Rosen2006), nor is it a cue to word stress (Wolvengrey Reference Wolvengrey, McLeod and Wolvengrey2016). Wolfart (Reference Wolfart and Goddard1996) believes that stress is a combination of intensity and pitch, while Cook (Reference Cook and Christoph Wolfart2006), who does not discuss the location of stress, notes that pitch has a “privileged status” in the Plains Cree prosodic system. Mühlbauer (Reference Mühlbauer and Wolfart2006) also argues for a special role of pitch, arguing for a pitch fall on the prominent syllable (penult), which is assigned “via right-edge anchoring of a trochaic foot” (p. 259). Mühlbauer’s study of nominals is the only one that relies on acoustic data (connected speech) as opposed to impressionistic data in other studies, but he did not perform a formal acoustic analysis; he only described the pitch contours of an unspecified number of utterances in his corpus; he “repetitively listened to the audio while simultaneously visually tracking the spectral information [with Praat]” (Mühlbauer Reference Mühlbauer and Wolfart2006: 235). Moreover, although he argues for a regular pitch fall on the penult, he denies the claim that Plains Cree is a pitch-accent language (like, say, Japanese), suggesting instead that it does not fit into any of the word-prominence categories of prosodic typology. Similarly, Cook (Reference Cook and Cowan1991) suggests on the basis of stress shifts with vowel deletion (6) “that “accent” is a more appropriate term to use until more is known about the rhythmic pattern of Cree” (p. 29), but he abstains from characterizing Plains Cree as a pitch-accent language.
Others warn that pitch is somewhat independent of stress in Plains Cree. Edwards (Reference Edwards1954) remarks that a high tone on the antepenult might be confused with stress by English speakers. Longacre (Reference Longacre1957) also claims that the high pitch of the antepenult is more regular than stress, which may fall on the antepenult or penult. For disyllabic words, Longacre claims the opposite: stress position is on the final syllable, while the pitch pattern varies depending on the presence or absence of focus (“emphasis”). The point made by Edwards and Longacre is well taken: they argue that stress falls on the penult when the vowel there is long, yet non-native speakers may misperceive stress in another syllable, due to pitch. By contrast, speaker-linguist Okimāsis (Reference Okimāsis2018) insists that stress is always final in disyllables and always antepenultimate in longer words and she warns:
Those who are not speakers of Cree quite often place the stress on the second-last syllable because they are following the English system. They might also place the stress on the long vowels of Cree, especially if the second-last syllable contains a long vowel. However, that still wouldn’t necessarily be the correct pronunciation. (Okimāsis Reference Okimāsis2018: 6–7)
Due to the previous accounts of stress location in Plains Cree being in conflict and stemming from largely impressionistic descriptions, it is necessary to conduct a formal analysis of the acoustic properties of the language to better understand these descriptions and ultimately, the language’s word-level prominence. A necessary future step is to conduct a perception study to investigate how the acoustic properties are interpreted by the native speakers. The present study focuses exclusively on the acoustic analysis.
3. The investigation of individual word prosody
The goal of the present study is to inform the current debate about the position of word-level prominence in Plains Cree by investigating the acoustic properties of prosody (duration, F0, intensity, vowel quality) in each syllable in words with three or more syllables. As we discussed in section 2, disyllabic words behave differently than words with three or more syllables. We focus on polysyllabic words, which are the most common words in the language (especially for content words) and we exclude disyllabic ones, which are more common among function words. We also focus on primary stress, because the evidence for secondary stress is scarce and its conditions are less well understood than for primary stress. We briefly discuss disyllabic words in section 4 and some implications of our study for disyllabic word stress and secondary stress in section 5. Future studies should test claims about the position of stress in disyllabic words and about the existence of secondary stress presented in section 2.
As syllable nuclei, vowels are usually the primary bearers of phonetic features that signal greater word-level prominence, with a stressed syllable potentially having longer duration, increased F0, increased intensity, and/or more peripheral vowel quality (e.g., Lehiste Reference Lehiste1970). Given the previous contradictory accounts of Plains Cree word-level prominence discussed above, we analyzed the duration, F0, intensity, and vowel quality of the last three syllables of multisyllabic words to test two opposing hypotheses (8). If Wolfart’s (Reference Wolfart and Goddard1996) account is correct, and the antepenult is prominent, then the antepenult has longer duration, higher F0 and intensity, or more peripheral vowel qualities than the other syllables, or a combination of these properties (Hypothesis A). If Mühlbauer’s (Reference Mühlbauer and Wolfart2006) account of prominence in nominals is correct, and the penult is prominent, then the penult has longer duration, higher F0 and intensity, or more peripheral vowel qualities than the other syllables, or a combination of these properties (Hypothesis B).
(8) Hypotheses tested and predictions for the position of word-level prominence in Plains Cree.
-
Hypothesis A: Plains Cree prominent syllable is the antepenult. (cf. Wolfart Reference Wolfart and Goddard1996)
-
Prediction: The antepenult has longer duration, higher F0 and intensity, or has more peripheral vowel qualities than the penultimate and final syllables, or a combination of these properties.
-
Hypothesis B: Plains Cree prominent syllable is the penult. (cf. Mühlbauer Reference Mühlbauer and Wolfart2006)
-
Prediction: The penult has longer duration, higher F0 and intensity, or has more peripheral vowel qualities than the antepenultimate and final syllables, or a combination of these properties.
Even though we do not hypothesize that the final syllable is stressed, as claimed by Lacombe (Reference Lacombe1874), we also included this syllable in the analysis for the sake of completion and having a clearer picture of the prosody at the end of the word. A future study focused on final syllable prominence should include disyllabic words as well as longer words.
3.1 Data
We analyzed publicly available recordings of Plains Cree translations of the Book of Mark and Psalms (Canadian Bible Society 2010) read by Ms. Dolores Sand from Muskeg Lake Cree Nation in central Saskatchewan, Canada. Ms. Sand was 58 years old at the time of recording. Translations were done by a group in Saskatoon with input from the local Plains Cree community. The recordings were made in 2010 and are approximately four hours in duration. All were WAV files with a sampling rate of 44,100 Hz. No consultation with the local Cree community was done for the present study.
Target vowels were segmented in Praat (Boersma & Weenink Reference Boersma and Weenink2019) from the last three syllables of individual words of three or more syllables. Any word with at least three syllables was included in the analysis. Table 1 shows some examples of the words analyzed. Vowels from words having undergone vowel deletion or coalescence (see section 2.2) were not included in the data, to avoid any potential effects of compensatory lengthening. It would be interesting to investigate these words in future studies to determine how word-level prominence may change after the deletion/coalescence. Due to the ubiquity of glides (especially /w/), vowels adjacent to glides were included in order to maximize the number of collectable tokens and to gain a more comprehensive picture of the language. We discuss our segmentation procedure in section 3.2. Since the recordings were not controlled, we included both open and closed syllables and words produced in isolation or at different positions in the utterance, including utterance finally. There were not enough data to separate each utterance position in the analysis, but a preliminary comparison showed no differences between the positions. (See also section 4.4 for some comparisons between phrase-final and non-final positions.)
Examples of stimuli from individual words for vowel /i/ (target is bolded)

Both short and long vowels as well as vowels from all four vowel qualities were collected for analysis. In total, 367 vowels were included in the analysis, but due to the nature of the recordings, we were not able to include equal number of vowels for each category. See Table 2 for a count of items in each category. Each target was labeled for length, quality, and syllable position.
Number of vowels from individual words included in the analysis in each vowel category and syllable position

3.2 Acoustic analysis
We extracted the properties of segmented vowels using a modified Praat script (originally written by Katherine Crosswhite) that analyzed length, pitch, loudness, and vowel quality measurements that are typical for prosody, specifically duration, intensity, F0, F1, and F2.
Examples of vowel-aspiration, vowel-glide, and glide-vowel segmentation boundaries. The word is omîmîwa ᐅᒦᒦᐘ ‘dove, pigeon’. “ASP” indicates the word-final aspiration.

In order to avoid aspiration affecting the duration measurement of a vowel, aspiration was not included in the segmentation of the vowels: we placed the vowel boundary when the phonation was no longer modal. See examples in Figures 2 and 3. Vowels adjacent to glides (i.e., /V-w-V/) were included in the analysis, but the glides themselves were not segmented. Vowel-glide boundaries can be difficult to identify, so for consistency, we ended the vowel segmentation boundary as soon as the third formant decreased in intensity and F2 dramatically changed trajectory. See, for example, the segmentation of /iː/, /w/, and /a/ in Figure 2. The exception to this was when a glide occurred word-finally after a long vowel (seven cases), where there was always vowel-glide coalescence (see discussion in section 2.1). In these cases, it was impossible to detect the boundary between the glide and the vowel, and the vowel+glide sequence was as long as a long vowel (e.g., compare /aː/ and /aːw/ in Figure 3). In order to remain consistent, glides were always included in the segmentation of the final vowel, if a glide was present in the coda.Footnote 6
Examples of vowel-aspiration, vowel-glide, and glide-vowel segmentation boundaries. The word is kitisîhtânâwâw ᑭᑎᓰᐦᑖᓈᐚᐤ followed by ita ᐃᑕ ‘there, where’. “ASP” indicates the word-final aspiration.

For intensity and F0, we measured the average for the duration of the whole vowel, but to also capture how F0 changes during each vowel, the vowels were divided into quarters, and we measured the average F0 in each quarter. We subtracted the average F0 at the last vowel quarter (Q4) from the F0 at the first quarter (Q1) as a measurement of F0 contour. We also calculated when the maximum and minimum F0 occurred in each vowel as a percentage of each vowel’s duration, to normalize for vowel duration differences.
The two vowel formants, average F1 and F2, were measured in the middle two quarters of the vowel (Q2 and Q3), to avoid coarticulation effects from adjacent segments. Next, the formants were normalized based on the minimum and maximum formant values (Winn et al. Reference Winn, Allison Blodgett, Anita Bowles, Rytting and Shamoo2008). To measure how much each vowel is centralized, we calculated the Euclidean distance of each vowel from the center of the vowel space.
3.3 Statistical analysis
To statistically analyze the data, we ran a MANOVA in SPSS (IBM Corp 2019). Syllable Position (final, penult, antepenult) and Length (long and short vowels) were the independent variables. The duration (ms), average intensity (dB), average F0 (Hz), F0 contour (Hz), and vowel centralization (distance from vowel center) were the dependent variables.
3.4 Results
There was a significant main effect of Syllable (Wilks’ $\lambda$
=.200, F(12, 688)=70.9, p<.001, partial-
$\lambda$
=.200, F(12, 688)=70.9, p<.001, partial- $\eta$
2
=.553) and Length (Wilks’
$\eta$
2
=.553) and Length (Wilks’ $\lambda$
=.472, F(6, 344)=64.3, p<.001, partial-
$\lambda$
=.472, F(6, 344)=64.3, p<.001, partial- $\eta$
2
=.528). There was also a significant interaction between Syllable and Length (Wilks’
$\eta$
2
=.528). There was also a significant interaction between Syllable and Length (Wilks’ $\lambda$
=.844, F(12, 688)=5.1, p<.001, partial-
$\lambda$
=.844, F(12, 688)=5.1, p<.001, partial- $\eta$
2
=.081).
$\eta$
2
=.081).
Each significant MANOVA effect and interaction was followed up with an ANOVA. We ran posthoc tests with Bonferroni correction for multiple comparisons when relevant to further explore the role of each dependent variable found to be significant in the ANOVAs. Each measurement is discussed separately below.
3.4.1 Duration
For Duration (Figure 4), we found a significant main effect of Syllable (F(2, 349)=30.2, p<.001, partial- $\eta$
2
=.147) and Length (F(1, 349)=345.1, p<.001, partial-
$\eta$
2
=.147) and Length (F(1, 349)=345.1, p<.001, partial- $\eta$
2
=.497), and a significant interaction between Syllable and Length (F(2, 349)=5.2, p=.006, partial-
$\eta$
2
=.497), and a significant interaction between Syllable and Length (F(2, 349)=5.2, p=.006, partial- $\eta$
2
=.029). These results indicate that the length categories and syllable positions differ in duration, but these differences are not the same across all the groups.
$\eta$
2
=.029). These results indicate that the length categories and syllable positions differ in duration, but these differences are not the same across all the groups.
Duration in milliseconds for each vowel length and syllable category in individual words. The error bars represent the standard error of the mean.

First, considering the two length categories, the short vowels were 39% to 53% shorter than the long vowels. This difference was found to be significant for all three syllable positions: antepenult (p<.001), penult (p<.001), and final (p<.001).
Next, we also found differences in Duration between the three syllables. For the long vowels, the antepenult was shorter by 43 ms than the penult (p<.001), and by 29 ms than the final (p<.001). The last two syllables did not differ statistically (p=.144), but numerically the penult was 14 ms longer than the final. For the short vowels, we again found that the antepenult was shorter between 28 and 43 ms than the other two syllables (p<.001), but we also found that the penult was 15 ms shorter than the final (p=.027).
Overall, the duration patterns in individual words show a length distinction between short and long vowels. We found that the short vowels are roughly 50% the length of the long vowels in all syllable positions. There were duration differences between the syllables, however. The antepenultimate syllable is the shortest among the three tested here, while the relation between the penult and final differs depending on the length of the vowel: for the short category, vowels gradually lengthen towards the end of the word, but for the long category, the penult and final are equally long.
3.4.2 Vowel centralization
For vowel centralization (Figure 5), we only found a main effect of Length (F(1, 349)=27.7, p<.001, partial- $\eta$
2
=.074). Inspection of the data showed that the short vowels (M=0.274) were more centralized than the long vowels (M=0.34). Since the main effect of Syllable (F(2, 349)=.75, p=.47, partial-
$\eta$
2
=.074). Inspection of the data showed that the short vowels (M=0.274) were more centralized than the long vowels (M=0.34). Since the main effect of Syllable (F(2, 349)=.75, p=.47, partial- $\eta$
2
=.004) and the interaction between Syllable and Length were not significant (F(2, 349)=1.35, p=.262, partial-
$\eta$
2
=.004) and the interaction between Syllable and Length were not significant (F(2, 349)=1.35, p=.262, partial- $\eta$
2
=.008), we will not explore this data further.
$\eta$
2
=.008), we will not explore this data further.
Vowel space by vowel length (V = short, V: = long) and syllable (ant = antepenult, pen = penult, fin = final). Dashed lines indicate the vowel space of the long vowels. Solid lines indicate the vowel space of the short vowels.

3.4.3 Intensity
For intensity (Figure 6), we found a significant main effect of Syllable (F(2, 349)=44.5, p<.001, partial- $\eta$
2
=.203) and Length (F(1, 349)=9.35, p=.002, partial-
$\eta$
2
=.203) and Length (F(1, 349)=9.35, p=.002, partial- $\eta$
2
=.026), but the interaction between Syllable and Length was not significant (F(2, 349)=.022, p=.978, partial-
$\eta$
2
=.026), but the interaction between Syllable and Length was not significant (F(2, 349)=.022, p=.978, partial- $\eta$
2
<.001). The intensity values across the categories ranged between 74.71 and 78.48 dB. The long vowels were 1.1 dB louder than the short vowels (p<.001) and the final syllable was 2.87 dB quieter than the penult (p<.001) and 2.72 dB quieter than the antepenult (p<.001), but the penult and antepenult were not statistically different in intensity (p=1.0).
$\eta$
2
<.001). The intensity values across the categories ranged between 74.71 and 78.48 dB. The long vowels were 1.1 dB louder than the short vowels (p<.001) and the final syllable was 2.87 dB quieter than the penult (p<.001) and 2.72 dB quieter than the antepenult (p<.001), but the penult and antepenult were not statistically different in intensity (p=1.0).
Intensity in dB for each vowel length and syllable category in individual words. The error bars represent the standard error of the mean.

Overall, we found that long vowels are a bit louder than short ones, and both are loudest in the antepenultimate and penultimate syllables in comparison to final syllables.
3.4.4 Average F0
For F0 (Figure 7), we found a significant main effect of Syllable (F(2, 349)=176.9, p<.001, partial- $\eta$
2
=.503), but the main effect of Length (F(1, 349)=3.6, p=.058, partial-
$\eta$
2
=.503), but the main effect of Length (F(1, 349)=3.6, p=.058, partial- $\eta$
2
=.01) and the interaction between Syllable and Length (F(2, 349)=2.3, p=.102, partial-
$\eta$
2
=.01) and the interaction between Syllable and Length (F(2, 349)=2.3, p=.102, partial- $\eta$
2
=.013) were not statistically significant. This means that the F0 patterns of the short vowels were similar to the long vowels’ patterns, but the syllables differed in F0. Specifically, we found that the antepenult was 12 Hz higher in F0 than the penult (p<.001) and 50 Hz higher than the final (p<.001). We also found that the penult was 38 Hz higher than the final (p<.001).
$\eta$
2
=.013) were not statistically significant. This means that the F0 patterns of the short vowels were similar to the long vowels’ patterns, but the syllables differed in F0. Specifically, we found that the antepenult was 12 Hz higher in F0 than the penult (p<.001) and 50 Hz higher than the final (p<.001). We also found that the penult was 38 Hz higher than the final (p<.001).
Average F0 in Hz for each vowel length and syllable category in individual words. The error bars represent the standard error of the mean.

Overall, we found no differences in average F0 between the long and short vowels. For both, F0 gets reduced gradually towards the end of the word.
3.4.5 F0 contours
For F0 contours (Figure 8), we found a significant main effect of Syllable (F(2, 349)=196.4, p<.001, partial- $\eta$
2
=.530) and a significant interaction between Syllable and Length (F(2, 349)=19.7, p<.001, partial-
$\eta$
2
=.530) and a significant interaction between Syllable and Length (F(2, 349)=19.7, p<.001, partial- $\eta$
2
=.101). The main effect of Length was not statistically significant (F(1, 349)=3.5, p=.062, partial-
$\eta$
2
=.101). The main effect of Length was not statistically significant (F(1, 349)=3.5, p=.062, partial- $\eta$
2
=.01). These results indicate that the F0 contour differs between the syllables, and these differences are not the same for both length categories.
$\eta$
2
=.01). These results indicate that the F0 contour differs between the syllables, and these differences are not the same for both length categories.
F0 in Hz at the beginning (Q1 = first vowel quarter) and end of a vowel (Q4 = last vowel quarter) for each vowel length and syllable category in individual words. The error bars represent the standard error of the mean.

For both long and short vowels, the penultimate syllable had a falling contour, which was larger for the long vowels (38 Hz difference from the beginning to the end of the vowel) than the short vowels (25 Hz difference; p<.001). We also found a falling contour on the final syllable, but it was much smaller than the penult fall (p<.001). Specifically, the long vowels’ F0 fell by 13 Hz towards the end of the word, while the fall for short vowels was smaller (p=.01), with only 5 Hz decrease. Finally, the antepenultimate syllable had a rising contour, which was different from the falling penultimate (p<.001) and final contours (p<.001). The two length categories, however, differed significantly in how much the F0 rose within the antepenult (p=.002). The long vowels had a larger F0 increase towards the end of the vowel (14 Hz) than the short vowels, which were essentially flat with a 2 Hz increase of F0 at the end of the vowel.
Turning to the timing of the F0 changes discussed here, we looked at what time (percent of vowel duration) the min and max F0 of each vowel occurred (Figure 9). We found that the falling F0 contour of the penult starts right at the beginning of the vowel (early in Q1: 8% of the vowel duration for the short and 3% for the long vowels) and continues until the end of the vowel (late in Q4: 96% of the vowel duration for the short and 99% for the long vowels). In contrast, the min and max F0 of the other syllables occur in Q2 and Q3. Specifically, the antepenult with long vowels, which has a rising F0 contour, has max F0 in Q3 (68% of the vowel duration) and min F0 in Q2 (30% of the vowel duration). The antepenult with short vowels, which has a flat F0 contour, has max and min F0 at the beginning of Q3 (51% of the vowel duration for max and 54% for min). The long vowels in the final syllable, which have a falling F0 contour, have max F0 in the end of Q1 (20% of the vowel duration) and min F0 at the beginning of Q4. The short vowels in the final syllable, which have flat F0 contour, have max F0 in Q2 (38% of the vowel duration) and min F0 in Q3 (68% of vowel duration).
Average percentage of vowel duration that max and min F0 of the vowel occurs for each vowel length and syllable category in individual words. The arrows show the direction of the F0. Q1 to Q4 mark each vowel quarter. The error bars represent the standard error of the mean.

Overall, we found a difference in the direction of the F0 contours between the syllables. The most notable contour is the falling F0 of the penult, which occupies the duration of the whole vowel, in contrast to the flatter antepenult and final contours, which occur in the middle of the vowels. We also found a difference in the degree the F0 changes between the long and the short vowels. For all syllable positions, the long vowels have a larger change in F0 than the short vowels, especially in the antepenult and final, where the short vowels have an essentially flat F0 contour with a F0 change between 2 and 5 Hz.
3.5 Discussion
We analyzed data from the last three syllables of words with three or more syllables to investigate which syllable in Plains Cree has enhanced acoustic properties that could be linked to the claims in the literature about word-level prominence. We measured four typical acoustic properties of prosody on each syllable, predicting that the prominent syllable would exhibit an enhancement of duration, F0, intensity, and vowel quality, which can be taken as evidence of prominence. The analysis of the data, however, did not reveal a clear pattern, supporting none of the hypotheses in (8). That is, we do not find a clear enhancement of the acoustic properties of prosody for either antepenultimate (Hypothesis A compatible with Wolfart (Reference Wolfart and Goddard1996)) or penultimate syllable (Hypothesis B compatible with Mühlbauer’s (Reference Mühlbauer and Wolfart2006) description of nominals). We also found no evidence of enhancement for the final syllable, which was not part of our hypotheses, but included for the sake of completion.
Vowel centralization and intensity did not show any noteworthy patterns in the data, so our discussion is focused on duration and F0. We found longer duration on the last two syllables of the word in comparison to the antepenult, but whether the penult or the final is the longest syllable depends on the length category of the vowel: for the short vowels, the final vowel is longer than the penult, while for the long vowels, there is no difference between the two. It is possible that the difference between the length categories is due to the segmental context of the vowels, since we were not able to control for syllable structure and adjacent consonants. As discussed in section 2.2, phrase-final aspiration may have played a role here (Hodgson et al. Reference Hodgson, Windsor and Flynn2019). It is possible that the final long vowels were affected more from the final aspiration (i.e., the phonation changed earlier), causing them to be segmented shorter than the short vowels. Overall, we find that the penultimate syllable is lengthened similarly to the final syllable. The lengthening of the penult may be due to its phonological status as a prosodically prominent position in the phonological word, whereas the lengthening of the ultima may be understood as a phrasal boundary effect. This final lengthening may lie behind the descriptions of Plains Cree with final primary or secondary word-level stress (Lacombe Reference Lacombe1874; Wolfart Reference Wolfart and Goddard1996; Okimāsis & Wolvengrey Reference Okimāsis and Wolvengrey2008; Buckley Reference Buckley, Daniel Siddiqi, Gillon, Haugen and Mathieu2020: 74; Gordon Reference Gordon, Dagostino, Mithun and Rice2023: 149–150; Rice Reference Rice, Bogomolets and van der Hulst2023: 132).
The average F0 patterns were the mirror image of duration’s gradual lengthening: the highest F0 is found on the antepenult and it gradually gets lower towards the end of the word, with the final syllable having a more noticeable drop in F0 than the penult. Again, there is no indication of enhancement of one of the syllables, only the expected gradual lowering of F0 as we move to the end of a prosodic domain.
The F0 contours revealed a different picture than duration and average F0 did. There is a falling F0 contour on the penultimate syllable, which occupies the whole length of the vowel and which is not affected by the vowel’s length category. By contrast, the contours in the antepenultimate and final syllables are much smoother, occupy half of each vowel length, and depend on the vowel length category. Starting with the final syllable, the F0 contour for the short vowels is flat, whereas the contour for the long vowels is falling. We do not take the falling F0 of final long vowels as evidence of a HL pitch-accent on the final syllable as we did for the penult, but rather as evidence of low F0 being expressed differently due to the timing differences between the long and short vowels. Although both vowel length categories start at the same F0 height (Q1) in final syllables, the long vowels are twice as long as the short vowels so their F0 continues to fall, but only by 13 Hz, very close to the just-noticeable-difference (Jongman et al. Reference Jongman, Qin and Zhang2017). By contrast, in the penultimate syllable, both vowel length categories have the same (falling) contours and length only affects the sharpness of that contour, going from a 25 Hz fall in the short to a 38 Hz fall in the long vowels.
The max and min of the penult are also anchored at the very beginning and end of the vowel, respectively, maximizing the distance between the two, while in the final syllable, they occur much closer together. Thus, the falling F0 is made clearer on the penult as opposed to the shorter F0 change in the ultima. This suggests that the falling F0 in the penult is an important property of the word-level prosody, whereas the falling F0 in the long vowels of final syllables is not.
Turning to the antepenultimate syllable, the long and short vowels differ again in their F0 contours: the F0 is rising (by 15 Hz) in the long vowels, while it is high-flat in the short, with both length categories reaching the same F0 height at the end of the antepenultimate syllable (Q4). Similar to the final syllable, we do not take this as evidence for a LH pitch-accent of the antepenult, but as evidence of high F0 expressed differently due to the timing differences between the long and short vowels. Again, we see that the long and short vowels have different contours, that the F0 change is very small, and that the min and max F0 are close together, all of which suggests that the F0 change in antepenults is not as important for word-level prosody as the falling F0 in penults.
Overall, the patterns indicate a special status and origin of F0 in penults. Specifically, we interpret these results as a HL pitch-accent on the penultimate syllable that is phonologically specified at the word level. This interpretation aligns with Mühlbauer’s (Reference Mühlbauer and Wolfart2006) analysis of prominence patterns in nominals.
This leaves us with having to explain the H (high) F0 on the antepenultimate and L (low) F0 on the final. It is not immediately clear if these are due to an assimilation effect from the penultimate syllable, as shown in (9), or due to phrasal boundaries at the edges of words, as shown in (10), given that these are individual words and their boundaries overlap with higher prosodic boundaries, notably the phonological phrase (PhP) and intonational phrase (IP). The explanation in (9) seems more promising than the one in (10) if we focus on the left edge of words: a word- or phrase-initial H boundary does not readily predict the rising F0 of long vowels – such rises begin in low F0.Footnote 7 On the other hand, a phrasal boundary interpretation for the L on the right edge of many words seems plausible and receives independent support from the lengthening observed in the last syllable of words.Footnote 8 We therefore tentatively conclude that a credible account lies between (9) and (10): the first tone of the HL pitch-accent spreads to the antepenult, and the ultima is targeted by a L phrasal boundary tone.
(9) Possible tonal spreading from penultimate HL to the preceding and following syllables

(10) Possible boundary effects on the antepenultimate and final syllables

A follow-up question that must be addressed is whether the tonal spreading and phrasal boundary tone target syllables or moras. There is no evidence that moras play a role in the placement of the pitch-accent, as the penult carries the pitch-accent no matter the length of vowels in preceding or following syllables in the word (Wolfart Reference Wolfart and Goddard1996; Rosen Reference Rosen2006, Reference Rosen2007; Flynn Reference Flynn2008; Okimāsis & Wolvengrey Reference Okimāsis and Wolvengrey2008; Wolvengrey Reference Wolvengrey2011, among others). Nonetheless, vowel length affects F0 patterns in these surrounding syllables in ways that suggest a role for moraic structure. Notably, it appears that the H tone of the penult spreads exactly one mora to the left, such that only the second mora of (bimoraic) long vowels is H, as shown in (11a). When the antepenultimate vowel is short, it is level-high, as H-spreading targets its single mora, as shown in (11b). A parallel moraic case can be made for final syllables: the boundary L only targets the second mora of a final long vowel, as shown in (11a). When the final vowel is short, it is level-low, as the final boundary L targets its only mora, as shown in (11b).
(11) Possible H spreading and L boundary marking

Moraic structure serves to model several F0 patterns here. The F0 rise in an antepenult with a long vowel is a mere 14 Hz, and likewise, the F0 fall in an ultima with a long vowel is just 13 Hz. Such small movements may reflect the fact that only the second mora is tonally specified (H or L) in these long vowels, their first mora being left tonally unspecified, as shown in (11a). By contrast, there is a 40 Hz change in a penult with a long vowel, which may reflect the fact that the vowel’s moras are specified with opposite tonal features, as also shown in (11a). Crucially, the same dramatic movement is expected in a penult with a short vowel, because a single mora is specified with two opposing tonal features in this case, as shown in (11b). That is, no significant difference in F0 is expected between long and short vowels in penultimate syllables, which carry a HL pitch-accent, on the longstanding autosegmental-theoretic assumption that this bitonal sequence surfaces the same whether H and L are linked to two moras in a long vowel or to a single mora in a short vowel.
To summarize, we found a falling F0 contour on the penultimate syllable that is not affected by the length of the vowel. It is preceded by a high F0 on the antepenult, which has a rising contour for the long vowels, and a low F0 on the final, which has a falling contour for the long vowels. These F0 patterns are combined with lengthening on the last two syllables of the word. Together, these findings do not point to a word stress prosody, but potentially to a word-level pitch-accent system. Although Mühlbauer (Reference Mühlbauer and Wolfart2006: 232) also described the pitch pattern of the penult as an “accent” (his scare quotes), he denies that Plains Cree is a pitch-accent system, let alone that it employs a specific pitch-accent like HL; for him, the language must remain unclassified as it does not fit any of the typical categories: stress, pitch-accent, or tone languages. If this is a word-level pitch-accent system, we would expect that phrasal-level prosody (intonation) would not change the pitch-accent on the penult, while the antepenult and final F0 patterns, which might be due to phrasal boundaries, could be altered depending on the boundary. So far, however, we have only studied individual words where the word boundaries co-occur with phrasal boundaries, so we do not know which of these properties reflect word-level prosody versus phrasal-level prosody. To investigate this, we next examine the prosody of words within phrases.
4. The investigation of word-level prosody in phrases
There is a growing call that word-level prominence be separated from phrase-level prominence in stress studies (Sluijter & van Heuven Reference Sluijter and van Heuven1996; Gordon Reference Gordon and van der Hulst2014; van Heuven Reference van Heuven, Goedemans, Heinz and van der Hulst2018; Himmelman Reference Himmelmann2023). In our study, such a separation can inform the question of whether Plains Cree is a (word) stress system or a (word) pitch-accent system. Previous descriptions of the language treat Plains Cree as a stress language (e.g., Bloomfield Reference Bloomfield1930; Wolfart Reference Wolfart and Goddard1996). The only exceptions are Mühlbauer (Reference Mühlbauer and Wolfart2006), who concludes his analysis by stating that Plains Cree cannot be satisfactorily classified as a stress, pitch-accent, or tone language, and Cook (Reference Cook and Cowan1991), who argues for the use of “accent” as opposed to “stress” in describing Plains Cree. We investigated which of the typical measurements of prosody are the main properties of Plains Cree word-level prominence (12). In pitch-accent languages, F0 is the dominant acoustic property of word-level prominence. If some particular F0 properties render a given syllable more prominent, that syllable will be treated as a “pitch-accented” syllable (Gordon Reference Gordon and van der Hulst2014). The line between stress and pitch-accent systems can become blurred, as stress languages also use pitch-accents, but at the phrasal level (intonation or phrase pitch-accents), often encoding information structure (e.g. focus). (See also Hyman (Reference Hyman2006, Reference Hyman2009) for a discussion on pitch-accent languages and the category in prosodic typology.) In most cases, intonation pitch-accents are only produced on syllables that are stressed at the word level (van der Hulst & Smith Reference van der Hulst and Smith1988). In contrast, a pitch-accent language manifests word-level prominence through a predictable F0 contour that is not altered by intonation or by a word being in focus (van der Hulst Reference van der Hulst2012). Thus, if Plains Cree is a stress language, the falling F0 on the penultimate syllable observed in individual words will not be the same in words with different prosodic structures (Hypothesis C). However, if Plains Cree is a pitch-accent language, the penult will exhibit a falling F0 pattern no matter what the phrasal-level prosody is (Hypothesis D).
(12) Hypotheses tested and predictions about Plains Cree word-prosodic system.
-
Hypothesis C: Plains Cree is a stress language.
-
Prediction: The prominent syllable is longer, higher pitched, louder, or has more peripheral vowel qualities, or a combination of these properties.
-
Hypothesis D: Plains Cree is a pitch-accent language.
-
Prediction: The prominent syllable exhibits a HL pitch movement.
4.1 Data and acoustic analysis
From the same recordings described in section 3.1, we used Praat to segment target vowels in two-word phrases. We included the three most common types of phrases in the corpus, shown in (13–15). The first word had at least three syllables and the second was always disyllabic, as this was the most common combination found in the data.
(13) Verb phrase: Verb + Noun/Pronoun (object)

(14) Postpositional phrase: Noun + Postposition

(15) Adverbial phrase: Noun or Verb + Adverb ‘evidently’

In Cree literature, these phrases are often called “close-knit phrases” (Bloomfield Reference Bloomfield1930), presumably because the two words are closely linked, but no clear definition is given about the status of these phrases as opposed to non-close-knit phrases, in either their phonological grouping or syntactic status. As we discussed in section 2.2, previous descriptions have stated that “close-knit phrases” are assigned stress as if they were a single word, with primary stress falling on the antepenult of the “close-knit phrase” (Bloomfield Reference Bloomfield1930; Wolfart Reference Wolfart and Goddard1996). As Edwards (Reference Edwards1954) describes: “A two-syllable word tends to shift the stress of the preceding word to the last syllable. In this case, no stress falls on the two syllable word” (p. 5.3). See (4) above for examples.
In contrast, Mühlbauer (Reference Mühlbauer and Wolfart2006) argues that “close-knit phrases” display two pitch falls (↘) with an interpolating rising pitch (↗︎) between the two falls, a rise that he says parallels the rise on the antepenultimate syllable, e.g. (16).Footnote 9 He stresses that “close-knit phrases” should not be treated as a special unit in the grammar, as the prominent syllable positions in the words remain unchanged, viz. penultimate.
(16) Example from Mühlbauer (Reference Mühlbauer and Wolfart2006: 257) of close-knit phrase pitch patterns

Table 3 presents some examples of the words analyzed. Similar to individual word data, words having undergone vowel deletion or coalescence were not used, nor words with vowels adjacent to glides or /h/ for which a boundary could not be found. Glides were always included in the segmentation of the final vowel if the glide was in syllable coda position (16 cases).Footnote 10 Both open and closed syllables were included, as well as phrases produced in isolation or at different positions in the utterance. We only analyzed the data of the first word, as they are relevant for our hypotheses, but we will discuss patterns in the second word when relevant.
Examples of stimuli from words in phrases for vowel /aː/ (target is bolded)

In total, 479 vowels were included in the analysis. Table 4 summarizes the number of items in each category. Each target was labeled for length, quality, and syllable position.
Number of vowels from words in phrases included in the analysis in each vowel category and syllable position

4.2 Statistical analysis
The statistical analysis of these data was the same as the analysis for the individual words. That is, we ran a MANOVA in SPSS (IBM Corp 2019) with Syllable Position (final, penult, antepenult) and Length (long and short vowels) as the independent variables, and duration (ms), average intensity (dB), average F0 (Hz), F0 contour (Hz), and vowel centralization (distance from vowel center) as the dependent variables.
4.3 Results
There was a significant main effect of Syllable (Wilks’ $\lambda$
=.296, F(12, 926)=64.6, p<.001, partial-
$\lambda$
=.296, F(12, 926)=64.6, p<.001, partial- $\eta$
2
=.425) and Length (Wilks’
$\eta$
2
=.425) and Length (Wilks’ $\lambda$
=.520, F(6, 463)=71.3, p<.001, partial-
$\lambda$
=.520, F(6, 463)=71.3, p<.001, partial- $\eta$
2
=.480). There was also a significant interaction between Syllable and Length (Wilks’
$\eta$
2
=.480). There was also a significant interaction between Syllable and Length (Wilks’ $\lambda$
=.757, F(12, 926)=11.5, p<.001, partial-
$\lambda$
=.757, F(12, 926)=11.5, p<.001, partial- $\eta$
2
=.135).
$\eta$
2
=.135).
Each significant MANOVA effect and interaction was followed up with an ANOVA. We ran posthoc tests with Bonferroni correction for multiple comparisons when relevant to further explore the role of each dependent variable found to be significant in the ANOVAs. Each measurement is discussed separately below.
4.3.1 Duration
For duration (Figure 10), we found a significant main effect of Syllable (F(2, 468)=31.4, p<.001, partial- $\eta$
2
=.118) and Length (F(1, 468)=410.4, p<.001, partial-
$\eta$
2
=.118) and Length (F(1, 468)=410.4, p<.001, partial- $\eta$
2
=.467), and a significant interaction between Syllable and Length (F(2, 468)=11.2, p<.001, partial-
$\eta$
2
=.467), and a significant interaction between Syllable and Length (F(2, 468)=11.2, p<.001, partial- $\eta$
2
=.046). These results indicate that the length categories and syllable positions differ in duration, but these differences are not the same across all the groups.
$\eta$
2
=.046). These results indicate that the length categories and syllable positions differ in duration, but these differences are not the same across all the groups.
Duration in milliseconds for each vowel length and syllable category in the first word of a phrase. The error bars represent the standard error of the mean.

The short vowels were 37–55% shorter than the long vowels. This difference was statistically significant for vowels in antepenult (p<.001), penult (p<.001), and final (p<.001). Also, the three syllables differed in duration for both length categories. For the short vowels, the antepenult was 15 ms shorter than the penult (p=.014) and 32 ms shorter than the final (p<.001). The final was also longer (by 17 ms) than the penult (p=.001). For the long vowels, the antepenult was also shorter than both the penult (by 44 ms, p<.001) and final (by 23 ms, p=.001), but in contrast to the short vowels, the final was shorter than the penult (by 21 ms, p<.001).
Overall, we found that the distinction between the short and long vowel categories is expressed with duration, with the short vowels being half the length of the long vowels. We also found that vowel duration is increased towards the end of the word, but which syllable is the longest depends on the length category. When the vowels are short, the final vowel is the longest; when the vowels are long, the penult is the longest.
In individual words, we found a similar pattern in duration (section 3.4.1): The duration of the vowels gets longer toward the end of the word, but the relation between the last two syllables differs depending on the length of the vowel.
4.3.2 Vowel centralization
For vowel centralization (Figure 11), we found a significant main effect of Syllable (F(2, 468)=3.8, p=.024, partial- $\eta$
2
=.016). The main effect of Length (F(1, 468)=.524, p=.470, partial-
$\eta$
2
=.016). The main effect of Length (F(1, 468)=.524, p=.470, partial- $\eta$
2
=.001) and the interaction between Syllable and Length F(2, 468)=2.34, p=.097, partial-
$\eta$
2
=.001) and the interaction between Syllable and Length F(2, 468)=2.34, p=.097, partial- $\eta$
2
=.010) were not statistically significant. These results indicate that the syllables differ from each other in vowel centralization and this difference is the same for both length categories, which do not differ in vowel centralization. The vowels in antepenult (M=0.312) were less centralized than in penult (M=0.273, p=.007). The final vowels (M=0.298) did not statistically differ from the other two syllables (p>.10), but numerically, they were more centralized than the antepenultimate and less centralized than the penultimate vowels.Footnote 11
$\eta$
2
=.010) were not statistically significant. These results indicate that the syllables differ from each other in vowel centralization and this difference is the same for both length categories, which do not differ in vowel centralization. The vowels in antepenult (M=0.312) were less centralized than in penult (M=0.273, p=.007). The final vowels (M=0.298) did not statistically differ from the other two syllables (p>.10), but numerically, they were more centralized than the antepenultimate and less centralized than the penultimate vowels.Footnote 11
Vowel space by vowel length (V = short, V: = long) and syllable (ant = antepenult, pen = penult, fin = final). Dashed lines indicate the vowel space of the long vowels. Solid lines indicate the vowel space of the short vowels.

Recall that the results for the individual words (section 3.4.2) were very different than what we found here. In individual words, vowel centralization did not differ by syllable position, but the long vowels were less centralized than the short vowels. These results may reflect individual vowel qualities, a possibility that should be explored in a future study with more controlled stimuli.
4.3.3 Intensity
For intensity (Figure 12), we found a significant main effect of Syllable (F(2, 468)=7.5, p=.001, partial- $\eta$
2
=.031) and Length (F(1, 468)=6.67, p=.01, partial-
$\eta$
2
=.031) and Length (F(1, 468)=6.67, p=.01, partial- $\eta$
2
=.014). The interaction between Syllable and Length (F(2, 468)=.556, p=.574, partial-
$\eta$
2
=.014). The interaction between Syllable and Length (F(2, 468)=.556, p=.574, partial- $\eta$
2
=.002) was not statistically significant. The intensity values across the categories ranged between 75.99 and 77.91 dB. We found the same range of values for the individual words (section 3.4.3). The long vowels were 0.9 dB louder than the short vowels (p=.001) and the final syllable was 1.38 dB quieter than the penult (p<.001) and 0.8 dB quieter than the antepenult (p<.027), but the penult and antepenult were not statistically different in intensity (p=.258).
$\eta$
2
=.002) was not statistically significant. The intensity values across the categories ranged between 75.99 and 77.91 dB. We found the same range of values for the individual words (section 3.4.3). The long vowels were 0.9 dB louder than the short vowels (p=.001) and the final syllable was 1.38 dB quieter than the penult (p<.001) and 0.8 dB quieter than the antepenult (p<.027), but the penult and antepenult were not statistically different in intensity (p=.258).
Intensity in dB for each vowel length and syllable category in the first word of a phrase. The error bars represent the standard error of the mean.

Overall, we found the same pattern we observed in individual words. That is, long vowels are a bit louder than short ones, and both are loudest in the antepenultimate and penultimate syllables in comparison to final syllables.
4.3.4 Average F0
For F0 (Figure 13), we found a significant main effect of Syllable (F(2, 468)=42.9, p<.001, partial- $\eta$
2
=.155). The main effect of Length (F(1, 468)=1.48, p=.225, partial-
$\eta$
2
=.155). The main effect of Length (F(1, 468)=1.48, p=.225, partial- $\eta$
2
=.003) and the interaction between Syllable and Length (F(2, 468)=.070, p=.932, partial-
$\eta$
2
=.003) and the interaction between Syllable and Length (F(2, 468)=.070, p=.932, partial- $\eta$
2
<.001) were not statistically significant. This means that the short and long vowels’ F0 patterns are similar, but the syllables differ in F0. The antepenult was 12 Hz higher in F0 than the penult (p<.001) and 24 Hz higher than the final (p<.001); the penult was 12 Hz higher than the final (p<.001).
$\eta$
2
<.001) were not statistically significant. This means that the short and long vowels’ F0 patterns are similar, but the syllables differ in F0. The antepenult was 12 Hz higher in F0 than the penult (p<.001) and 24 Hz higher than the final (p<.001); the penult was 12 Hz higher than the final (p<.001).
Average F0 in Hz for each vowel length and syllable category in the first word of a phrase. The error bars represent the standard error of the mean.

Overall, we found that for both short and long vowels, the average F0 starts high on the left of the word and gets reduced gradually towards the end. The antepenult has the highest F0, while the final the lowest. Recall that similar F0 results were found for the individual words (section 3.4.4): The F0 of individual words gets lower towards the end of the word, and this is the same for both vowel length categories.
4.3.5 F0 contours
For ΔF0 (Figure 14), we found a significant main effect of Syllable (F(2, 468)=259.6, p<.001, partial- $\eta$
2
=.526) and a significant interaction between Syllable and Length (F(2, 468)=54.3, p<.001, partial-
$\eta$
2
=.526) and a significant interaction between Syllable and Length (F(2, 468)=54.3, p<.001, partial- $\eta$
2
=.188). The main effect of Length (F(1, 468)=.117, p=.732, partial-
$\eta$
2
=.188). The main effect of Length (F(1, 468)=.117, p=.732, partial- $\eta$
2
<.001) was not statistically significant. These results indicate that the F0 contour differs between the syllables, and these differences are not the same for both length categories.
$\eta$
2
<.001) was not statistically significant. These results indicate that the F0 contour differs between the syllables, and these differences are not the same for both length categories.
F0 in Hz at the beginning (Q1 = first vowel quarter) and end of a vowel (Q4 = last vowel quarter) for each vowel length and syllable category in the first word of a phrase. The error bars represent the standard error of the mean.

In the penult, F0 had a falling contour in both length categories, but there was a larger fall for the long vowels (M=36 Hz) than for the short ones (M=18 Hz, p<.001). The antepenult had a rising contour for the long vowels (the F0 increase is 21 Hz), but the contour of short vowels was high-flat (p<.001). The penult and antepenult contours differed statistically from each other for the short (p=.001) and long vowels (p<.001). The final syllable F0 contour was also rising, but for both length categories, which did not statistically differ from each other (p=.807), with an average 11 Hz F0 increase for both. The final syllable contours were different from the penult (p<.001), which had a falling shape, and from the antepenult (short: p<.001, long: p=.019), which were also rising (for the long vowels) or flat (for the short vowels).
Turning to the max and min F0 timing (Figure 15): In the falling F0 contour of the penultimate syllable, max F0 occurs very early in the vowel (11% of the vowel duration for the short and 4% for the long vowels) and min F0 occurs very late in the vowel (92% of the vowel duration for the short and 95% for the long vowels). By contrast, in the other syllables, the min and max F0 occur in Q2 and Q3. That is, in antepenultimate syllables with short vowels, which have flat F0 contour, max F0 occurs at the end of Q2 (49% of the vowel duration) and min F0 at the beginning of Q3 (57% of the vowel duration). For the long vowels in antepenultimate syllables, which have a rising F0 contour, max F0 occurs at the beginning of Q4 (79% of the vowel duration) and min F0 occurs at the end of Q1 (21% of the vowel duration). In the final syllable (rising F0 contour), max F0 occurs in Q4 (77% of the vowel duration for the short and 78% for the long vowels) and min F0 occurs in Q2 (31% of the vowel duration for the short and 29% for the long vowels).
Average percentage of vowel duration that max and min F0 of the vowel occurs for each vowel length and syllable category in the first word of a phrase. The arrows show the direction of the F0. Q1 to Q4 mark each vowel quarter. The error bars represent the standard error of the mean.

Overall, we found a falling F0 contour on the penultimate syllable that spans across the whole vowel duration, and it is preceded by high (short vowels) or rising F0 (long vowels) and followed by rising F0. Recall that for the individual words (section 3.4.5), we also found a rising F0 (long vowels) or flat high F0 (short vowels) on the antepenult and a falling F0 for the penult, but the F0 contours of the final syllable are not the same as in the words in phrases. In individual words, the final syllable has a falling F0 (long vowels) or flat low F0 (short vowels), but in the words in phrases, we found a rising F0 contour for both vowel length categories (but see discussion below in Figure 16).
4.4 Discussion
In order to clarify the word-level prosodic system of Plains Cree, we analyzed data from the first word in two-word phrases. As in our investigation of individual words, we measured the four typical acoustic properties of prosody on each of the last three syllables of words with three or more syllables. The results show that the falling F0 of the penultimate syllable observed in individual words is also found in the words within phrases. The duration patterns are also the same between the two sets of data. These results support Hypothesis D that Plains Cree is a pitch-accent language, which is compatible with Mühlbauer’s (Reference Mühlbauer and Wolfart2006) claim that Plains Cree has a pitch-accent on the penult (although he argues that Plains Cree cannot be classified in any of the word-prosodic typology categories). Hypothesis C that Plains Cree is a stress language is not supported by the results as we do not find an enhancement of the acoustic properties of prosody across the board.
In individual words, we found a characteristic falling F0 pattern in the penult that occupied the whole vowel and was not altered by the length category of the vowel. We find the same in words that are in phrases. The penult has a falling F0 pattern independent of the vowel length category that occupies the length of the whole vowel. The two sets of data differ, however, in the F0 pattern of their final syllable. In individual words, we found a low F0 that was either flat (short vowels) or falling (long vowels), while in words that are in a phrase, the F0 of the final syllable is rising for both vowel length categories. In both cases, the F0 contour occupied the middle vowel quarters, as in the case of the antepenult. So we see that the penult falling F0 is not affected by the prosodic boundary on the right of the word, nor by the vowel length category. This supports the hypothesis that there is a HL word-level pitch-accent on the penult, which is unaffected by the vowel length or prosodic phrasing.
In contrast to the penult, the F0 of the final syllable changes depending on the prosodic boundary on the right. In the case of individual words, when a word is at the end of a phrase or sentence, and there is a phonological phrase (PhP) boundary or an intonational phrase (IP) boundary, the final syllable has low (falling) F0. A falling F0 has also been described by Cook (Reference Cook and Christoph Wolfart2006) and Wolvengrey (Reference Wolvengrey2011) at the end of statements, wh-questions, and yes-no questions with the cî question particle. Thus we can safely interpret this low F0 as a L boundary tone on the right edge of the IP. However, we cannot at present exclude the possibility that the PhP carries a final L boundary tone, too. Other languages in which the PhP is marked with a final L boundary tone include Māori (de Lacy Reference de Lacy, Coetzee, Carpenter and de Lacy2003), Bininj Gun-wok (esp. the Kuninjku dialect; Bishop & Fletcher Reference Bishop, Fletcher and Jun2005), Somali (esp. nominal phrases; Le Gac Reference Le Gac, Klessa, Bachan, Wagner, Karpiński and Śledziński2018), and Basque (esp. Northern Bizkaian, e.g., Lekeitio; Elordieta & Egurtzegi Reference Elordieta and Egurtzegi2022; Egurtzegi & Elordieta Reference Egurtzegi and Elordieta2023: 42, 64).
(17) Boundary L tone on the right edge of a PhP or IP

Contrary to individual words, when a word is non-final within a phrase, the prosodic boundary at the end of the word is a Phonological Word (PW) — not PhP or IP. In this case, the final syllable has a rising F0. As shown in (18), Mühlbauer (Reference Mühlbauer and Wolfart2006) explains this rise as phonetic interpolation (↗︎) between the low end point of the pitch fall on the penult of the first word and the high beginning point of the pitch fall on the first syllable (also penult) of the second word in the same phrase.Footnote 12 In our terms, there is usually a boundary L at the right edge of a PhP and/or IP (see above), but there is no regular boundary L at the right of PWs; there is only a regular HL pitch accent on the penult of PWs. When a PW is followed by a PW in the same PhP, there is phonetic interpolation between their pitch accents.
(18) Mühlbauer’s (Reference Mühlbauer and Wolfart2006) analysis of the final rising F0 in the first word in “close-knit” phrases

As shown in (19), when the two words are not within the same “close-knit” phrase, Mühlbauer (Reference Mühlbauer and Wolfart2006) describes the absence of a rising F0 on the final syllable of the first word: “there is no rising pitch to interpolate with the adverbial’s fall, and the two forms thus do not have external sandhi. The adverbial êkwa ‘and/then’ is then interpreted as modifying the second clause, which it is in external sandhi with …, rather than the first; ‘they catch fish [then dry them]’ rather than ‘[they catch fish then] dry them’” (p. 257).Footnote 13 We understand this more broadly as follows: There is no phonetic rising interpolation between pitch accents (cf. above) when two PWs are separated by a PhP or IP boundary, precisely because the latter may introduce a boundary L (again, see above).
(19) Mühlbauer’s (Reference Mühlbauer and Wolfart2006: 257) analysis of the final F0 in the first word of two-word sequences that do not form a “close-knit” phrase (see our footnote 11)

Within phrases, we only analyzed polysyllabic words that are the first word of a two-word phrase. In order to evaluate Mühlbauer’s (Reference Mühlbauer and Wolfart2006) claims about the F0 in “close-knit” phrases, we measured the F0 of the second (disyllabic) word in our phrases.Footnote 14 As Figure 16 shows, the disyllabic word exhibits the falling F0 contour on its penult, like the first polysyllabic word. Earlier descriptions of the disyllabic words within a phrase said that the disyllabic word participates in the stress assignment of its preceding word by shifting the stress on the antepenult of the phrase (Bloomfield Reference Bloomfield1930; Wolfart Reference Wolfart and Goddard1996). We do not find evidence for this claim, though perhaps the rising F0 at the end of the word preceding the disyllabic word is what was described as stress in these earlier descriptions. Rather, we see that the disyllabic word has its own HL pitch-accent, which does not affect the pitch-accent of the preceding word. This is similar to Mühlbauer’s (Reference Mühlbauer and Wolfart2006) description (discussed above) that both words in a phrase get a falling F0 on their penult. However, we still do not know what happens when the second word is not part of the same phrase as the first word, as we only looked at words belonging to the same phrase, and Mühlbauer’s (Reference Mühlbauer and Wolfart2006) own examples are lacking the necessary data, as discussed in our footnote 12.
F0 in Hz at the beginning (Q1 = first vowel quarter) and end of a vowel (Q4 = last vowel quarter) for each vowel length (V = short vowels; V: = long vowels) and syllable category in the first polysyllabic word and in the second disyllabic word in phrases. The error bars represent the standard error of the mean. The data for Word 1 are repeated from Figure 14.

According to Mühlbauer (Reference Mühlbauer and Wolfart2006: 232–233, 251–254), the rising F0 of the final syllable in the first word is parallel to the high (rising) F0 on the antepenult. Before we consider Mühlbauer’s proposal, we discuss our results for the antepenult. We found that the antepenult F0 patterns were very similar between individual words and words in phrases. In both, the F0 is high with a flat contour for the short vowels and a rising contour for the long vowels. This is not surprising, since the left prosodic boundary does not change between the two structures. We tested the first word in phrases and individual words, so the boundary in both is most likely an intonational phrase. Therefore it is not clear from the current data if the high (rising) F0 we find in this position is due to the prosody of the word (as diagrammed in (9)) or due to the left PhP or IP boundary (as diagrammed in (10)).
Our data included words of different lengths, which allows us to separate an antepenultimate syllable that is the first syllable of the word from an antepenultimate syllable that is word-medial (i.e., preceded by other syllables).Footnote 15 This separation can potentially allow us to see the effect of the left PhP or IP boundary at the beginning of the word. Specifically, if there is a F0 difference between the initial and the non-initial antepenults, we can see how the PhP or IP boundary affects the antepenult F0 and which F0 pattern is due to the boundary. We cannot draw very strong conclusions from this comparison, however, since there are few vowels in each category (short initial = 30; short non-initial = 129; long initial = 31; long non-initial = 94). Moreover, in addition to the difference in whether these vowels are word-initial or not, there is also a difference in number of syllables in the word: initial antepenults are from trisyllabic words, while non-initial antepenults are from quadrisyllabic or longer words. Keeping these caveats in mind, there is little difference in the F0 patterns between initial and non-initial antepenultimate syllables, as shown in Figure 17: the short vowels word are 15 Hz lower initially than non-initiallyFootnote 16 and the long vowels rise 5 Hz more when word-initial than when non-initial.Footnote 17
F0 in Hz at the beginning (Q1 = first vowel quarter) and end of a vowel (Q4 = last vowel quarter) in the antepenultimate syllable or a syllable preceding the antepenult (before antepenult) when it is at the beginning of the word (Word Initial) and when it is preceded by at least another syllable (Non-Initial), for short and long vowels separately. The error bars represent the standard error of the mean. The figure combines the data from individual words and word 1 in phrases.

To explore the possible effect of the left PhP or IP boundary further, we also segmented some of the vowels in syllables preceding the antepenult (322 vowels in total), to compare the patterns we find in the antepenult to the patterns we find in these syllables. The idea is similar to the comparisons for the antepenult: if there is a difference between the initial and non-initial syllables preceding the antepenult, we can see which effects are due to the PhP or IP boundary. Moreover, we would expect to see the same effect from the PhP or IP boundary to the antepenult and to the syllables preceding the antepenult. Again, the data are based on few items (short initial = 72; short non-initial = 109; long initial = 57; long non-initial = 84), so caution is needed in our interpretation of these data as well. Similar to the antepenult, the F0 patterns of these syllables change very little by their position relative to the beginning of the word: the short vowels are 2 Hz lower word-initially than non-initiallyFootnote 18 and the long vowels are 8 Hz lower word-initially than non-initially.Footnote 19
Overall, the left PhP or IP boundary does not seem to much affect the F0 of antepenultimate or more initial syllables. The biggest effect is on the short antepenult, which is lower word initially than non-initially. This was also true for the short and long more initial syllables, although the change was very small. The long antepenult showed the opposite effect with the non-initial vowels having a lower F0 than the initial ones. However, we can observe a difference in the F0 of the antepenult in comparison to more initial syllables. First, for the short vowels, the antepenult is 11 Hz higher in F0 than the more initial syllables when word-initial, and 24 Hz when non-initial.Footnote 20 For the long vowels, the antepenult is not only higher (by 27 Hz word-initially and 14 Hz non-initially) than the more initial syllables,Footnote 21 but it also has a different F0 contour: the antepenult is rising while the more initial syllables are flat. Overall, we see that the words start with low F0, and F0 gets high on the antepenult, or rising if the antepenultimate vowel is long. None of the syllables tested here exhibit a rising contour except from the long antepenult.
There are two main findings here: (a) the antepenultimate syllables have higher F0 and in some cases rising contours in comparison to more initial syllables, and (b) word-initial syllables have slightly lower F0 than non-initial syllables, with the exception of the long antepenult. These findings show that there is no H tone marking the left edge of the PhP or IP (as diagrammed in (10) above). We therefore interpret the antepenultimate high F0 as a result of the H tone of the penult pitch-accent affecting the F0 of the antepenult. One possibility is that this effect from the pitch-accent represents a phonological spreading of the H tone to the previous syllable or mora (as diagrammed in (9) and (11) above). The other possibility is that it is a phonetic effect of the anticipation of the high pitch in the penult at the beginning of the antepenult, which is what Mühlbauer (Reference Mühlbauer and Wolfart2006: 232–233, 251–258) suggested for both the antepenultimate and final syllable of the first word in phrases (as shown in his example (16) above).
To evaluate Mühlbauer’s (Reference Mühlbauer and Wolfart2006) suggestion, let us first consider whether the two syllable positions (antepenult and final) are similar in F0. Our data indicate that the two syllables do not have the same F0 patterns and so we do not find evidence to support Mühlbauer (Reference Mühlbauer and Wolfart2006). Specifically, the high F0 on the antepenult has a rising contour only for the long vowels, while the short vowels are flat, in contrast to the final syllable, where both vowel length categories have a rising contour. So we cannot treat the F0 on the antepenult as the result of the same effect as that of the final syllable of the first word in the phrases. We do agree with Mühlbauer, however, in that we do not think that this final rising F0 within a phrase indicates any special constituency for these “close-knit” structures (an interpretation close to Bloomfield (Reference Bloomfield1930)), but rather, it is the result of differences in the phonological domains or groupings of these words. When the disyllabic word is grouped with the preceding word (as in our phrasal data), there is no phrasal (PhP or IP) boundary between them and a rising F0 is seen (20a), which is perhaps phonetic interpolation within a phrase (Mühlbauer Reference Mühlbauer and Wolfart2006). By contrast, when the two words belong to different phrases, then there is a phrasal boundary between them, and a low F0 is observed, which is the PhP or IP boundary tone, (20b).Footnote 22
(20) Pitch in tautophrasal versus heterophrasal words

We also need to explain the small lowering effect on F0 word initially in comparison to non-initial syllables. We interpret this as a result of the natural production of speech, not as a L(ow) PhP or IP boundary tone on the left, especially given the small difference in F0 between initial and non-initial syllables. The F0 is not at its highest point at the beginning of a sentence (IP domain), unless there is a H boundary tone. In our data, we see a medium-range F0 in syllables before the antepenult, indicating that these pre-antepenultimate syllables do not carry a tone.
5. General discussion
5.1 The location of word-level prominence in Plains Cree
The present study explored the acoustic properties related to prosody (duration, F0, intensity, and vowel centralization) of the last three syllables in polysyllabic words of Plains Cree to investigate the contradictory claims about the location of stress. We initially looked at individual words and then at words that are at the beginning of a two-word phrase – what is called a “close-knit” phrase in the literature. Our interpretation in both sets of data is that we see word-level as well as phrasal-level prosodic effects pointing to the existence of a pitch-accent system as opposed to a stress language (see also Cook Reference Cook and Cowan1991). In terms of acoustic properties, we found F0 to be the main property. Figure 18 shows the F0 data from all the contexts we looked at in the present study.
F0 in Hz at the beginning (Q1 = first vowel quarter) and end of a vowel (Q4 = last vowel quarter) for each vowel length (V = short vowels; V: = long vowels) and syllable category in individual words, first and second words in phrases. The error bars represent the standard error of the mean. The data for Individual Words (Individual) are repeated from Figure 8, the data for Phrases are repeated from Figure 16, and the data for syllables before the antepenult (before antep), including word initial and non-initial syllables, are repeated from Figure 17.

Starting with the end of the words, the final syllable has either a low F0 (in individual words), or a rising F0 (in phrases). In other words, when the words align with the end of a sentence (individual words), we see the typical low F0 or L boundary tone found in many languages at the end of a sentence (Ladd Reference Ladd2008) or intonational phrase (IP). It is also possible for the phonological phrase (PhP) to carry a final L boundary tone (see, e.g., de Lacy Reference de Lacy, Coetzee, Carpenter and de Lacy2003; Bishop & Fletcher Reference Bishop, Fletcher and Jun2005; Le Gac Reference Le Gac, Klessa, Bachan, Wagner, Karpiński and Śledziński2018; Elordieta & Egurtzegi Reference Elordieta and Egurtzegi2022; Egurtzegi & Elordieta Reference Egurtzegi and Elordieta2023: 42, 64, etc.). To explore this possibility, we would need to investigate final syllables in a larger set of word sequences that are separated by IP boundaries versus PhP (but not IP) boundaries. When the words are within a phrase and align with the end of a Phonological Word (PW) boundary, we find a rising F0, which we may interpret as phonetic interpolation within a Phonological Phrase (PhP) between the two HL pitch-accents (cf. Mühlbauer Reference Mühlbauer and Wolfart2006). To verify this interpretation, and to better understand how phrasal boundaries disrupt such interpolation, we need to investigate what happens when a word-final syllable is followed by a syllable without a pitch-accent, i.e., when the following word is longer than two syllables.
On the antepenultimate syllable, we found a high F0 for the short and rising F0 for the long vowels in both individual words and words in phrases. This is the syllable that is most commonly cited as the stress position of Plains Cree (Bloomfield Reference Bloomfield1930; Edwards Reference Edwards1954; Pentland Reference Pentland1979; Cook Reference Cook and Cowan1991; Wolfart Reference Wolfart and Goddard1996; Russell & Reinholtz Reference Russell, Reinholtz, Agbayani and Tang1997; Russell Reference Russell, Alan Hall and Kleinhenz1999; Rosen Reference Rosen2006, Reference Rosen2007; Okimāsis & Wolvengrey Reference Okimāsis and Wolvengrey2008; Wolvengrey Reference Wolvengrey2011; Shwayder Reference Shwayder2015; McLeod & Wolvengrey Reference McLeod and Wolvengrey2016; Buckley Reference Buckley, Daniel Siddiqi, Gillon, Haugen and Mathieu2020: 74; Bogomolets Reference Bogomolets and van de Weijer2023: 80, fn. 8; Gordon Reference Gordon, Dagostino, Mithun and Rice2023: 149–150; Rice Reference Rice, Bogomolets and van der Hulst2023: 131–132; Zykoski Reference Zykoski2023: 19ff.). As we will discuss below, this high F0 on the antepenult is not an indication of stress, so claims of antepenult stress are not supported by our findings.Footnote 23 But the high F0 on the antepenult is possibly the source of confusion for English speakers as they erroneously perceive it as stress, as Mary Edwards surmised more than 70 years ago:
In words of three syllables stress usually occurs on the second-last syllable if the vowel in that syllable is long. A high tone, sometimes confused with stress by English speakers, then occurs on the third-last syllable if the vowel in the second last is short. (Edwards Reference Edwards1954: 5.3).
In order to understand the nature of the antepenultimate high F0, we separated the antepenultimate syllables that were at the beginning of the word from those that were word medial, preceded by other syllables, and we also compared these with the patterns we see in syllables preceding the antepenult. We found that the syllables before the antepenult have lower F0 in comparison to the antepenult for both vowel lengths. Moreover, no clear pattern was observed regarding differences between word-initial and non-initial F0, but in general the word-initial syllables were slightly lower in F0 than non-initial syllables. This means that the antepenultimate high F0 is unique to this syllable location and not a result of a H boundary tone at the beginning of the domain (word, phrase, etc.), but rather a result of the H tone which is part of the penultimate HL pitch-accent we will discuss below.
As with the rising F0 contour of the final syllable within phrases discussed above, there is a phonological and a phonetic explanation for the high F0 of the antepenult. Specifically, there may be tonal spreading to the left of the pitch-accent, or else phonetic interpolation between the lower F0 at the beginning of the word and the high F0 at the beginning of the penult, the latter explanation being supported by Mühlbauer (Reference Mühlbauer and Wolfart2006). If this is phonetic interpolation, we cannot explain why the short and long vowels have different F0 contours (short = flat, long = rising). Recall that in the case of the final syllable, both vowel length categories have a similar rising contour. Moreover, we cannot explain why this effect occurs only in the antepenultimate syllable and does not affect the F0 of more initial syllables. So the results do not support this phonetic explanation. In the first part of our study, we suggested a phonological explanation instead: the H tone of the penult spreads exactly one mora to the left, such that only the second mora of (bimoraic) long vowels is H, as diagrammed in (11a). When the antepenultimate vowel is short, it may be level-high because H-spreading targets its single mora, as diagrammed in (11b). (We do not ascribe any such phonological H-spreading to the pitch rises in the final syllables of phrase-medial words; cf. (20a).)
Finally, on the penultimate syllable, we find a falling F0 contour in both individual words and words in phrases. This is the syllable which Mühlbauer (Reference Mühlbauer and Wolfart2006) argued “receives a pitch ‘accent’” (p. 232). As already mentioned, he uses scare quotes because he does not consider Plains Cree a pitch-accent language, nor does he ascribe its pitch patterns to phonologically defined pitch accents like HL – he assumes disyllabic trochees instead. The falling F0 on the penult, or the lack thereof, is possibly what Okimāsis (Reference Okimāsis2018) had in mind when reporting that English speakers erroneously stress the penult – perhaps they do not use the correct F0 contour. The contour occupies the whole vowel, the high F0 portion being anchored at the very beginning of the vowel and the low F0 portion being anchored at the very end of the vowel. This potentially maximizes the perceptibility of the F0 contour, indicating its importance. Note that in the other syllables, the F0 contour (flat or changing) only occupies the middle two vowel quarters. The F0 contour does not change by the length category of the vowel, since both long and short vowels exhibit the same falling F0, which is not the case for the F0 pattern of the other syllables. Overall, we take the results of the penultimate syllable as an indication of a HL pitch-accent on the penult.
Given our results for the final syllable and our analysis diagrammed in (11) and (17)/(20), it is perhaps no surprise that the penult and not the final is the syllable that receives the HL pitch-accent. If the final syllable had the bi-tonal pitch-accent, there would be little space for the PhP and/or IP boundary L or H tones due to tonal crowding (Gordon Reference Gordon and van der Hulst2014).
5.2 Disyllabic words and the status of “close-knit” phrases
The present study tested only words with three or more syllables, but as we discussed above, we also considered the second words in our (“close-knit”) phrases, which were disyllabic, to better understand the F0 pattern of the final syllable in the previous word (i.e., a rising F0 contour). So, we can discuss our observations about disyllabic words in phrases and the prosody of “close-knit” phrases (Bloomfield Reference Bloomfield1930).
As with the longer words, the penultimate syllable of the disyllabic words has a sharp falling F0 contour, what we described above as a HL word-level pitch-accent. This shows that disyllabic words do carry pitch-accents, at least when within a phrase, similar to longer words. This does not align with previous descriptions in which stress is assigned to the antepenult of a “close-knit” phrase, that is, to the final syllable of the word preceding the disyllabic word (Bloomfield Reference Bloomfield1930; Edwards Reference Edwards1954; Wolfart Reference Wolfart and Goddard1996). Rather, it is the first syllable of the disyllabic word that is prominent, as described by Russell (Reference Russell, Alan Hall and Kleinhenz1999), and in fact, each word in a phrase has its own prominence, as described by Mühlbauer (Reference Mühlbauer and Wolfart2006). We do not have any data for disyllabic words outside phrases, but the majority of the previous descriptions claim final stress in those cases (Edwards Reference Edwards1954; Longacre Reference Longacre1957; Pentland Reference Pentland1979; Wolfart Reference Wolfart and Goddard1996; Rosen Reference Rosen2006, Reference Rosen2007; Flynn Reference Flynn2008; Okimāsis & Wolvengrey Reference Okimāsis and Wolvengrey2008; Wolvengrey Reference Wolvengrey2011, Reference Wolvengrey, McLeod and Wolvengrey2016; Okimāsis Reference Okimāsis2018; Gordon Reference Gordon, Dagostino, Mithun and Rice2023: 149). It is possible that the disyllabic words have the HL pitch-accent even in isolation, and in combination with final lengthening, it is perceived as a final stress pattern. We cannot, however, exclude the possibility that in isolation these words indeed have final stress. This needs to be tested further to understand the prosodic status of the disyllabic words.
Additionally, we found no evidence that “close-knit” phrases are a special constituent and should be treated differently from other phrases. Phrases like noun + postposition are called “close-knit phrases” in Plains Cree due to a close link between the words in the phrase (Bloomfield Reference Bloomfield1930), but their phonological or syntactic properties are not defined. It is thus unclear what the difference is between a “close-knit” and non-“close-knit” phrase. Our data show that both words in those “close-knit” phrases have a HL pitch-accent (cf. Mühlbauer Reference Mühlbauer and Wolfart2006, who assumes final disyllabic trochees in both words) and there is no indication that one pitch-accent has a different status (e.g., being weaker) than the other. Thus, our data do not support previous claims that “close-knit” phrases are assigned word-level prominence similar to a single word (Bloomfield Reference Bloomfield1930; Edwards Reference Edwards1954; Wolfart Reference Wolfart and Goddard1996) and we agree with Mühlbauer (Reference Mühlbauer and Wolfart2006) that “close-knit” phrases have no special status and should not be treated differently from a regular phrase. In other words, in a phrase, each word is a PW and they form together a single PhP; see (20) above. As already discussed, the fact that the two words belong in the same PhP domain also explains why we have a rising F0 between the two pitch-accents (in final syllable of the first word) and not the low F0 we observe at the end of words when they align with a PhP or IP boundary.
5.3 Secondary stress
Secondary stress was not tested in the present study, but we can briefly discuss it because we looked at different syllable positions in our data. We found that the antepenultimate syllable is higher in F0 than the more initial syllables in both word-initial and medial positions. Thus, there is no F0 evidence that in longer words syllables preceding the antepenult carry any prominence, contrary to previous descriptions (Edwards Reference Edwards1954: 5.3; Wolfart Reference Wolfart and Goddard1996; Okimāsis & Wolvengrey Reference Okimāsis and Wolvengrey2008; Buckley Reference Buckley, Daniel Siddiqi, Gillon, Haugen and Mathieu2020: 74; Gordon Reference Gordon, Dagostino, Mithun and Rice2023: 149–150; Rice Reference Rice, Bogomolets and van der Hulst2023: 132). The final syllable is also claimed to have a secondary stress in trisyllabic and longer words (ibid.). In terms of F0, the final syllable carries the phrasal boundary tone, so there is no F0 evidence of stress on the final syllable either. There is, however, lengthening on the final syllable, which could be taken as evidence of stress, but in practice, both penultimate and final syllables are lengthened, so this cannot be a result of stress. The final lengthening may have contributed to the perception of stress on the final syllable in contrast to the combination of lengthening and falling F0 on the penult. Of course, it is possible that more subtle differences exist and different phonetic properties (e.g., spectral tilt; Sluijter & van Heuven Reference Sluijter and van Heuven1996) need to be measured to properly discuss possible differences between primary and secondary stress in Plains Cree. From the phonetic properties measured in the current study, there is no evidence of secondary stress in any syllable position.
5.4 Is Plains Cree a word-level pitch-accent language?
An interesting question raised by the present study is where Plains Cree fits with respect to prosodic typology. Is it a stress or a pitch-accent system? The high antepenult and falling penult were found in both individual words and words within a phrase, in contrast to the final syllable, which has a low F0 in individual words and a rising F0 in words within phrases. Thus, the penultimate falling F0 is not due to phrasal boundaries and it is not changed by differences in phrasal prosodic structure. We take this as an indication that the word-level prosody in Plains Cree is that of a (word) pitch-accent language, and not of a stress language. Although the category of “pitch-accent languages” is not well defined in prosodic typology (Hyman Reference Hyman2006, Reference Hyman2009), we cannot convincingly argue for a stress system.
If Plains Cree were a stress language, as the previous literature contends, we would expect that the particular F0 contour of the stressed syllable is not an important part of the expression of stress, and that duration and intensity also played a role. In practice, we see no evidence of duration or intensity being enhanced on a given “stressed” syllable. Rather, duration increases towards the end of the word, expressing prosodic phrasing, not prominence. As we discuss below, however, it is not surprising that duration does not play a role, since the language has a contrastive vowel length system (cf. Hungarian; Vogel, Athanasopoulou & Pincus (Reference Vogel, Athanasopoulou, Pincus, Katalin, Surányi and Dékány2015)). Moreover, the falling F0 contour of the penult is maintained and anchored to the penultimate vowels in a way that maximizes the perceptibility of the contour, while it is not affected by the length category of the vowel. This was the case for individual words and words in phrases. Thus we see evidence of the F0 movement on the penult to be an important property of word-level prosody. We also find no support for a stress system in the vowel deletion patterns. In typical stress languages, like Greek and English, stress “protects” the vowel from being deleted (Beckman & Venditti Reference Beckman, Venditti, Hardcastle, Laver and Gibbon2010). In Plains Cree, however, short vowels (particularly /i/) are often deleted, without the syllable position playing any role (Wolfart & Carroll Reference Christoph and Carroll1981; Cook Reference Cook and Cowan1991; Wolfart Reference Wolfart and Goddard1996; Russell Reference Russell2008; Harrigan & Tucker Reference Harrigan and Tucker2015).Footnote 24 For example, we see vowel deletion in all three last syllables of a word in (21). Words here are transcribed with stressed syllables according to their sources, which do not align with our pitch-accentual understanding, but the point remains: word-level prominence does not “protect” the syllable that carries it, but deletion does change how the F0 is realized in the word.Footnote 25
(21) Examples of vowel deletion in different syllable positions.

As we discussed in section 2.2, when the penultimate vowel is deleted, the word is described with penultimate stress, and not with the typically reported antepenultimate stress; e.g., Cook’s (21d) [maːˈyaːtisiw] surfaces as [maːˈyaːtsiw].Footnote 26 When the antepenultimate vowel is deleted, the new antepenult is alleged to be stressed; e.g., Cook’s (21e) [nimasˈkisina] surfaces as [niˈmasksina].Footnote 27 It is unclear, however, what happens when there is no antepenult at all after the deletion, as in (21a). A reviewer suggests that syncope results in a syllabic nasal in this case, and that this nasal remains relatively high-pitched, which indicates in our terms that even a vowelless antepenultimate syllable can assimilate the first tone of the penultimate HL. The reviewer suggests that Cook may have identified “stress” with two different features – high pitch in antepenult, and HL pitch drop in the penult in the perceived absence of antepenult. Similarly, in Mühlbauer’s (Reference Mühlbauer and Wolfart2006) account, pitch falls on the penult to signal the head of a disyllabic foot, but when the final vowel is deleted, the foot head and its pitch fall become final, which can even result in surface minimal pairs like in (22)Footnote 28 He does not discuss what happens when the penult gets deleted.
(22) Example of surface minimal pairs on pitch-accent position (Mühlbauer Reference Mühlbauer and Wolfart2006: 250)

Even though we do not have all the necessary information about the interaction between vowel deletion and word-level prominence, it appears that the prominent syllable is not protected from deletion, contrary to long vowels, which are not deleted. This is one of the characteristics Beckman and Venditti (Reference Beckman, Venditti, Hardcastle, Laver and Gibbon2010) describe to distinguish languages like Japanese and Korean, which do not emphasize prosodic heads, and languages that do emphasize heads, like English and Greek. They describe a process of high-vowel deletion or devoicing in non-prominent positions across four different prosodic systems, viz. Greek, Quebec French, Beijing Putonghua, and Shanghai (citing Chao Reference Chao1968; Dauer Reference Dauer1980; Cedergren & Simoneau Reference Cedergren, Simoneau, Lemieux and Cedergren1985; Zee Reference Zee1990, respectively). These languages are different yet similar, they say, in avoiding weakening or deleting elements that bear a toneme or tonal morpheme, describing them as systems that “emphasize heads.” In contrast, they note that high-vowel devoicing is not restricted by the tonal patterns in Japanese and Korean (citing Maekawa & Kikuchi Reference Maekawa, Kikuchi, van de Weijer, Nanjo and Nishihara2005 and Jun & Beckman Reference Jun and Beckman1994, respectively). They describe the latter systems as emphasizing prosodic edges, not prosodic heads. Between these two system types, Plains Cree seems to fit better with Japanese and Korean, as syllable position does not play a role in its vowel deletion patterns. This suggests that Plains Cree may be an edge-prominence language, rather than head-prominent, a characteristic of non-stress languages (e.g., Prieto et al. Reference Prieto, del Mar Vanrell, Astruc, Payne and Post2012; Athanasopoulou & Vogel Reference Athanasopoulou and Vogel2016). (As in Japanese and Korean, prominence in Plains Cree is located relative to the (right) edge of the prosodic constituent, not necessarily at the edge.)
We might even be tempted to describe Plains Cree as a tone language, since both the penultimate falling and the antepenultimate high F0 are found in both sets of data in our study. However, the high F0 on the antepenult is not due to a tone anchored on the antepenult, but rather, it seems, to be anticipatory tonal assimilation from the penult, which is also not anchored, since the penult can be adjusted through either derivation or inflection or both. When we compared the word-initial and non-initial syllables it became clear that the syllables before the antepenult also have lower F0 and only the antepenult, which is adjacent to penultimate falling, has a high (rising) F0 contour. If Plains Cree were a tonal language, we would not expect tones to be found only on the last three syllables of a word and that the tones would be fixed for each syllable position. Notably, only the penult is tonally specified, and it is always HL. Nor would tones be expected to be completely determined by prosodic boundaries, as we saw with the final syllable having a low vs. high F0 in individual words and words in phrases, respectively. So we reject the possibility that Plains Cree is a tonal language like Mandarin or Yoruba.
If we discount the possibilities of Plains Cree being a stress or tone language, we are left with a category that is not very well understood or even accepted by everyone, the pitch-accent category. There are clear word-level prosodic patterns, i.e., a falling F0, which does not allow us to categorize the language as stressless either (cf. Indonesian; Athanasopoulou, Vogel & Pincus Reference Athanasopoulou, Vogel and Pincus2021). Future studies need to examine the prosodic typology of Plains Cree more closely and test the notion that it is an edge-prominence language.
5.5 The role of duration and the two length categories
Duration was not a strong cue for word-level prominence in our data. We found lengthening in both the penultimate and final syllable and in short and long vowels. The final syllable was longer than the penult for the short vowels, but for the long vowels, there was either no difference or else the penult was longer. Overall, the pattern is that the antepenult is relatively short and the last two syllables get (gradually) lengthened. Since both last two syllables are lengthened, it is hard to argue that word-level prominence has an effect on duration, as it would not explain the final syllable lengthening, which is not prominent. We might be tempted to ascribe the final syllable lengthening to phrasal boundaries on the right, but given that we found the same lengthening for the final syllable of the first word in a phrase, the phrasal level alone cannot be the cause of the lengthening. Another explanation might be that both syllables are lengthened because they belong to a single disyllabic foot, as Mühlbauer (Reference Mühlbauer and Wolfart2006) suggests, and the whole foot is lengthened. However, this does not fit well with the leftward spread of the H tone outside of the purported foot.
Considering that the language has a contrastive vowel length system, it is surprising that there are significant lengthening effects, as they present the possibility of obscuring the length categories. This is not the case, however. Even though the final syllable has the smallest durational difference between the two categories, the short vowels are still 40% of the long vowels’ duration in that position and 30 ms shorter than the shortest long category in the word (antepenult). Thus, the vowel length categories maintain their duration differences despite final lengthening. In fact, our results verify that the long and short vowels differ not only in duration, but also in vowel quality (Mühlbauer Reference Mühlbauer2012; Harrigan & Tucker Reference Harrigan and Tucker2015; Athanasopoulou & Flynn Reference Athanasopoulou and Flynn2018). Specifically, the long vowels are less centralized than the short vowels. These findings are compatible with the previous descriptions of the long vowels being tense and the short vowels being lax (ibid.). Thus, our findings agree with previous studies which report that the two length categories differ in duration and vowel quality (ibid.; see also Vogel et al. (Reference Vogel, Athanasopoulou, Pincus, Katalin, Surányi and Dékány2015) for a similar discussion about Hungarian vowels).
Certain researchers have suggested that at least for some Cree dialects, the language has changed from a vowel quantity to a full vowel quality system (e.g., Dyck, Junker & Longan Reference Dyck, Junker, Logan, Rogers and Szakay2010; Athanasopoulou & Flynn Reference Athanasopoulou and Flynn2018). We cannot tell if the current findings support such a change for Plains Cree, but the fact that duration was not manipulated to express word-level prominence is in line with a language that has contrastive vowel lengths: we do not expect duration to be a prosodic property as it might affect the identification of the length categories (see Vogel et al. (Reference Vogel, Athanasopoulou, Pincus, Katalin, Surányi and Dékány2015) for a discussion on the functional load of duration in such systems).
5.6 Limitations
An obvious limitation of the present study is that our acoustic data are drawn from a single speaker recounting biblical stories. In practice, Mrs. Sand’s recordings are the only high-quality recordings of running speech in fluent Plains Cree which are publicly available and of sufficient length to allow for quantitative testing of hypotheses. These recordings are also fully transcribed in standard roman and syllabic orthography. Future studies should examine whether our results hold of other speakers and of forms of discourse that are somewhat more natural than reading biblical stories. In the meantime, we note that our results echo the descriptive account of Mühlbauer (Reference Mühlbauer and Wolfart2006), which is based on more naturalistic data, viz. recordings of two female speakers sharing stories from their homes. Experimentally elicited productions would also help to control for such factors as focus, position in the utterance, utterance length, etc. that may affect the phonetic properties of prosody and introduce confounds in the data. Finally, it would be interesting to conduct a survey with native speakers of Plains Cree focused on their metalinguistic judgments of prominence placement. However, given the variability in fluency of speakers in Plains Cree, we may need to consider each speaker separately.
6. Conclusions
Our study examined the prosodic patterns of words with three or more syllables in Plains Cree using publicly available data from one speaker to investigate the contradictory claims about the status and position of stress in the language. We considered the duration, F0, intensity, and vowel quality of different syllables in individual words and words within phrases. In both datasets, we found a characteristic high-low F0 movement on the penultimate syllable preceded by a high F0 on the antepenultimate syllable. While most previous impressionistic descriptions consider the antepenultimate high F0 as the stressed syllable, we argue for a word-level HL pitch-accent on the penult, somewhat in line with Mühlbauer’s (Reference Mühlbauer and Wolfart2006).Footnote 29 We discussed the implications of such a system for other aspects of the language and some supporting evidence from other phenomena we found in the language (notably vowel deletion). We also briefly discussed some relevant phonological domains for the pitch-accent. This is one of the very few phonetic investigations of Plains Cree prosody and, as such, future studies are needed to examine many remaining questions and to verify previous impressionistic claims. As is clear from our results, we cannot base our formal analyses and theories on impressionistic data alone, as these might be based on incorrect facts.
Acknowledgments
We would like to thank the generous support of the University of Calgary through their Program for Undergraduate Research Experience (PURE) Award to the second author and the Energizing Arts grant to the third author.
Competing interests
The authors have no competing interests to declare.
Appendix
The second words in question were primarily ôma ᐆᒪ [oːma] ‘this’, êsa ᐁᓴ [eːsa] ‘I understand; apparently, reportedly, so it appears, evidently; this one; because of something’, and ohci ᐅᐦᒋ [oht͡si] ‘from there, thence, out of; with, by means of; because of; for; from then; about’ (glosses from Wolvengrey Reference Wolvengrey2011). Thus our measurements for a short penultimate vowel in Table A1 typically represent /o/ in ohci ᐅᐦᒋ. Crucially, a short vowel is relatively long before coda /h/ (cf. Athanasopoulou & Flynn Reference Athanasopoulou and Flynn2018). An example from our data is shown in figure A1.
Average duration (ms) for each syllable of the second word (disyllabic) in our phrases. The standard deviation is shown in parentheses

Average duration (ms) for initial and non-initial antepenultimate or preceding syllables. The standard deviation is shown in parentheses

askîhk ohci ᐊᐢᑮᕁ ᐅᐦᒋ ‘from the land’.


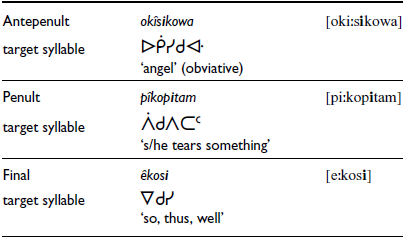
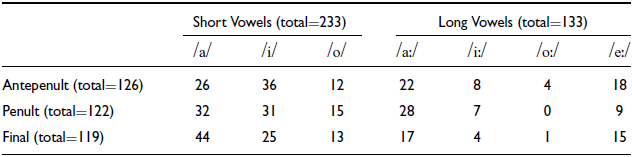
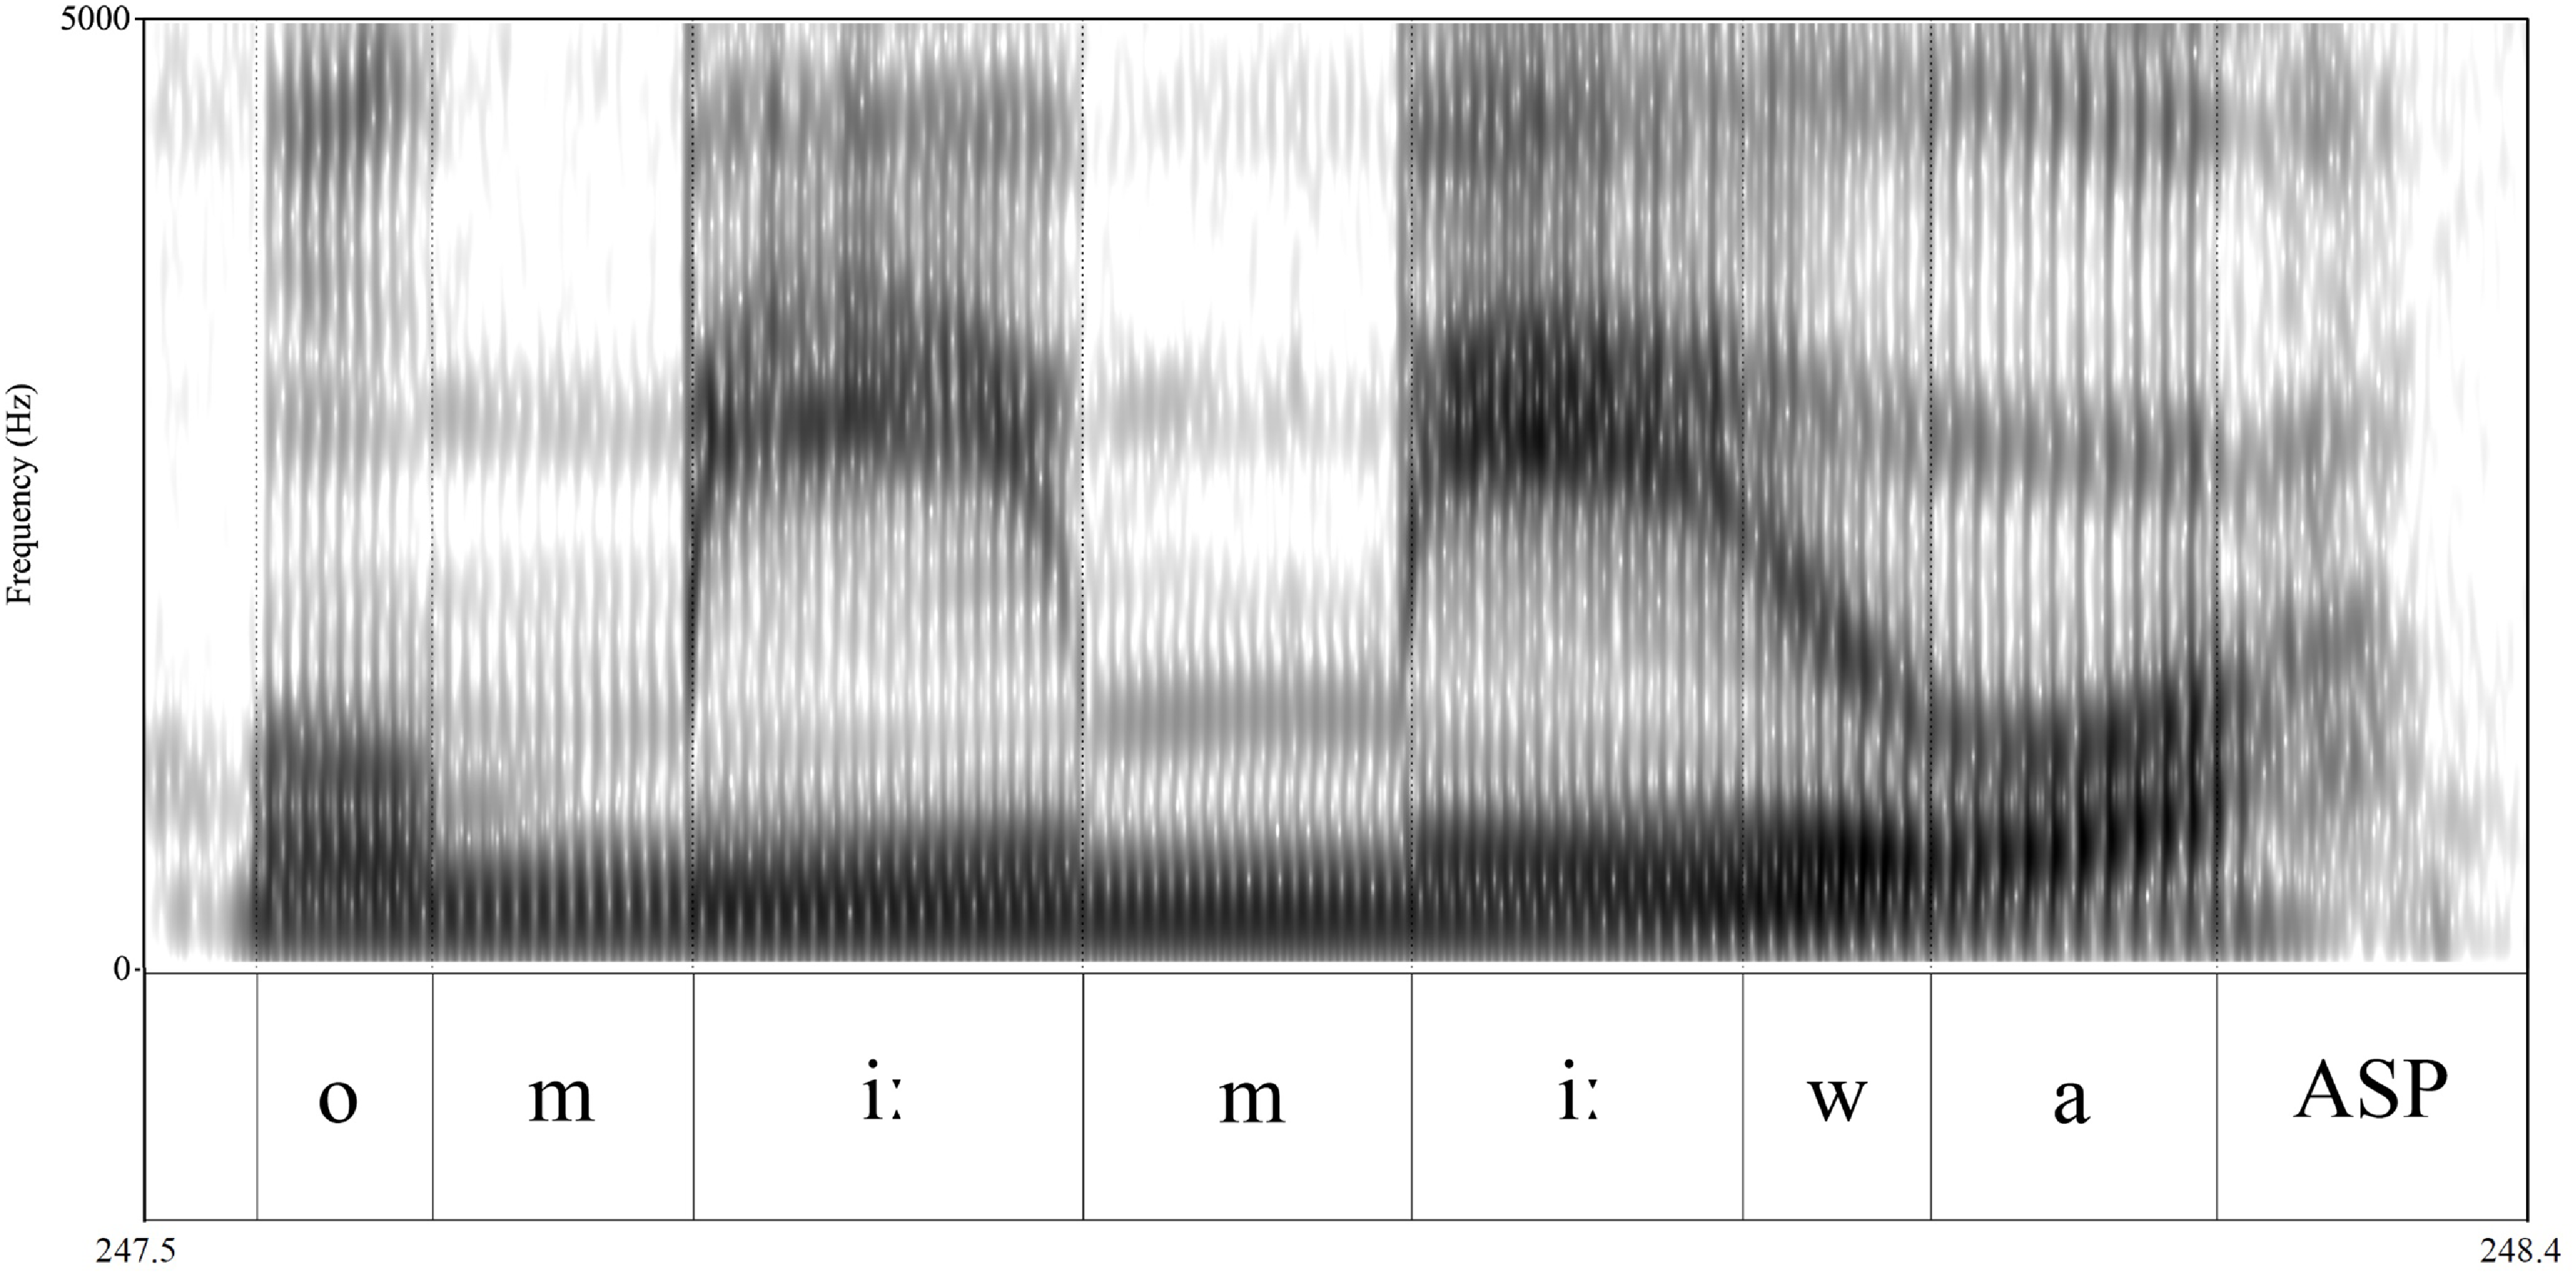


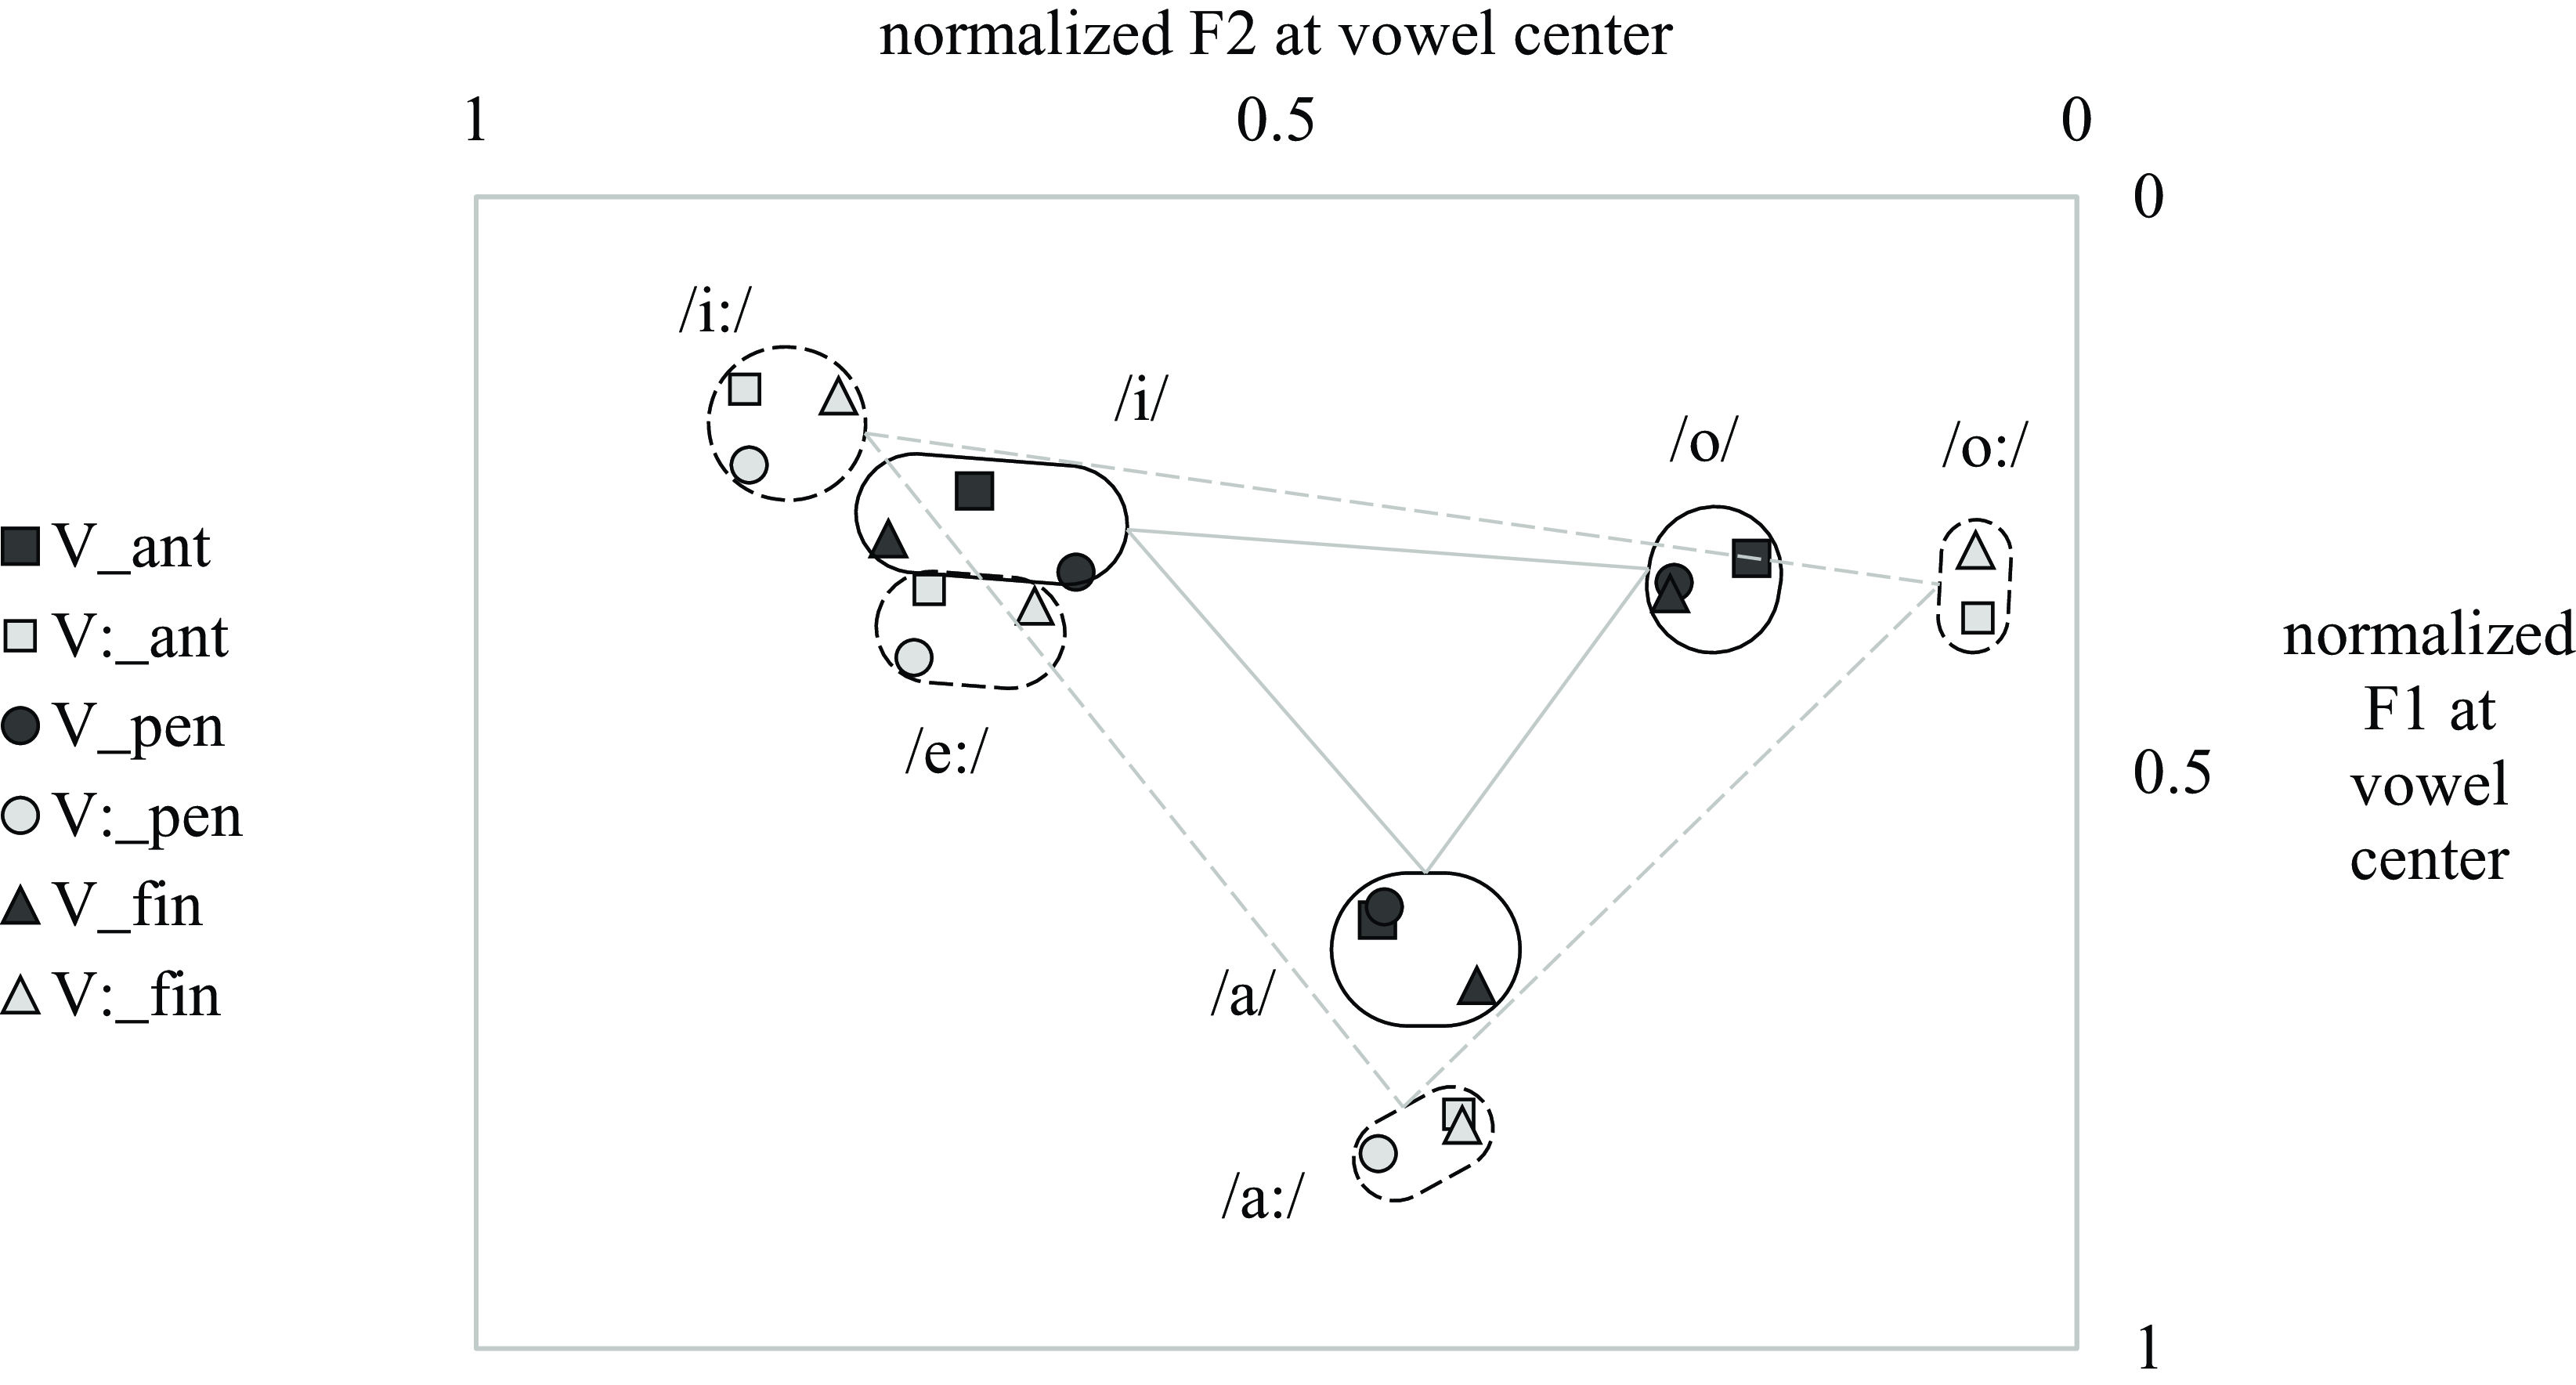

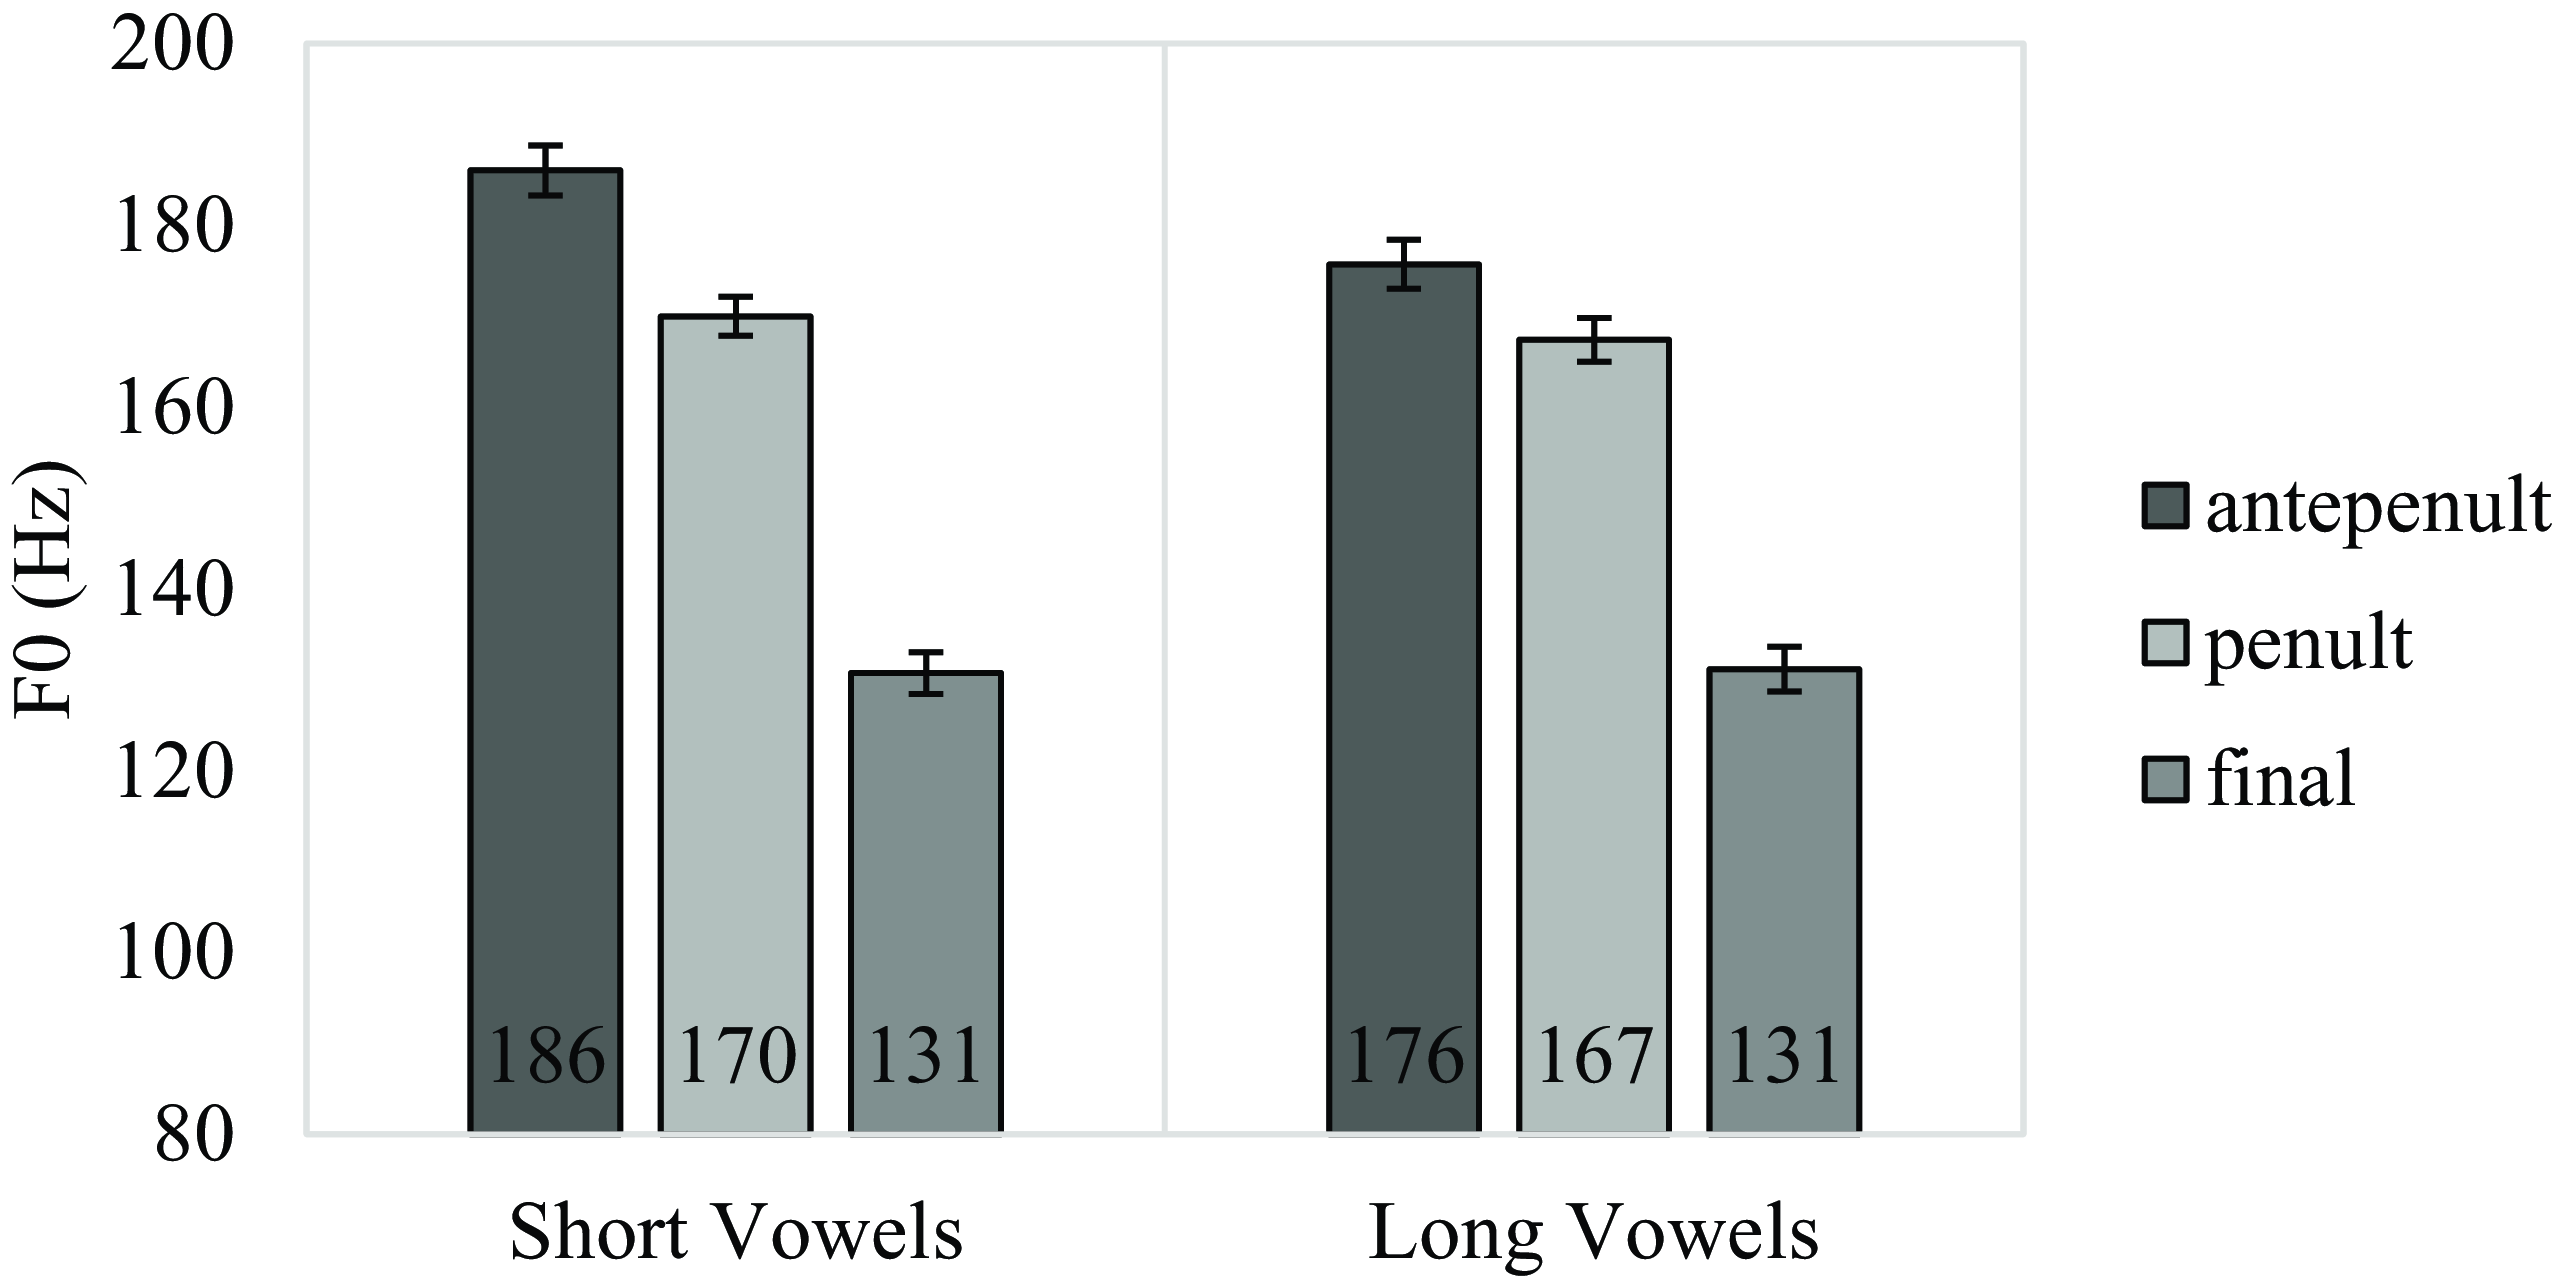


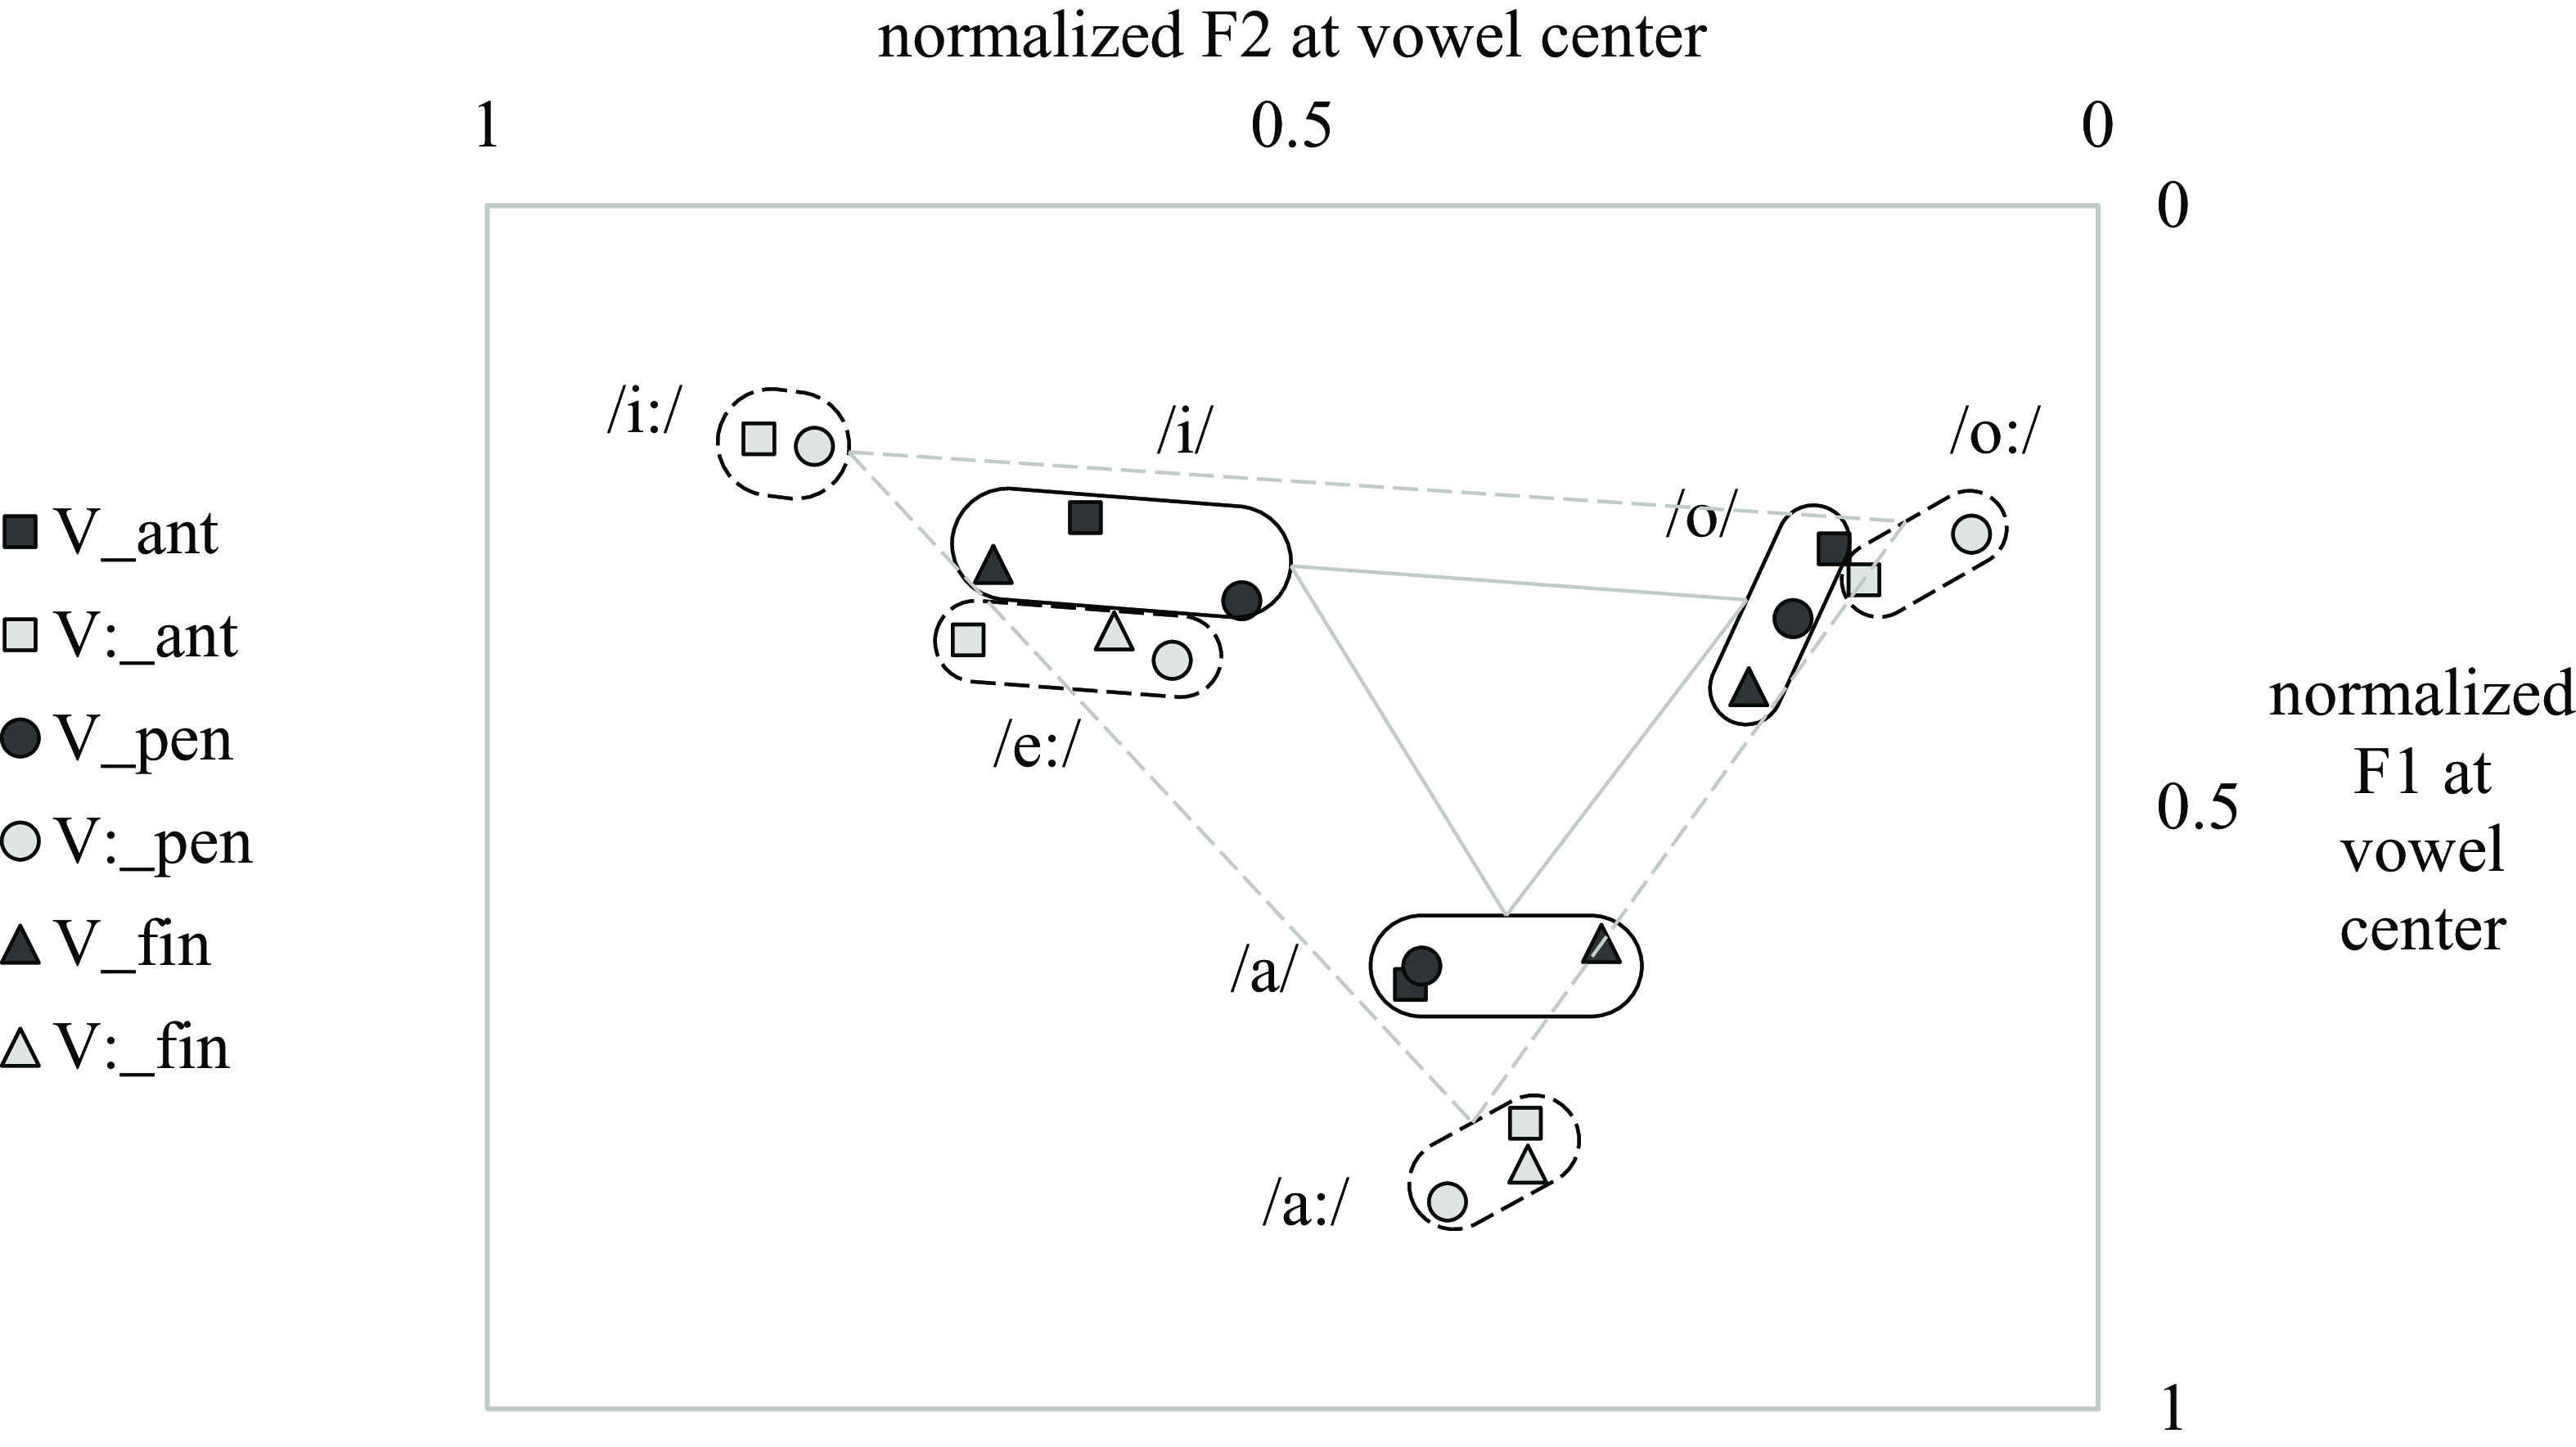


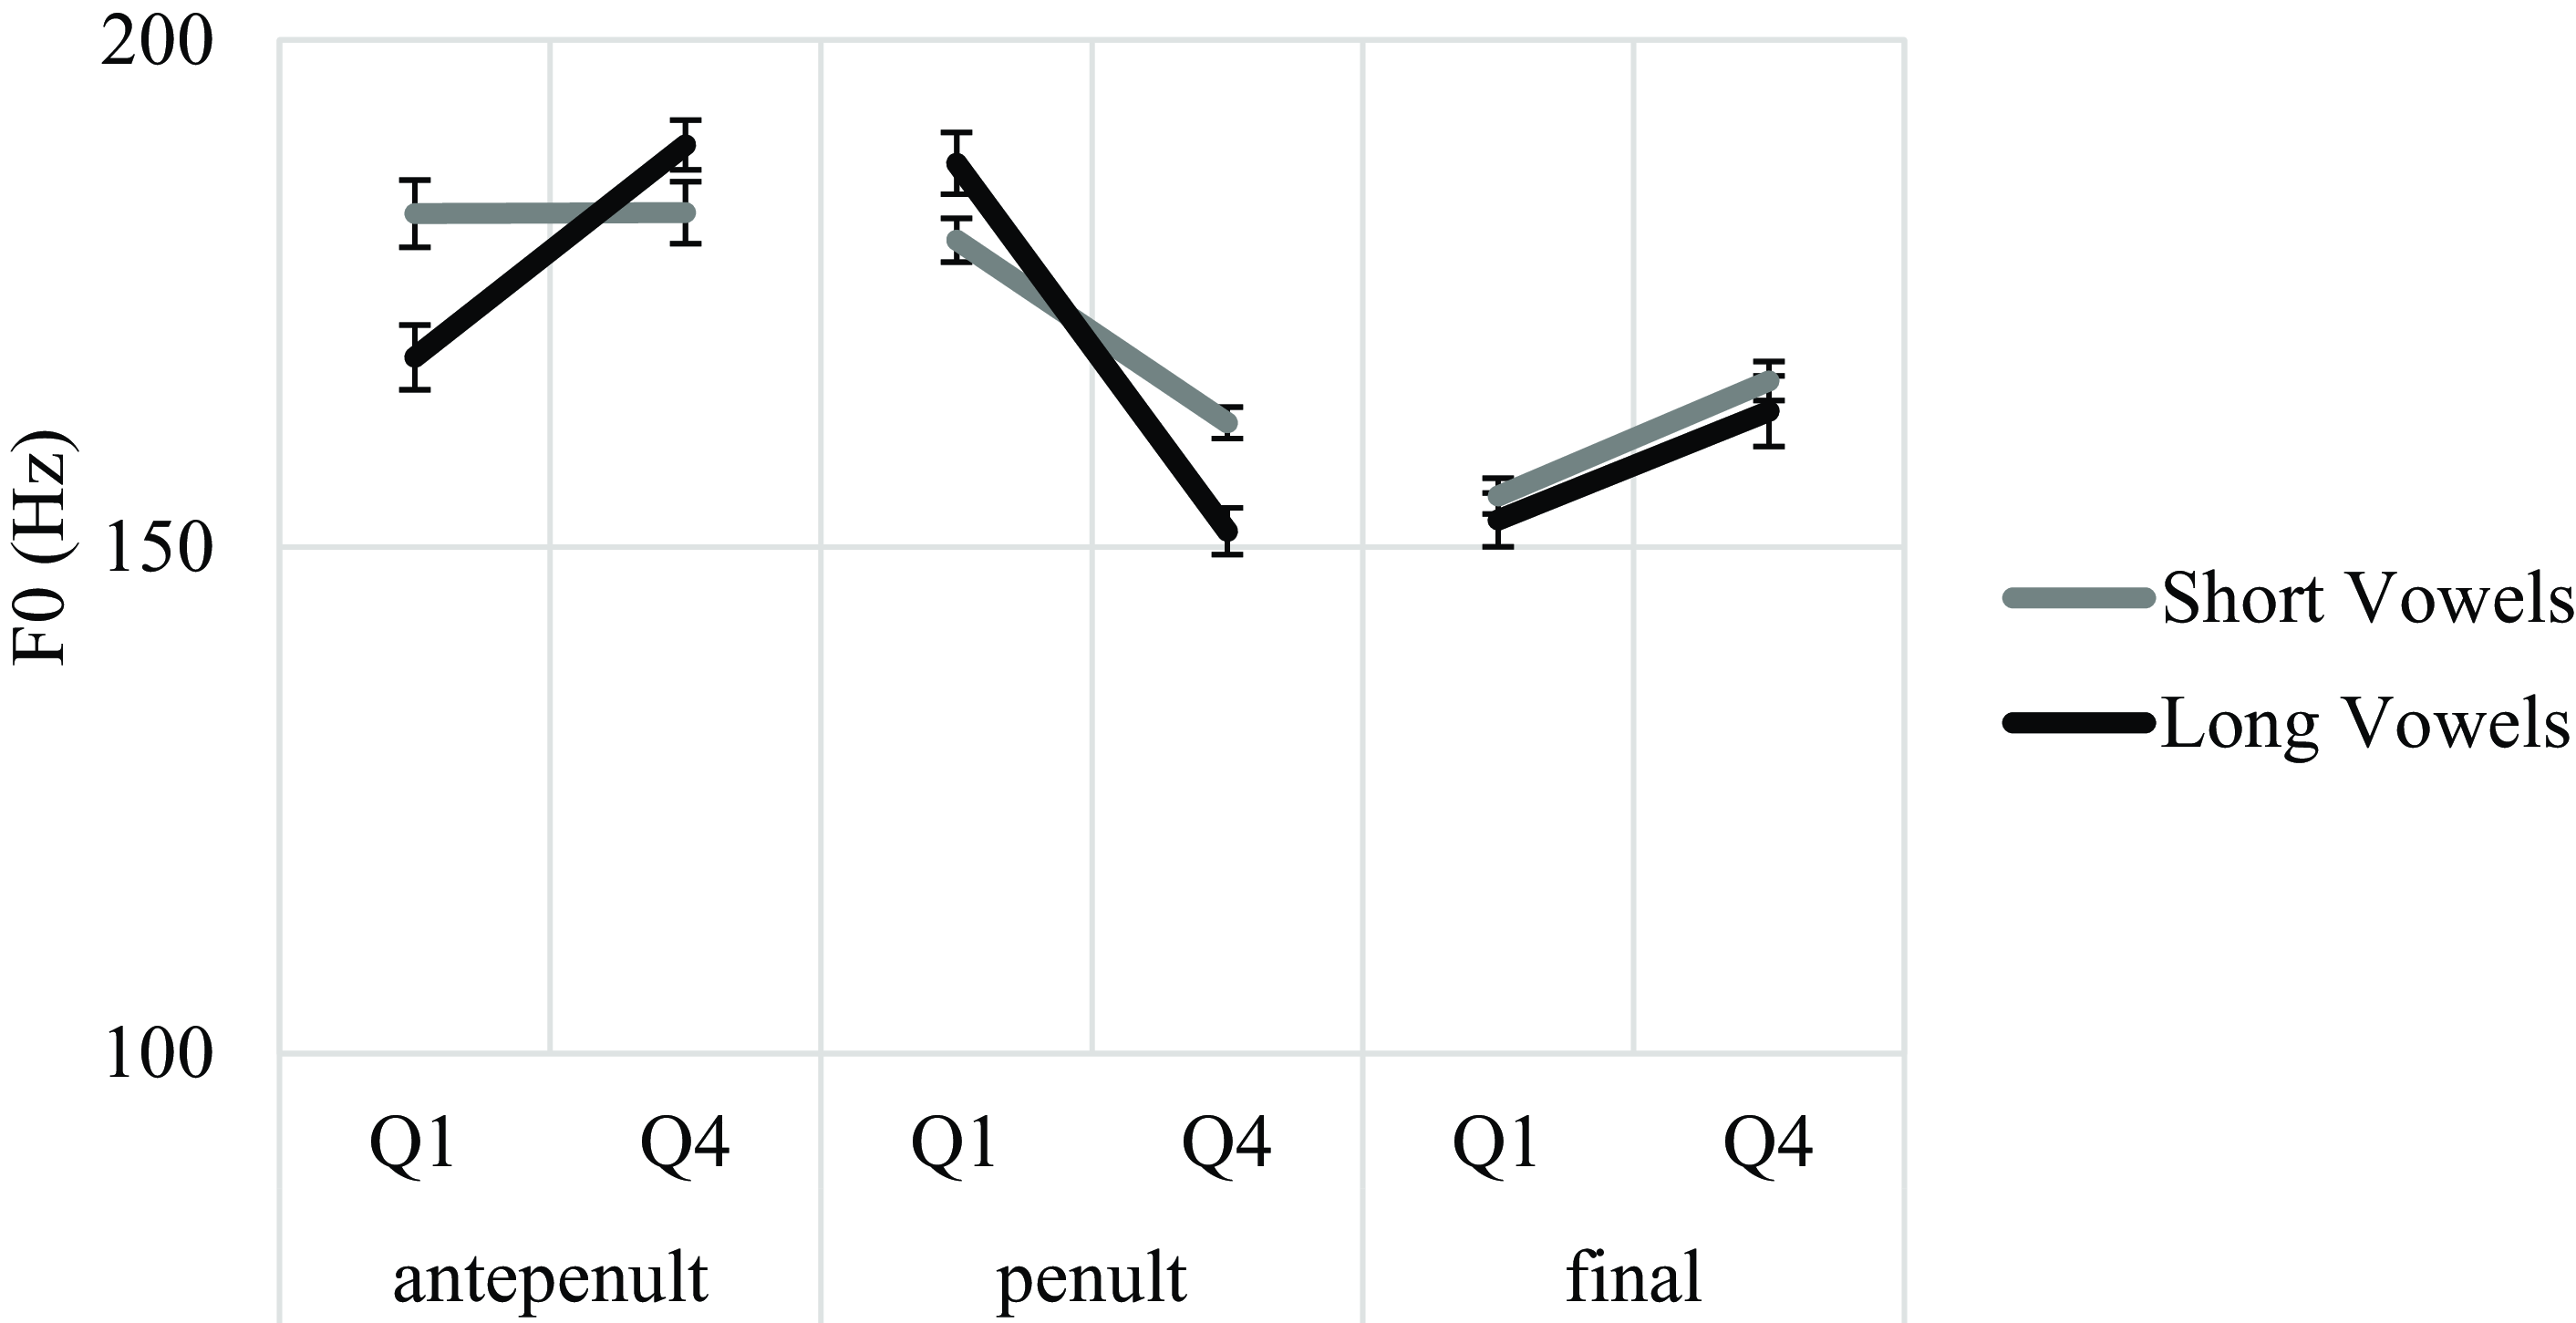
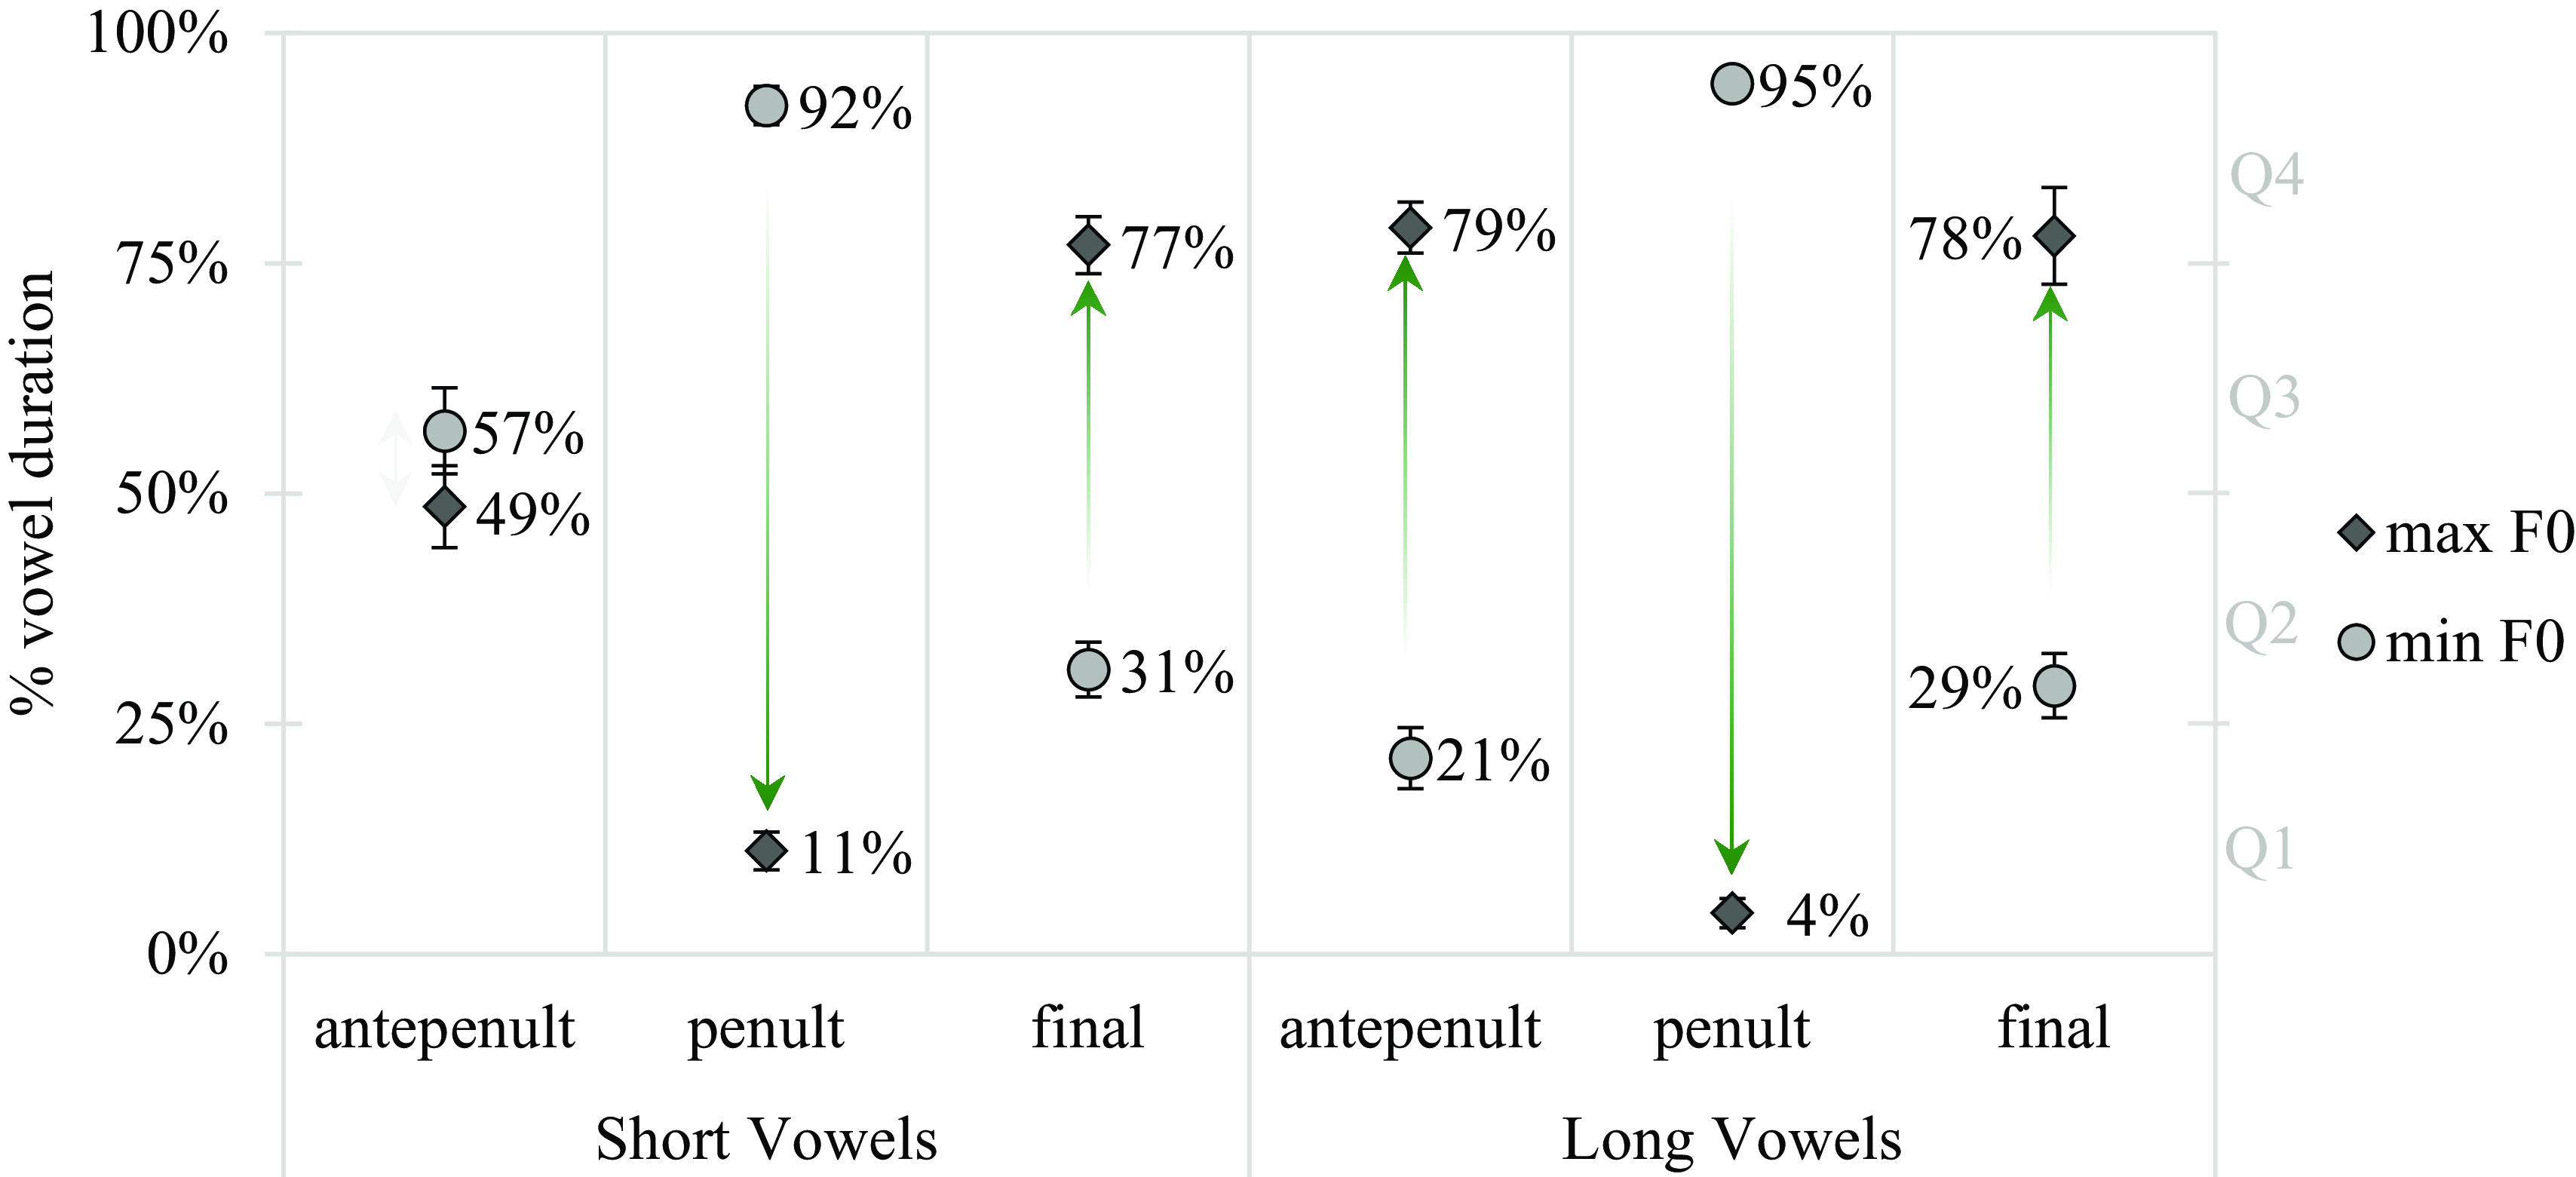

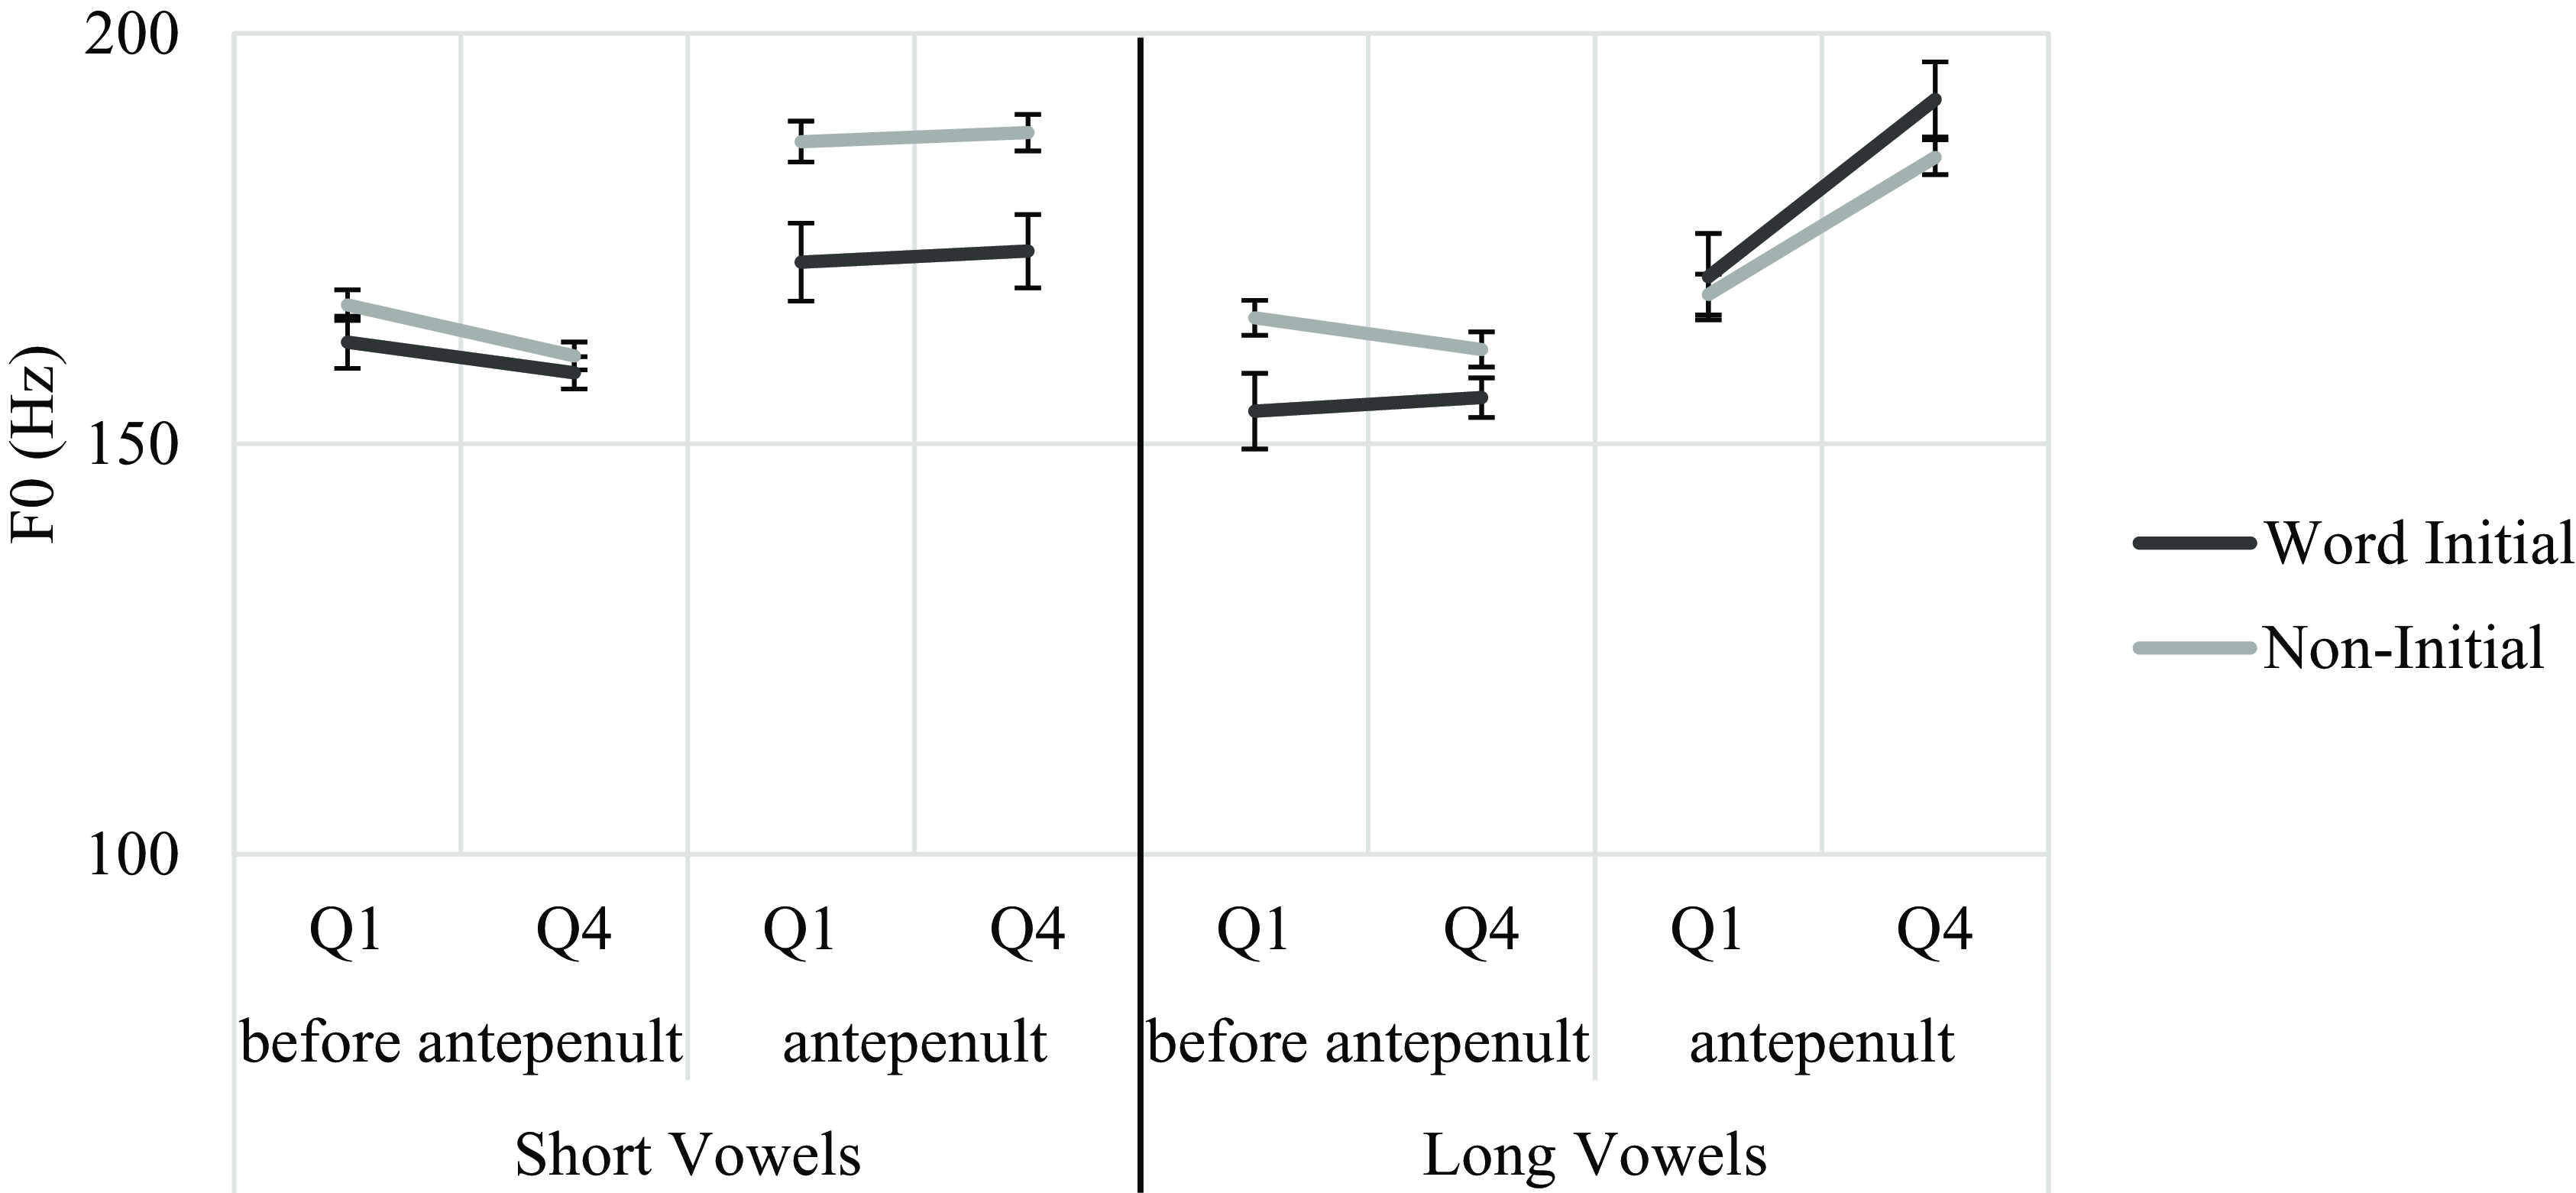


 Open access