

Introduction
Coastal sites have long been a significant focus of archaeological research, particularly in the Mediterranean, a region that is well suited to the study of maritime connectivity, trade and interaction (Knapp & Demesticha Reference Knapp and Demesticha2017). The generally benign Mediterranean Sea regime (modest tides and wave action) has facilitated the establishment and endurance of many coastal sites throughout history, but has also contributed to their incremental exposure and erosion. Despite recent theoretical and methodological advances in coastal archaeology, on-going erosion remains a serious predicament for both the preservation and interpretation of coastal sites. Coastal erosion often leads to an irreparable loss of information used in the identification of maritime structures and activities. The Mediterranean, then, is a hotspot of both opportunity and concern.
In light of the time and financial constraints of a large-scale systematic recording of the coastline (Agapiou et al. Reference Agapiou, Lysandrou and Hadjimitsis2017), the Cyprus Ancient Shoreline Project (CASP) developed a classification scheme that will augment strategic planning for sustainable monitoring of continuously exposed archaeological features (Figure 1). The project focuses on the island of Cyprus and its role in the international trade networks of the Eastern Mediterranean since the second millennium BC, a subject that has received considerable attention. This preliminary analysis examines a 20km-long stretch of the south-central coast of Cyprus, extending from Cape Dolos to Cape Kiti (Figure 2).
Examples of eroding archaeological features from Cyprus recorded by the Cyprus Ancient Shoreline Project. Top: wall (1m preserved height, 1.2m width, 5.5m of maximum exposed length), containing stratified Late Bronze and Early Iron Age pottery found at Tochni-Lakkia, a site with evidence for large-scale storage and possibly also pottery production; bottom left: the remains (base) of a stone-filled pit found at Tochni-Lakkia; bottom right: rescue-excavated tomb exposed at Maroni-Tsaroukkas, a Late Bronze Age site with significant evidence for international interaction (imported artefacts, anchors, boat models), as well as monumental architecture (photographs by the author and Sturt Manning).

Late Bronze Age to Late Roman coastal sites along the south-central coast of the island (produced on ArcGIS by the author using a basemap with permission from the DLS).

Coastal erosion and cultural heritage in south-central Cyprus
South-central Cyprus is experiencing the highest rates of coastal erosion on the island. Although archaeological sites in this region have received increased attention thanks to systematic surveys (Manning et al. Reference Manning, Collon, Conwell, Jansen, Steel and Swinton1994; Manning et al. Reference Manning, Monks, Sewell and Demesticha2000; Georgiou Reference Georgiou2013; Andreou & Sewell Reference Andreou, Sewell, Matthäus, Morstadt and Vonhoff2015; Demesticha Reference Demesticha and Demesticha2015), the impact of coastal erosion has only recently been investigated from a cultural heritage perspective (Agapiou et al. Reference Agapiou, Lysandrou and Hadjimitsis2017; Andreou et al. Reference Andreou, Opitz, Manning, Fisher, Sewell, Georgiou and Urban2017). Since 2014, the CASP has compiled historical (medieval maps), archaeological (terrestrial and underwater survey) and geographical (aerial photographs) information to reconstruct historical coastlines in this region digitally, and to map sites that are under threat. More recently, this dataset was examined to classify the severity of coastal erosion, and to highlight the areas that require more frequent recording.
Erosion classification and archaeological risk assessment
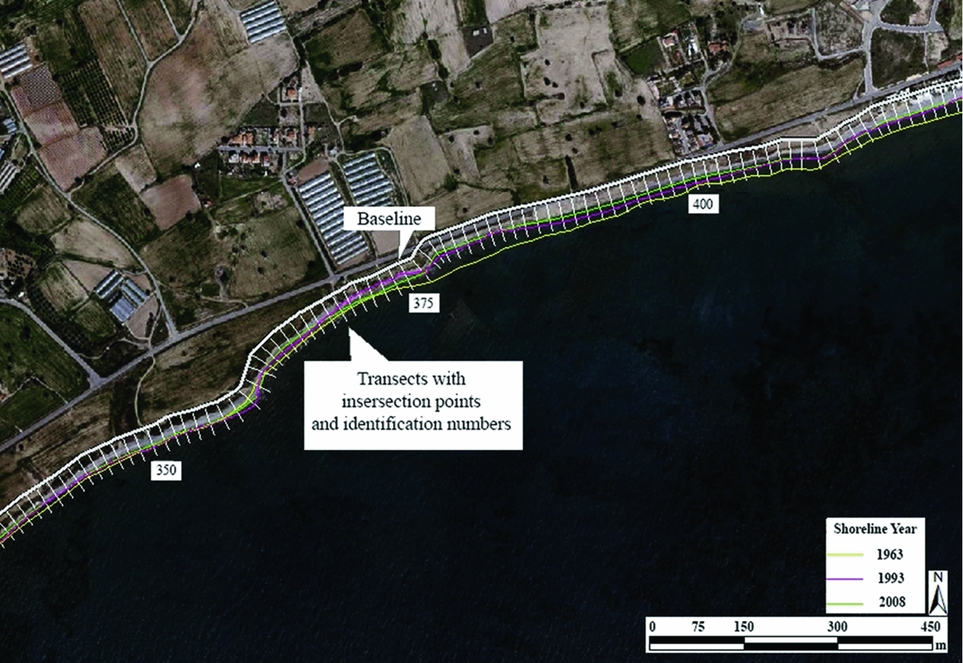
To classify the severity of coastal erosion in segments of 20m, CASP used the Digital Shoreline Analysis System (DSAS), a toolbar for ArcGIS that allows a detailed analysis of diachronic changes in the coastline (Thieler et al. Reference Thieler, Himmelstoss, Zichichi and Ayhan2009; Radosavljevic et al. Reference Radosavljevic, Lantuit, Pollard, Overduin, Coutur, Sachs, Helm and Fritz2016; O'Rourke Reference O'Rourke2017). The classification process compares the location of digitised historical shorelines (Andreou et al. Reference Andreou, Opitz, Manning, Fisher, Sewell, Georgiou and Urban2017) through the generation of perpendicular transects with customisable lengths and intermittent distances, every 20m, between the transects (Figure 3). This comparison concludes with a table that quantifies the net shoreline movement along each transect (Figure 4).
The components of the Digital Shoreline Analysis System function in ArcGIS (produced on ArcGIS by the author with an aerial photograph used with permission from the DLS). The shorelines of 1963 (yellow), 1993 (pink) and 2008 (green) are superimposed on a 2014 aerial photograph (provided by and used with permission from the DLS). A white baseline parallel to the shoreline and a series of white transects perpendicular to the shoreline were produced on the Digital Shoreline Analysis System (ArcGIS) and subsequently used to measure the historical changes in the location of the coastline.
Classification of coastal erosion (high, medium, low) according to the results of the Digital Shoreline Analysis System analysis used to inform future research on maritime archaeology (produced on ArcGIS by the author).

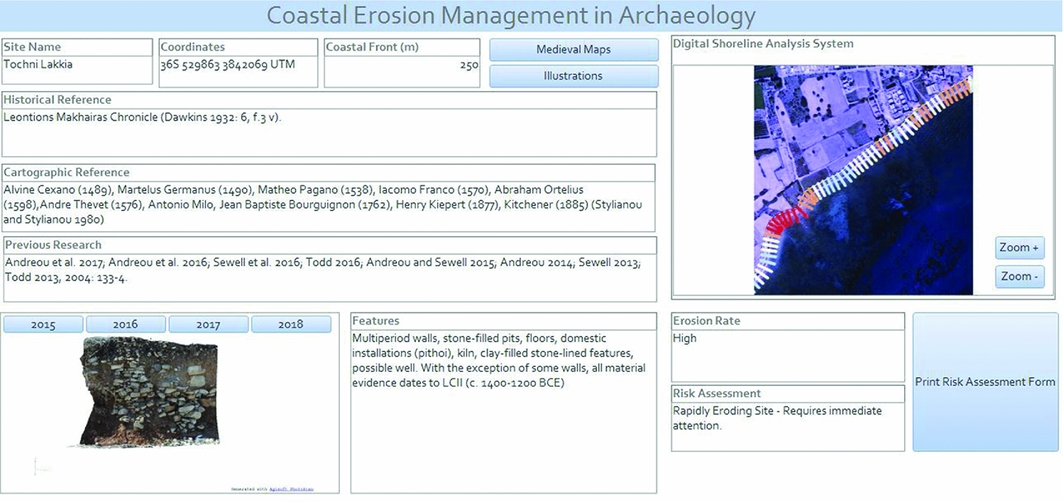
The results of this classification process highlight the locations that have experienced higher rates of erosion (indicated with red and orange) since the 1960s, and which, accordingly, require more frequent archaeological recording. This classification is stored in a relational database along with photographs, illustrations, historical and cartographical references, aerial photographs and quantifiable photogrammetric models (Figure 5). The combination of these data forms the core information for coastal archaeological risk assessment, which in turn can inform strategies for coastal monitoring by directing endeavours to the most vulnerable areas.
Example entry (the site of Tochni-Lakkia) in the relational database showing information used to develop risk assessments for different coastal sites.
Conclusion
The results of this project enable the assessment of erosion risk on known sites and thus help to prioritise the monitoring of the most endangered areas. They can also provide information for the recovery of otherwise unknown sites. While the use of the Digital Shoreline Analysis System highlights areas that are more vulnerable to coastal erosion, it also demonstrates the large number of locales that have potentially lost visible evidence of past maritime interactions. Future research will focus on the development of GeoApps—mobile apps that collect, store and analyse georeferenced data—to accommodate crowd-sourced information on the location of eroding features.
Acknowledgements
I wish to thank the Department of Antiquities, Cyprus, for permission to carry out this work, and the Department of Lands and Surveys for permission to use geographical information. This research was funded by the Honor Frost Foundation and the Council of British Research in the Levant.


