


Almost all extant measures of democracy involve some degree of subjective coding. As is widely recognized, coder judgments may be affected by many factors that introduce error into the coding of a country. These factors include personal preferences, political preferences, lack of information, biased sources, varying ideas about how to conceptualize democracy, and data-entry mistakes.Footnote 1
Little and Meng (Reference Little and Meng2023) identify one specific bias that could have devastating consequences for our understanding of democracy in the twenty-first century. Backsliding, they surmise, is part of the zeitgeist, seemingly confirmed by the rise of Trump in the United States, Modi in India, Orbán in Hungary, and other populists around the world. This vision of doom is trumpeted by major media outlets, which adopt the backsliding frame to explain unfolding events in a readily comprehensible manner. This vision has been adopted by leaders in the West, who see global forces arrayed on either side of a growing divide—between democracies (the good guys) and autocracies (the bad guys). It is catnip to a growing industry of democracy scholars and activists whose business is to be concerned about the fate of democracy. Arguably, doom-saying enhances the importance and funding available to democracy scholars and activists, thereby serving their interests.
A more benign interpretation is that democracy indices have become more demanding in their standards. Expert coders, primed to find evidence of backsliding, critically examine facts on the ground, sensing a fundamental threat to democracy in every populist outcry. A high score for democracy thus is more difficult to achieve in 2020 than it was in 2000 because coders are more attentive to democratic deficits.
Whichever mechanism(s), it is easy to envision backsliding as a shibboleth of the twenty-first century with particular resonance in the West, where all widely used democracy indices are headquartered and produced. The hypothetical result is a systematically biased coding of democracy during the past few decades, an apparent downturn that is the product of a collective miasma or changes in the way democracy is understood.
To illustrate this problem, Little and Meng (Reference Little and Meng2023) provide an index of democracy based solely on observable features relevant to democracy and therefore resistant to errant subjective judgments. Because this index demonstrates little change in the past few decades, it seems to corroborate the hypothesis that backsliding is more illusion than reality. Yet, Little and Meng do not regard the index as an adequate annual measure of democracy—a point highlighted in this symposium, in which Knutsen et al. (Reference Coppedge2024) demonstrate that the index is prone to problems of conceptualization, indicator selection, aggregation, and coverage. This does not mean that Little and Meng are wrong about biases toward backsliding in current democracy indices; however, it does suggest that there may be better ways to address the question.
This study adopts an approach that, although also based on observables, may be less susceptible to the problems identified by Knutsen et al. (Reference Coppedge2024). Briefly, we train a random forest model to predict existing indices of democracy using only easily observable features of democracy and a sample limited to the years before the generally recognized onset of backsliding. We then apply the model to predict scores for the original indices across the entire period, comparing those scores to the scores recorded by each index. This approach suggests that backsliding is real, although it may begin later and may not be as pronounced as the trajectory registered in other democracy indices.
We first define our methodology, called observable-to-subjective score mapping (OSM) and based on Weitzel et al. (Reference Weitzel, Gerring, Pemstein and Skaaning2023a), which includes further details. The second section presents the results of our analyses applied to three prominent democracy indices. The third section discusses various robustness tests. The fourth section considers the missing-data problem posed by measuring a latent concept with observables. The conclusion reflects on what can be learned from this exercise about purported democratic downturns in the twenty-first century.
METHODOLOGY
It is helpful that many features relevant to democracy are observable, or relatively so—observability being a matter of degrees. However, it is no mean feat to measure these features in a comprehensive manner, to select which ones to include in an index, and to arrive at a method of aggregation that has credibility while preserving the nuance required to discern backsliding.
Nuance is an important consideration because most countries regarded as recent backsliders have not abolished elections, outlawed all opposition parties, or dissolved the legislature. Rather, incumbents have figured out clever ways to undermine the independence of institutions and tilt the electoral playing field in their favor. To capture backsliding, it is essential to capture these nuances. Binary indices such as democracy–dictatorship (Cheibub, Gandhi, and Vreeland Reference Cheibub, Gandhi and Vreeland2010) and the Boix, Miller, and Rosato (Reference Boix, Miller and Rosato2013) index are not sufficient.
Our approach enlists OSM, an approach to measurement adapted for situations in which both subjectively coded and directly observable (“objective”) indicators of a concept are available (Weitzel et al. Reference Weitzel, Gerring, Pemstein and Skaaning2023a). We begin with extant indices of democracy based largely on subjective coding, with the assumption that these measurement instruments have some prima facie validity—or at least did have before the era of alleged backsliding.
We focus on three of the most widely used non-dichotomous measures of democracy: the Polyarchy index from Varieties of Democracy (V-Dem) (Teorell et al. Reference Teorell, Coppedge, Lindberg and Skaaning2019); the Polity2 index from the Polity IV project (Marshall, Gurr, and Jaggers Reference Marshall, Gurr and Jaggers2015); and the political rights and civil liberties indicators (combined into a single index by addition) from Freedom House (2021). To ensure comparability, we restricted the sample for the following exercise to a common set of 167 polities (see table SI 5 in the online appendix).
Each of the chosen indices forms a target, which we attempted to predict with a wide variety of observable indicators. It is important to be as inclusive as possible in the collection of these indicators to avoid arbitrary (“subjective”) exclusions that might bias the results. As long as a feature was observable for a broad set of cases and potentially relevant to democracy, it was included in our canvas. A total of 26 indicators drawn from Weitzel et al. (Reference Weitzel, Gerring, Pemstein and Skaaning2023a) was reenlisted for our study (see table SI 1.1 in the online appendix).
These 26 indicators were treated as predictors in a random forest model in which an existing index of democracy is the outcome to be explained. In this instance, the training set was restricted to the pre-backsliding period, when subjective coding was not affected by current expectations of backsliding.
It is an open question about when the concept of backsliding, or democratic downturn, first took hold. A Google Ngram, drawing on the Google Books database, shows an uptick in references to “democratic backsliding” around 2010 (see figure SI 6.1 in the online appendix). To avoid any possible overlap, we restricted the training set to the years before 2000. This training period extends back to 1900 for Polyarchy and Polity2 and to 1972 for Freedom House, the first year of coding for that index (Weitzel et al. Reference Weitzel, Gerring, Pemstein and Skaaning2023b).
We regard this training set as free from the potential bias identified by Little and Meng (Reference Little and Meng2023). Other biases may exist, but these features presumably remain constant through the twentieth and twenty-first centuries; therefore, they either do not affect observed trends over time or they are specific to pre-2000 periods.
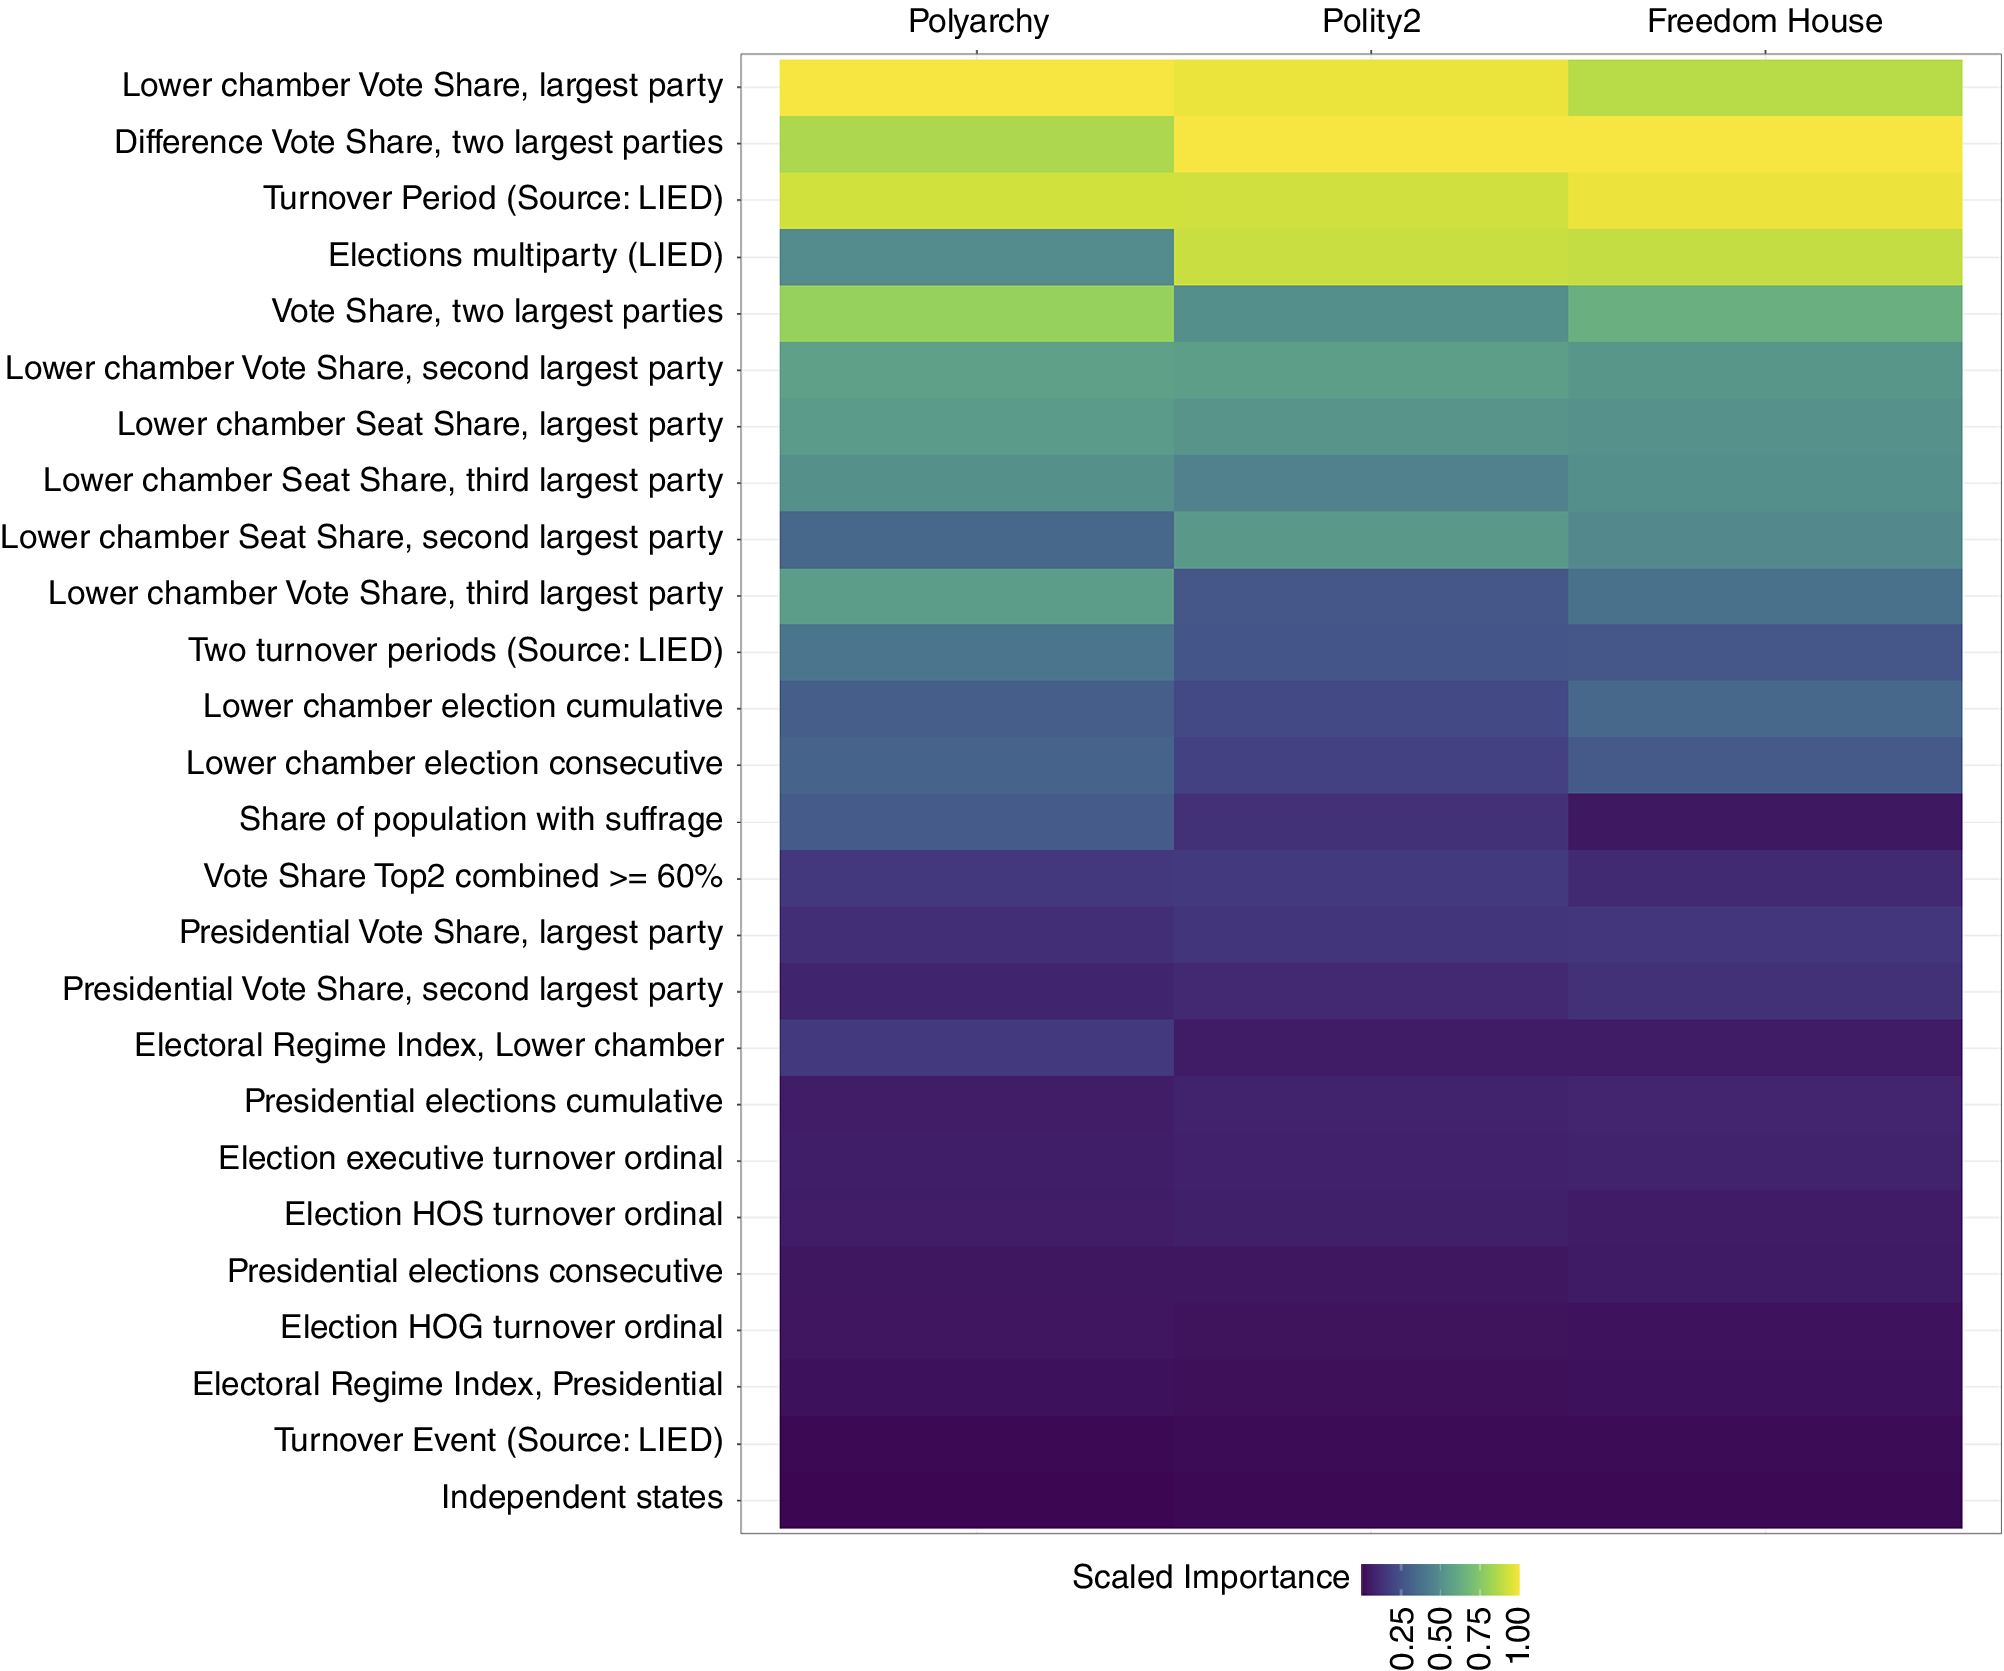
The random forest model assigns weights to each of the 26 variables based on their predictive value. As shown in figure 1, these “importance scores” have marginal differences in the scores assigned to each variable across the three democracy indices. However, importance scores are highly correlated, much like the indices themselves.
Variable Importance Plot for Three Democracy Indices
The scaled importance of each variable in the different random forest models. Lighter colors indicate that a variable is more important in a random forest. Individual variable importance plots are in online appendix SI 3.
Finally, we used the OSMs from the twentieth century to predict values for the twenty-first century (2000–2022).Footnote 2 That is, we used the pre-2000 period to learn how to translate the conceptualizations of each index into an aggregation of observable indicators. This translation—linking measures to concepts—was applied to the out-of-sample period (post-2000) using only observable indicators as input. This protocol purges the post-2000 predictions of any direct human influence, including zeitgeist-driven bias. If the democratic backsliding reported in subjective indices is due to coder expectations about backsliding or changing standards for democracy—rather than some reality “out there”—these predictions should not show any decline.
RESULTS
We first discuss the Polyarchy index. Panel (a) in figure 2 plots the original index and OSM predictions across the entire period of observation, averaging across all 167 countries in our sample (equally weighted).
Polyarchy and OSM Predictions
Panel (a): Polyarchy (dark blue and OSM predictions for Polyarchy (orange) flanked by 95% confidence intervals from 1900 to 2022. Panel (b): the change in Polyarchy scores (Y axis) against change in OSM predictions (X axis) from 2000 to 2022, for which a positive value indicates an improved democracy score.
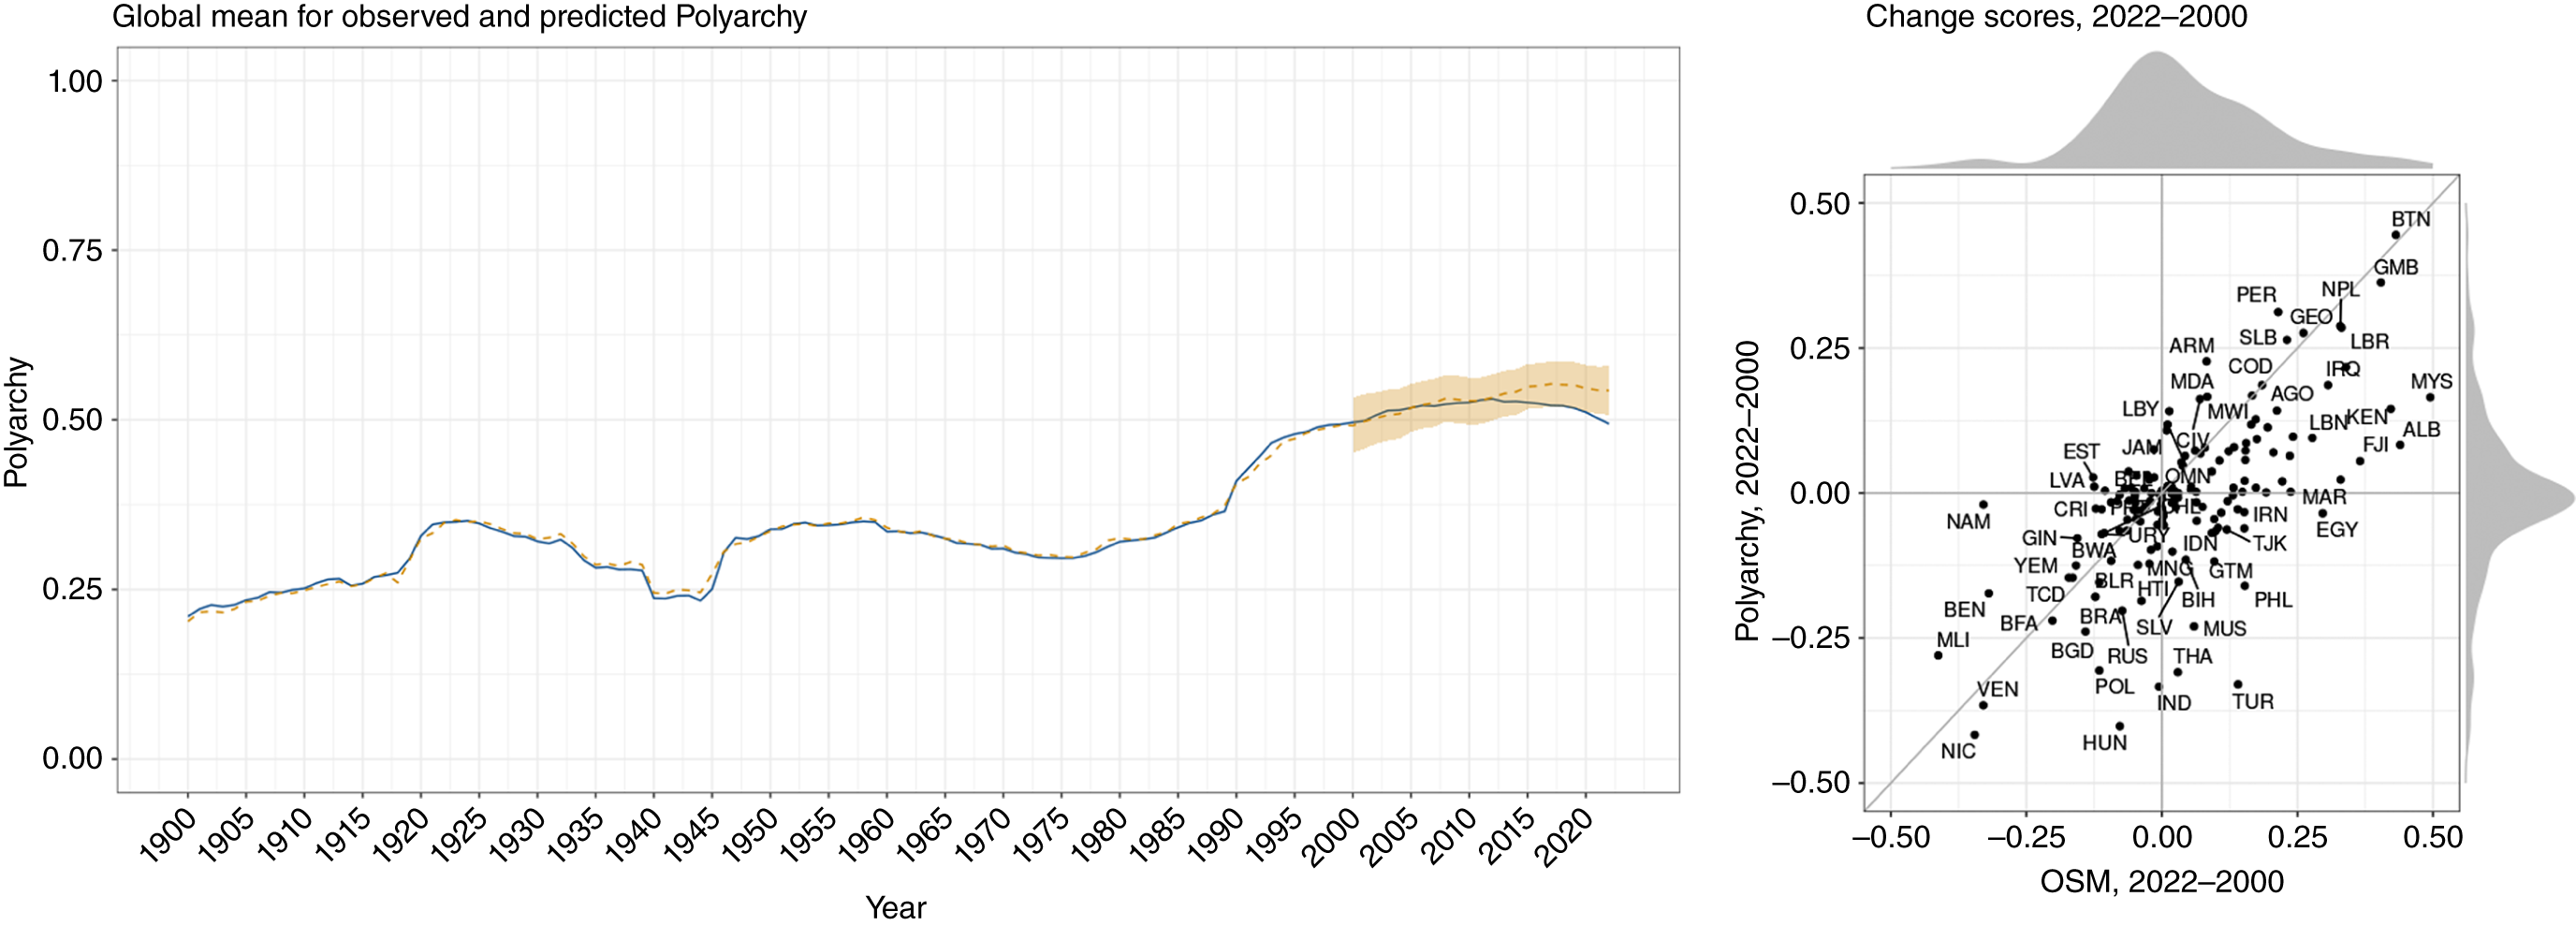
OSM predictions closely track Polyarchy, with a small divergence at the very end of the period, around 2015, when they increase slightly above Polyarchy. Numeric values, recorded in table 1, show that differences across the two time-series are minute. For example, between 2001 and 2022, the largest difference between Polyarchy and OSM predictions of Polyarchy is 0.048 on a 0-to-1 scale. Only a few points at the very end of the time-series fall outside of the 95% confidence interval of the mean for the OSM prediction (see the shaded region in figure 2).Footnote 3
Global Means of Democracy Indices and OSM Predictions
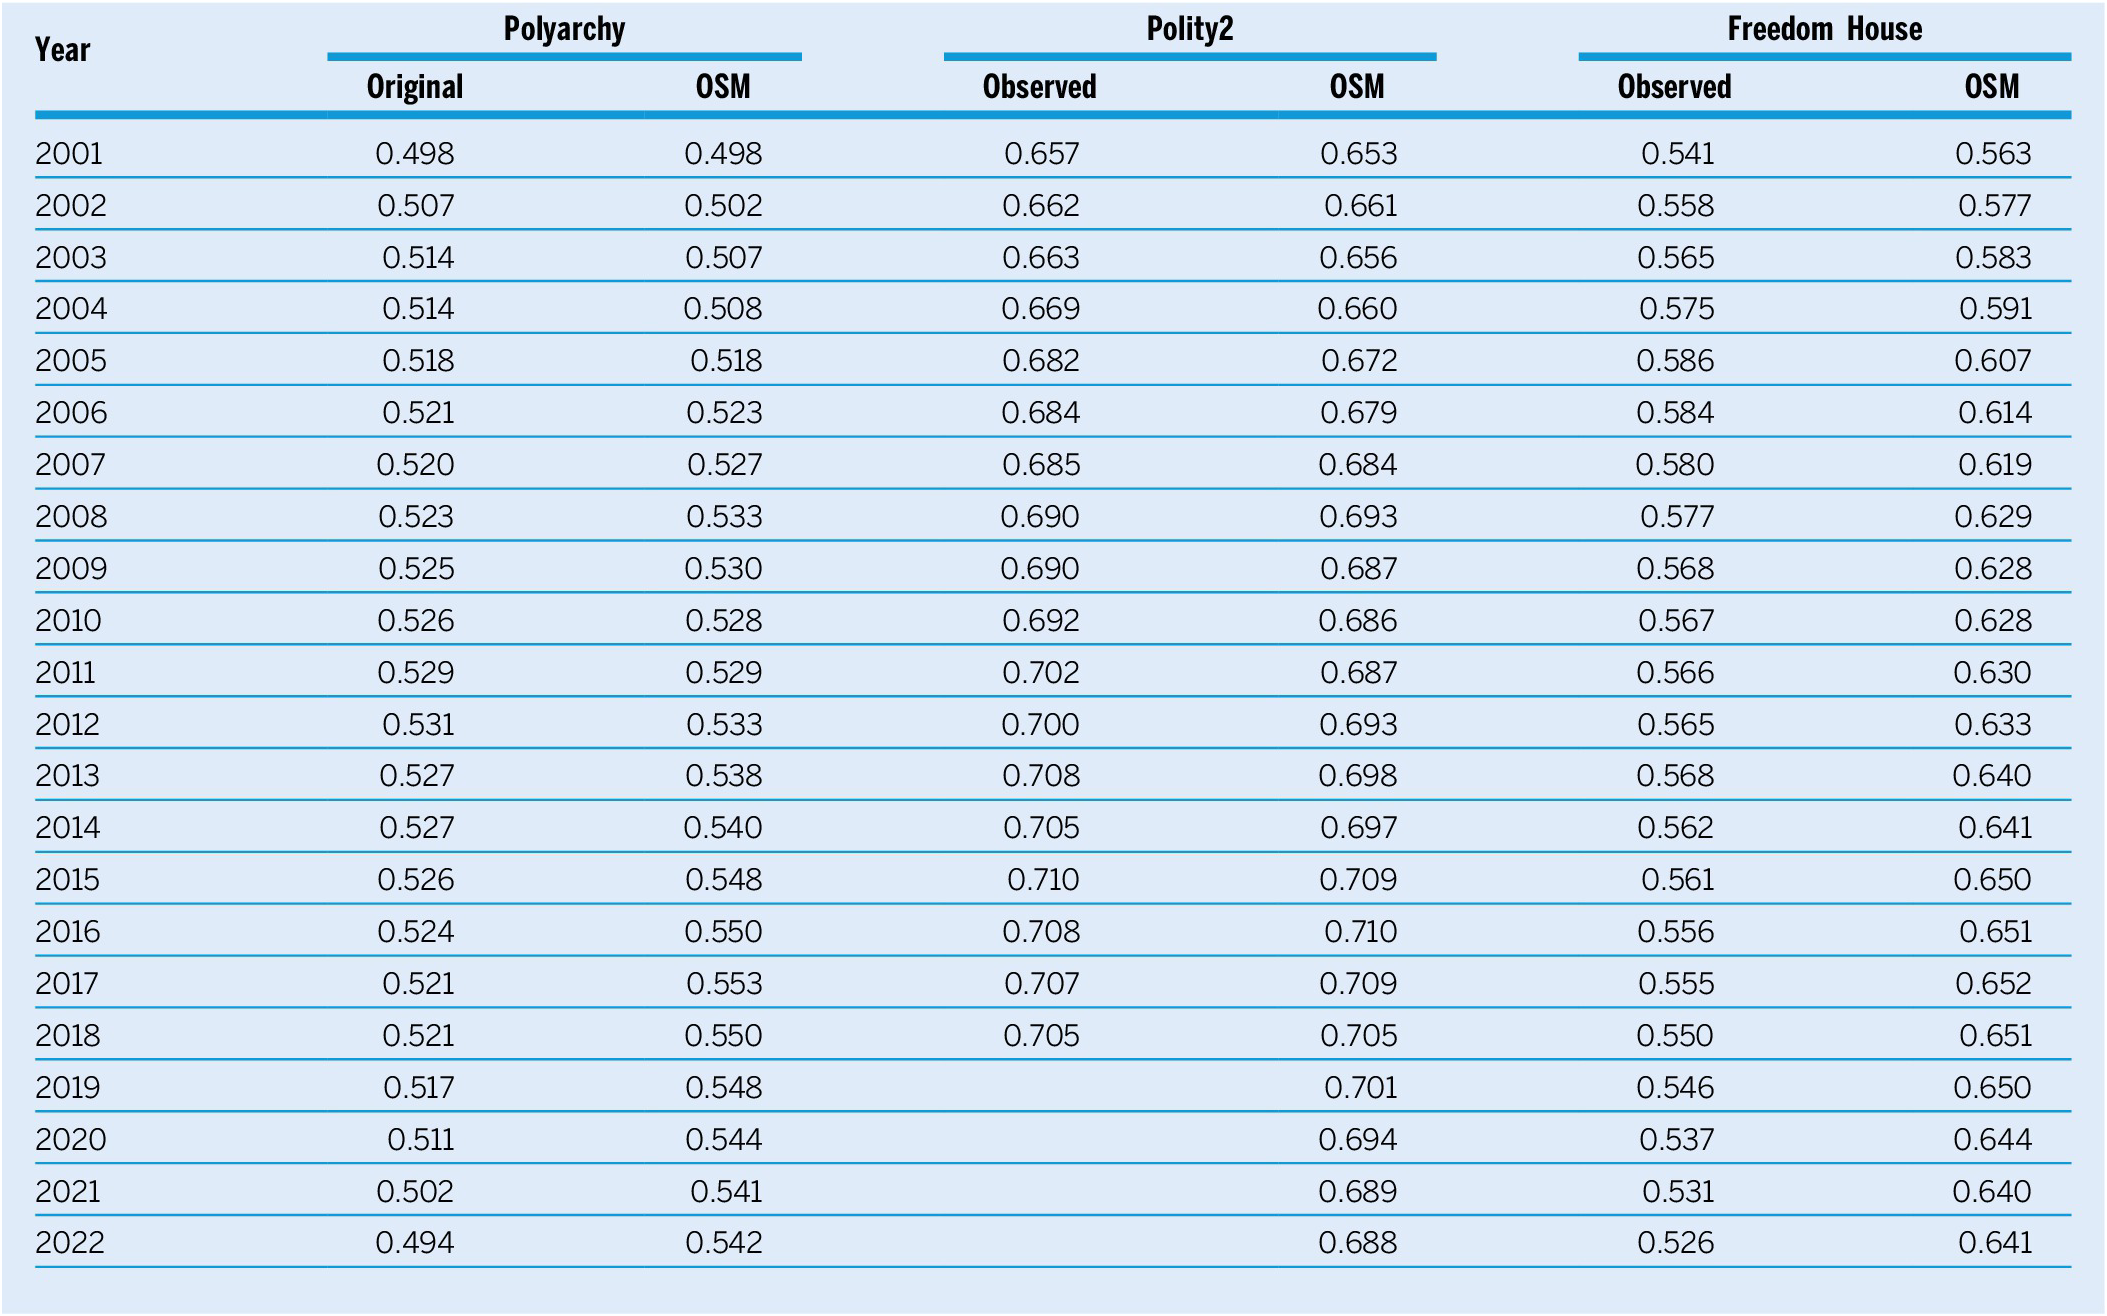
Note: Global means of three democracy indices (rescaled from 0 to 1) along with out-of-sample OSM predictions for those indices.
Evidence of a downturn in global democracy is found in Polyarchy (beginning in 2013) and OSM estimates of Polyarchy (beginning in 2018). However, we again emphasize the miniscule nature of these changes, especially for the OSM predictions, which do not surpass the confidence interval of prior point estimates.
Leaving global averages, we also can observe how particular cases performed during the backsliding period. Panel (b) in figure 2 focuses on changes registered for specific countries from 2000 to 2022. The Y axis shows the change in Polyarchy scores. A score higher than zero means that the country’s democracy score improved; a score less than zero means that it deteriorated. The X axis records the same information for OSM predictions.
Most countries are near the zero point, as shown by the density curves overlaid along the X and Y axes. Those countries that change scores are situated mostly along the diagonal, which demonstrates agreement between Polyarchy and OSM predictions. Several countries fall significantly below the diagonal, indicating that the OSM has a more optimistic view of their trajectory than Polyarchy. This includes Albania, Egypt, Fiji, Hungary, India, Malaysia, Pakistan, the Philippines, Thailand, and Turkey. These cases presumably account for the small divergence between the two indicators that is visible at the end of the time-series in panel (a) of figure 2 and in table 1. These case-rating divergences may reflect excess pessimism in recent Polyarchy ratings but also may reflect the tendency of changes in observable indicators of democracy to miss difficult-to-observe features available to experts.
Figure 3 repeats this exercise for Polity2. Panel (a) reveals an even closer alignment between the original index and OSM predictions than was observed for Polyarchy. Both curves show minor evidence of backsliding—beginning in 2016 for Polity2 and in 2017 for OSM predictions, as shown in table 1.
Polity2 and OSM Predictions
Panel (a): Polity2 (dark blue) and OSM predictions for Polity2 (orange) flanked by 95% confidence intervals from 1900 to 2018 (Polity2) and 2022 (OSM). Panel (b): the change in Polity2 scores (Y axis) against the change in OSM predictions (X axis) from 2000 to 2018, for which a positive value indicates an improved democracy score.
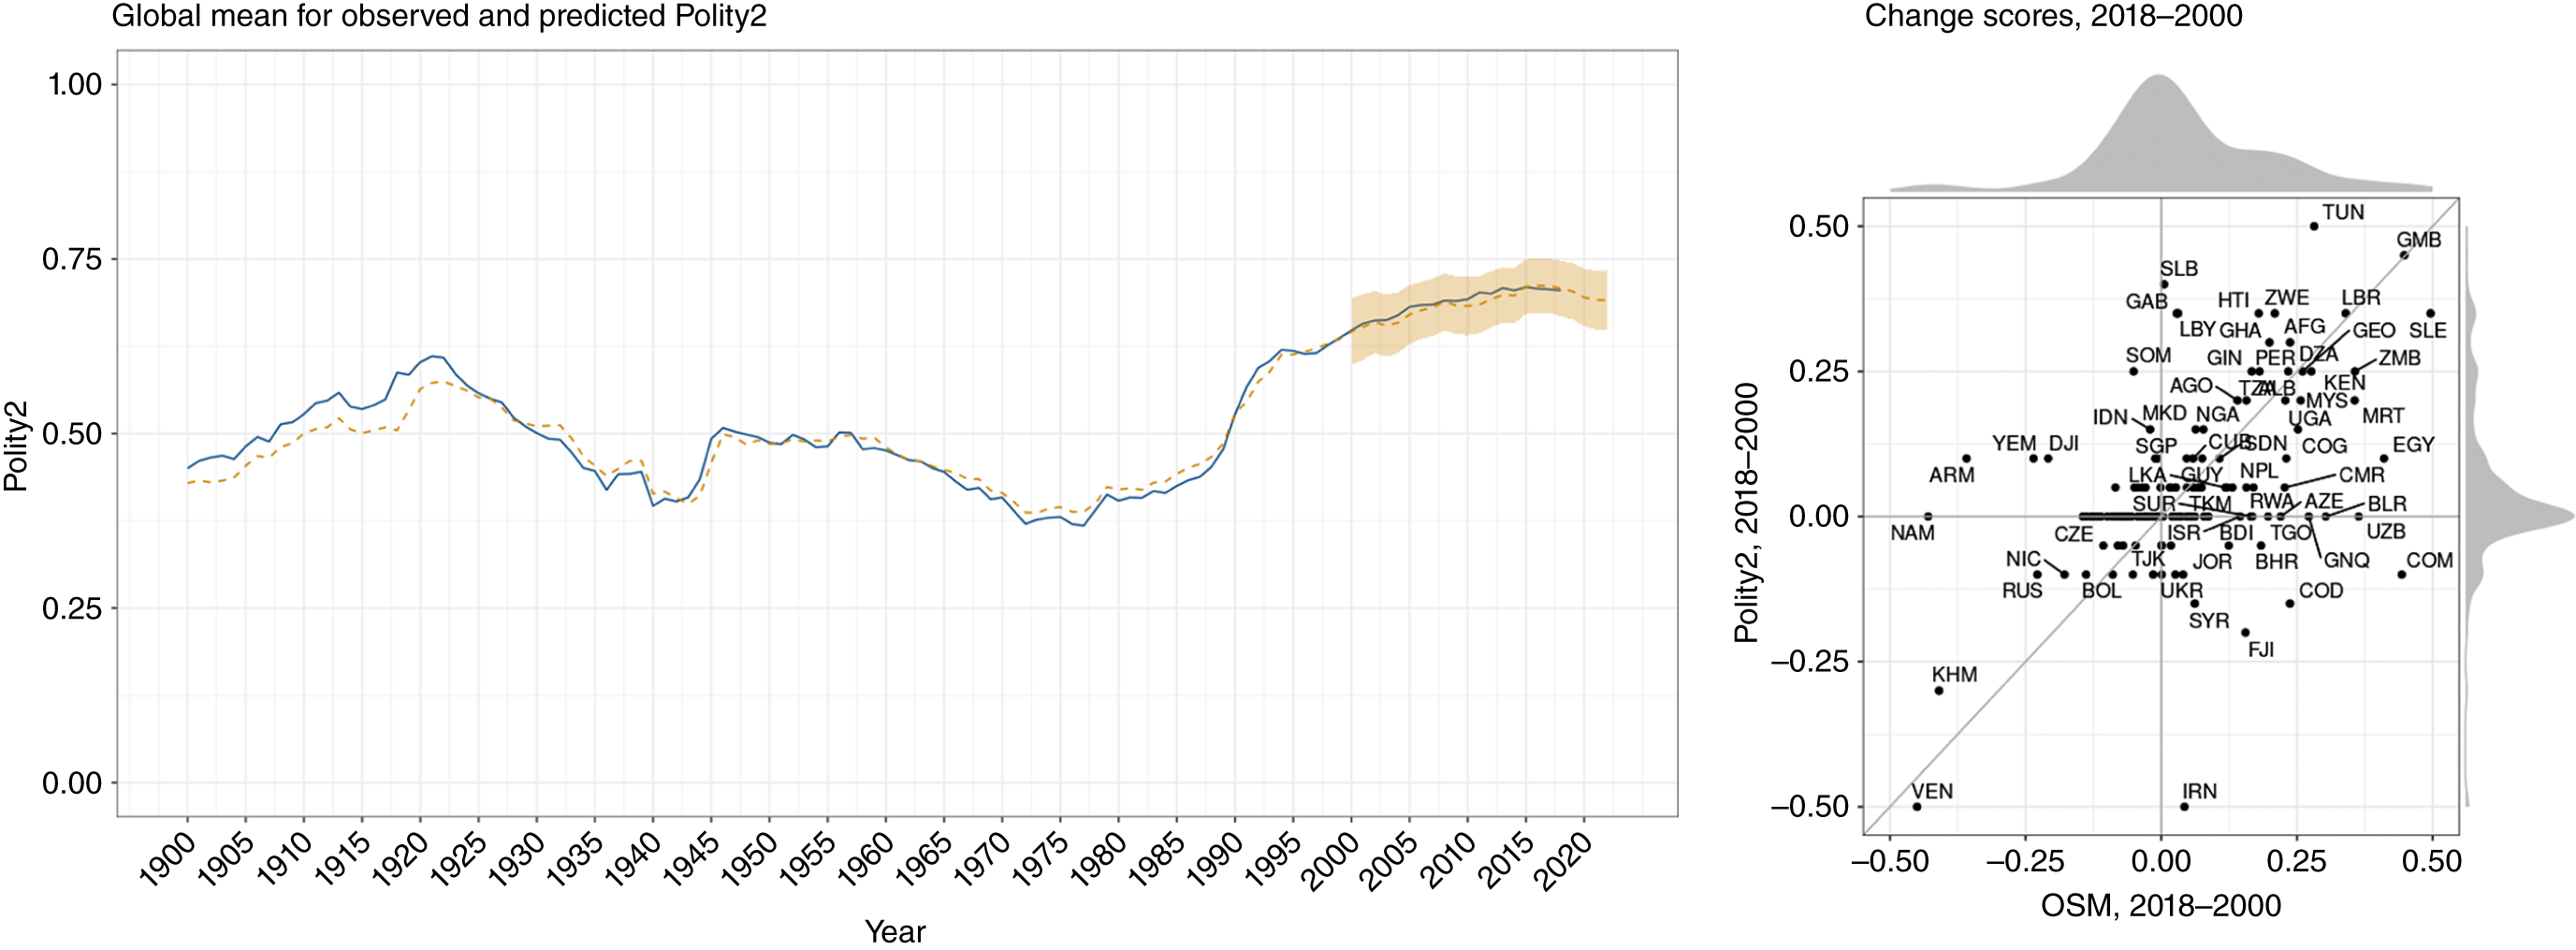
Panel (b) in figure 3 displays change scores from 2000 to 2018 for all 167 countries as assigned by Polity2 and OSM estimates. Again, most points are close to the center. In a few instances, the OSM provides different assessments. Polity2 is more pessimistic than the OSM about the twenty-first-century trajectories of Comoros, Democratic Republic of the Congo, Fiji, and Iran, for example.
Figure 4 completes the exercise, focusing on the Freedom House index. Panel (a) shows that Freedom House registers a fairly sharp downturn beginning in 2006. Meanwhile, the OSM predictions continue ascending through 2017, after which there is a modest downturn. Unlike for Polyarchy and Polity2, out-of-sample OSM predictions for Freedom House diverge dramatically, with recent observations falling well outside of the confidence intervals.
Freedom House and OSM Predictions
Panel (a): Freedom House (dark blue) and OSM predictions for Freedom House (orange) flanked by 95% confidence intervals from 1972 to 2022. Panel (b): the change in Freedom House scores (Y axis) against the change in OSM predictions (X axis) from 2000 to 2021, for which a positive value indicates an improved democracy score. The gap from 1981 to 1982 is a gap in Freedom House data collection.
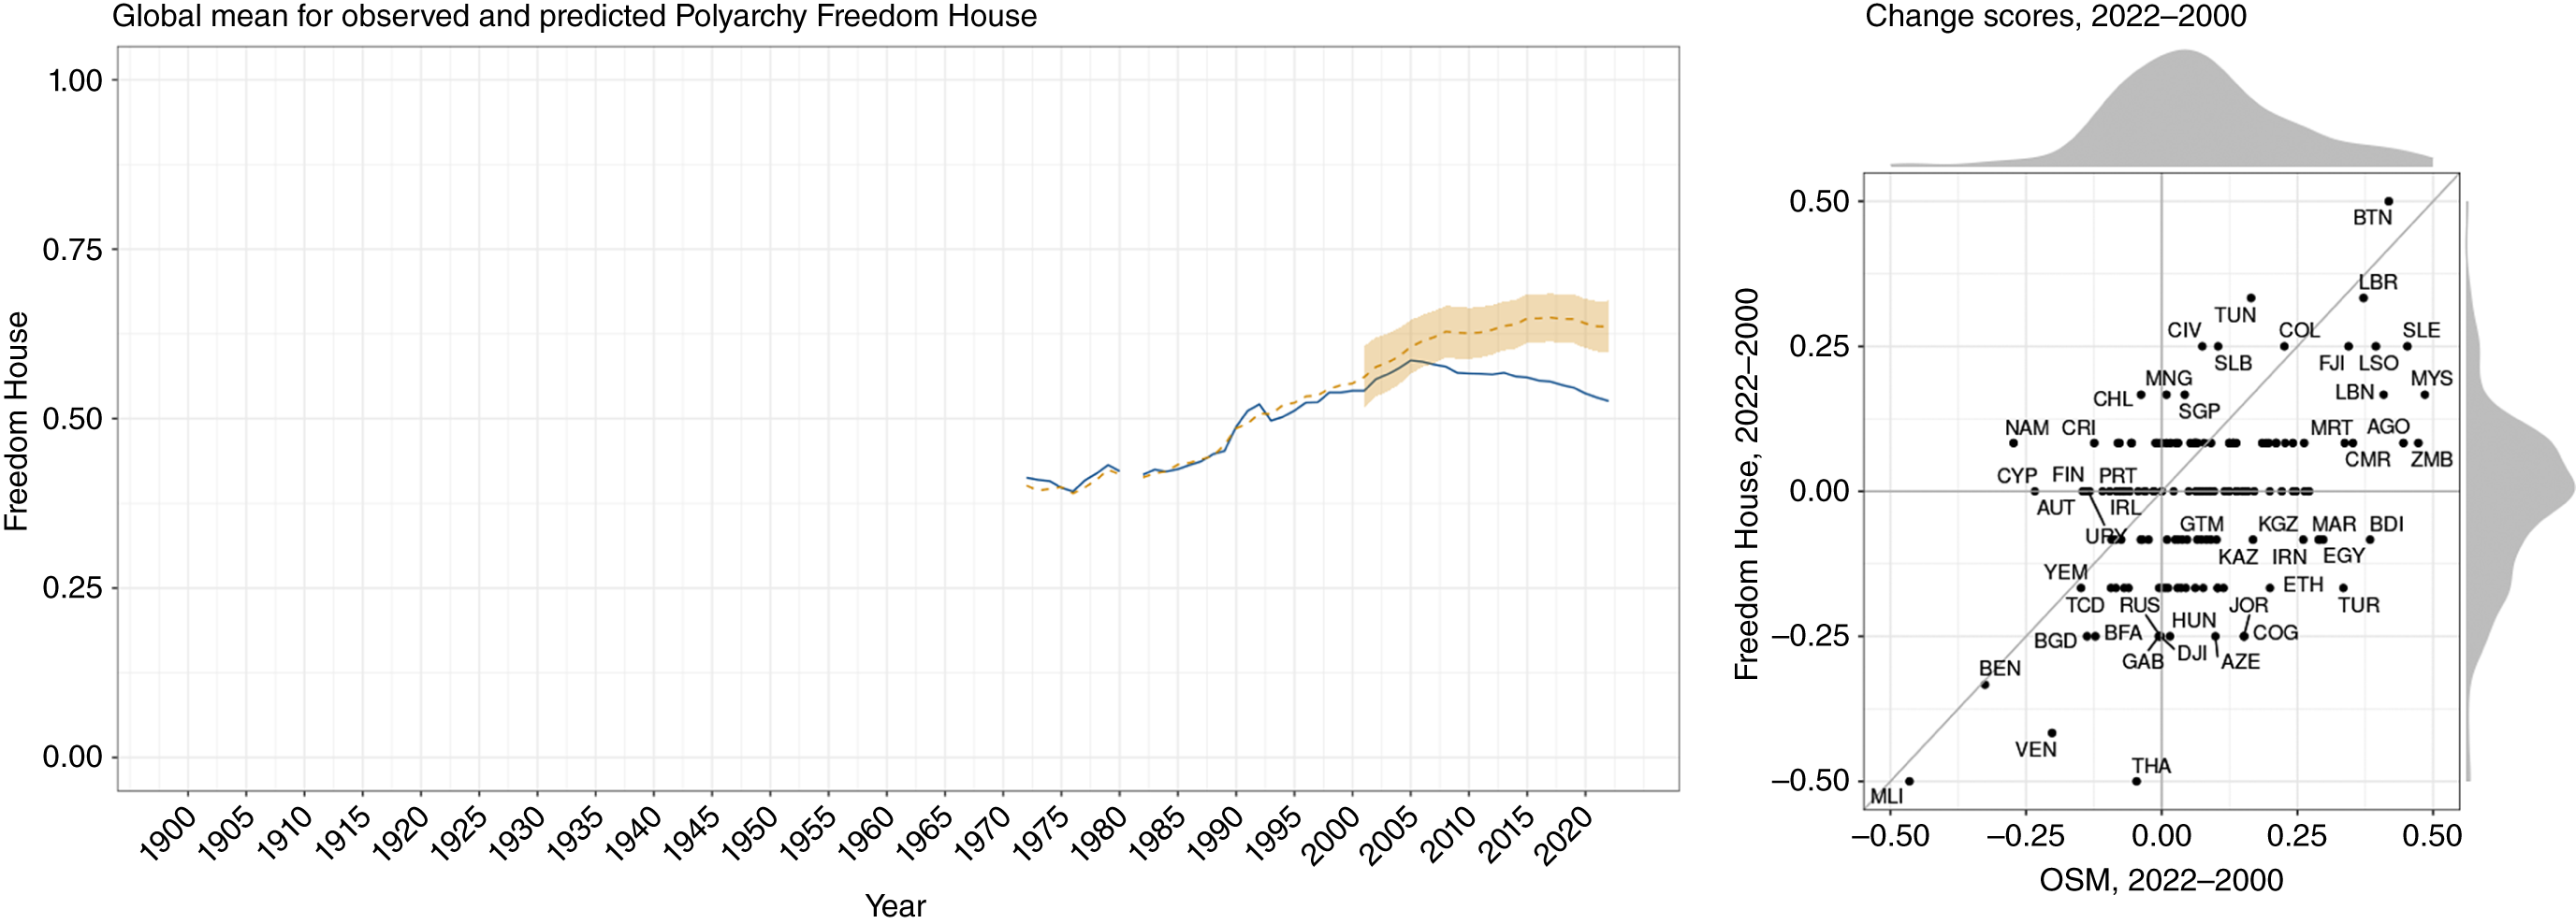
These divergences also are notable in panel (b) of figure 4, in which the OSM has a decidedly more optimistic view of regime changes in Turkey, the Republic of Congo, and Burundi and a more pessimistic view of developments in Costa Rica and Namibia.
We might regard the divergence between Freedom House and the OSM model as a failing of our modeling approach, especially because two features of the Freedom House index appear to complicate the task of making out-of-sample predictions beyond the observed time-series. First, the index is sluggish, registering few changes through time relative to Polyarchy and Polity2 (see table SI 10.3 in the online appendix). Second, because the Freedom House index begins in 1972, we do not have an extended sample on which to train the random forest model.
However, when the same sample restriction is imposed on Polyarchy and Polity2, we observe only a modest attenuation in alignment; therefore, the shortness of the sample cannot be the entire case. Moreover, results displayed in panel (a) of figure 4 show that the OSM is quite proficient in predicting the first several years of Freedom House, out of sample. Large differences appear only after 2005.
One explanation for the divergence between Freedom House and the OSM is that coding principles changed around the 2006 edition of Freedom House, leading to a fundamentally different data-generating process that the OSM model could not—and, by design, should not—replicate. Consequently, 2006 is the first year that Freedom House publicly released subcategory scores for its extensive questionnaire. At the same time, the number of coders (i.e., analysts) increased steeply (from 14 to 23), after which their number continued to grow, reaching a total of 128 for the 2023 report. Finally, the 2006 Freedom House edition introduced a rewording of several survey questions and the coding guidelines.
It is possible that one or more of these modifications account for the divergence between the ratings submitted by Freedom House and those predicted out of sample by the OSM. This interpretation apparently is corroborated by other democracy indices, such as Polyarchy and Polity2, in which global downturns do not appear until the second decade of the twenty-first century (see figure SI 9.1 in the online appendix).
ROBUSTNESS TESTS
Like any complex measurement exercises, there are many moving parts to this approach. Weitzel et al. (Reference Weitzel, Gerring, Pemstein and Skaaning2023a) discuss the robustness of OSMs with respect to the measurement of democracy. This current study focuses on issues bearing directly on out-of-sample predictions that are outside of the observed time-series.
A critical question concerns the cutoff point separating the training set from the out-of-sample test set. We chose 2000 for our benchmark OSM model because it falls well before the period usually identified as prone to backsliding. In additional tests, we set the cutoff at 2005 and 2010. The results displayed in online appendices SI 7 and SI 8 are almost identical to those generated from the benchmark cutoff (displayed in previous figures and tables). We conclude that the choice of cutoff dates had minimal influence on our findings.
A second issue concerns the selection of indicators for the OSM model. To test robustness, we excluded influential predictors (i.e., those with high-importance scores as shown in figure 1) seriatim. With each exclusion, the process outlined previously was repeated. Results of each iteration were close to those reported in the benchmark model (with the full set of 26 variables).
A third issue concerns the ability of the OSM model to predict out-of-sample observations beyond the observed time-series when a long-term trend changes (e.g., in a downward direction). The divergences appear at approximately the point where the Polyarchy and Freedom House trends turn downward.
We expected subtle changes in the quality of democracy to register in the OSM with a lag because most of our observable indicators were associated with elections. If the ruling party shuts down the main opposition press and doing so enhances the party’s vote in the next election, it will not be registered in the OSM model until that election year. However, the OSM should align with reality fairly quickly because elections occurred regularly in most of the cases in our sample during the twenty-first century. (In the event that elections are canceled or indefinitely postponed, this is registered by a change in coding for the electoral-regime variables and therefore should appear immediately in the OSM.)
To determine whether the OSM can track major changes in the level of global democracy before the twenty-first century, we conducted several tests in which the model was trained on a period when democracy’s ascent was highly trended. We then tested out-of-sample observations to see when that trend changes. We found that notable downward trends in the interwar period and in the 1970s reported by Polyarchy and Polity2 were well predicted by the model (see online appendices SI 12 and SI 13). This suggests that divergences in the twenty-first century are not the product of changes to the overall trend.
THE MISSING DATA PROBLEM
We also must consider an alternate explanation for the divergence between the OSM and Freedom House (and, to a lesser extent, Polyarchy). Perhaps the OSM model provides a more optimistic picture of global democracy in recent years because it does not capture features of regimes that are not directly observable and therefore are not included in our collection of indicators. Freedom of speech, for example, is notoriously difficult to measure with observable indicators and often is cited as a deficit in backsliding regimes.
For missing data to impair OSM estimates of the global trend, those missing features would have to become more prominent or more important (in determining regime type) over time, whereas measurable features of democracy remain constant.
Suppose that media outlets throughout the world experienced less independence after 2005 than they did so previously. If this were the only change in democracy during the twenty-first century, it might account for why Freedom House scores attenuated whereas OSM estimates of those scores—trained on data before 2000 and bereft of any direct measure of media independence—did not.
However, if the independence of the media were seriously compromised, we would expect this to impact observable features of the quality of democracy. In particular, restrictions on freedom of speech should boost the electoral performance of the incumbent party (registered in the election-related variables) or they would be accompanied by a formal proroguing of parliament and cessation of elections (registered in our electoral-regime variables). If violations of media independence are not correlated with these and other observable features of democracy, we may question how consequential those violations are. Perhaps citizens heavily discount the veracity of official channels and have access to alternate web-based news sources.
The logic of measuring democracy with observables is not based on the assumption that everything relevant to democracy is observable. Rather, it is based on the assumption that factors relevant to democracy are correlated with features that are observable.
Therefore, missing data of a subjective nature may explain the minor divergence between Polyarchy and the OSM estimates of Polyarchy that appears in the past decade (see figure 2). However, the missing data are unlikely to account for the much larger divergence between Freedom House and OSM estimates that appear after 2005 (see figure 4).
BACKSLIDING RECONSIDERED
This study assesses the veracity of recent claims of democratic backsliding using machine learning. We trained a random forest model—informed by observable indicators of democracy—on target data from three prominent composite indices of democracy during a period before the alleged backsliding. This OSM model issues predictions for the out-of-sample period, when backsliding is believed to have taken hold.
Applying this methodology, we found evidence of democratic backsliding using all three indices. However, the OSM estimates are not always in perfect accord with the original indices. OSM estimates of Polity2 closely follow the original index scores. OSM estimates of Polyarchy suggest that backsliding on a global scale may have begun later—and may be somewhat more modest—than is suggested by Polyarchy. However, uncertainty intervals around the OSM predictions contain almost all of the Polyarchy values, so we do not want to overinterpret minor differences toward the end of the time-series.
Applying this methodology, we found evidence of democratic backsliding using all three indices. However, the OSM estimates are not always in perfect accord with the original indices.
In the case of Freedom House, we found wide divergence between the original index and the OSM estimates. We hypothesized that this divergence is indicative of changes to the coding process in Freedom House, as discussed previously.Footnote 4
It is important to emphasize that a machine-learning approach does not assess validity; rather, it assesses consistency through time. If the data-generating process changes, this will produce divergence between OSM estimates and the original index. We might view Freedom House II (post-2005) as an improvement over Freedom House I (pre-2005), but we cannot determine this definitively. What we can suggest is that Freedom House is probably not a reliable instrument for measuring changes in democracy over time.
What should we conclude about global democratic backsliding? Our analysis provides support for a broad version of the Little and Meng hypothesis. Some indices, especially Freedom House, may be subject to time-specific measurement bias. At the very least, there is variability through time in how their assessments translate facts on the ground into measures of democracy.
At the same time, and in contrast to Little and Meng (Reference Little and Meng2023), we do find evidence of a slight global downturn in democracy since 2018 using only observable indicators trained on data from the pre-2000 period. In this respect, our exercise validates conventional wisdom.
We emphasize the slightness and shortness of this declension. Nevertheless, it is noteworthy that the advance of democracy that began two centuries ago, with only a few large-scale reversals, has halted. We conclude that perhaps stasis, rather than backsliding, should be the headline of this symposium.
DATA AVAILABILITY STATEMENT
Research documentation and data that support the findings of this study are openly available at the PS: Political Science & Politics Harvard Dataverse at https://doi.org/10.7910/DVN/RE0FZS.
Supplementary Material
To view supplementary material for this article, please visit http://doi.org/10.1017/S1049096523001075.
CONFLICTS OF INTEREST
The authors declare that there are no ethical issues or conflicts of interest in this research.


 Open access