

A typical Western diet is characterised by suboptimal Ca intake(Reference Henrix, Van Cauwenbergh and Robberrecht1–Reference Salamoun, Kizirian and Tannous5), excessive protein intake, and low intake of K-rich, bicarbonate-rich foods (i.e. fruits and vegetables)(Reference Lanham-New6). Several reports on the importance of adequate Ca intake for bone have been published(7–Reference Bischoff-Ferrari, Rees and Grau9). Ca inhibits parathyroid hormone (PTH) secretion and prevents bone resorption. Recently, interest in the significance of acid–base homeostasis in bone health has grown(Reference Lanham-New6). An imbalance between intakes of protein and K-rich, bicarbonate-rich foods results in chronic, low-grade metabolic acidosis due to non-carbonic acids being metabolised from sulfuric amino acids. Studies related to metabolic acidosis have shown that a small reduction in extracellular pH leads to increased osteoclastic activity, indicating an increase in bone resorption(Reference Bushinsky10). K and organic anions are metabolised to alkaline compounds, hence, neutralising the acid load caused by a high protein intake(Reference Demigné, Sabboh and Rémésy11). An increase in both Ca and K in the Western diet is likely to have a beneficial effect on bone through different mechanisms.
Potential ways to increase Ca intake are the use of Ca supplements and fortification of foods. Calcium carbonate and calcium citrate are the most common forms of Ca supplementation(Reference Heaney, Dowell and Barger-Lux12). Unlike calcium carbonate, calcium citrate provides an alkaline load in addition to Ca since the citrate anion is metabolised to bicarbonate. Calcium citrate may also be absorbed better than calcium carbonate, as shown in fasting individuals(Reference Hanzlik, Fowler and Fisher13, Reference Recker14) and in patients suffering from gastric achlorhydria(Reference Recker14), but also in healthy postmenopausal women when taken with a meal(Reference Heller, Greer and Haynes15). However, some studies have found no difference in absorbability between calcium carbonate and calcium citrate(Reference Heaney, Dowell and Barger-Lux12, Reference Heaney, Dowell and Bierman16). Based on a 12-week cross-over study with postmenopausal women, calcium citrate may inhibit bone resorption more efficiently than calcium carbonate, despite similar decreases in serum PTH with both Ca preparations(Reference Kenny, Prestwood and Biskup17).
Potassium bicarbonate administration reduces urinary Ca excretion(Reference Lemann, Gray and Pleuss18). Supplementation with potassium citrate or potassium bicarbonate has also been observed to reduce markers of bone resorption(Reference Marangella, Di Stefano and Casalis19–Reference Sebastian, Harris and Ottaway21) and increase bone mineral density(Reference Jehle, Zanetti and Muser20) in postmenopausal women with low bone density. According to Jehle et al. (Reference Jehle, Zanetti and Muser20) this effect is independent of reported skeletal effects of K. Combined treatment with potassium citrate and calcium citrate inhibits bone resorption and increases Ca absorption relative to either placebo or calcium citrate or potassium citrate treatment alone(Reference Sakhaee, Maalouf and Abrams22). In cross-sectional studies, an association between better bone health and fruit and vegetable consumption – an index of higher intake of K and bicarbonate – has been observed(Reference Prynne, Mishra and O'Connell23–Reference New, Robins and Campbell25).
Whether the positive effect of an alkali administration persists with moderate protein consumption is unknown(Reference Wood26). It is also unclear whether an alkali load has a beneficial impact on bone when the diet is not acidogenic. Further, calcium carbonate and calcium citrate may have different effects on Ca and bone metabolism. In the present short-term intervention study, we compared the effects of calcium carbonate with those of calcium citrate, and examined the influence of the citrate salts potassium citrate and calcium citrate on markers of Ca and bone metabolism in healthy young women.
Subjects and methods
Twelve healthy female volunteers aged 20–30 years participated in four separate 24 h sessions, with each subject serving as her own control. The sessions were attended at intervals of 7 d. Subjects had no medications or illnesses known to affect Ca or bone metabolism. Eight of the subjects used oral contraceptives. The basic characteristics of participants are shown in Table 1. Before coming to the research unit, the subjects fasted overnight.
(Mean values and ranges)
Subjects received a single dose of calcium carbonate, calcium citrate or potassium citrate mixed in a berry jelly with their breakfast. Calcium carbonate and calcium citrate doses contained 1000 mg Ca. Calcium citrate and potassium citrate supplements contained equal amounts, 3145 mg, of citrate. Potassium citrate doses contained 2250 mg K. The intakes of selected nutrients during the study sessions are presented in Table 2. The order of the sessions was randomised.
Dietary intakes of selected nutrients from meals during the study sessions

The meals served during each study session were identical, providing 300 mg Ca, 800 mg P, and 3300 mg K per d, by calculation. No additional meals or snacks were allowed, but tap water was provided ad libitum. Meals were served at 08.00, 12.00, 14.00, 16.00 and 20.00 hours. For estimation of habitual Ca, P and energy intakes, the volunteers kept a 4 d food record before the beginning of the experiment.
The present study was conducted according to the guidelines laid down in the Declaration of Helsinki and all procedures involving human subjects were approved by the Committee of the Department of Public Health and Epidemiology in the hospital district of Helsinki and Uusimaa. Written informed consent was obtained from all subjects.
Sampling
Blood samples were taken anaerobically at 08.00, 10.00, 12.00 and 16.00 hours, and again at 08.00 hours on the following morning. Blood samples were taken immediately before meals. Serum was separated from blood and stored at − 20°C until analysed. The 24 h urine collections were obtained from 08.00 hours on the study day to 08.00 hours the following morning.
Laboratory methods
Serum ionised Ca (S-iCa) and K concentrations were analysed from anaerobically handled serum samples with an ion selective analyser (Microlyte 6; Thermo Electron, Vantaa, Finland) within 90 min of sample collection. The intra-assay CV for S-iCa was 1·6 %. In the other measurements, all samples from the same individual were analysed in the same assay in a randomised order. Serum phosphate and creatinine concentrations and excretions of urinary Ca, phosphate and creatinine were measured spectrometrically with an autoanalyser (Konelab 20; Thermo Electron). The intra- and inter-assay CV of these analyses were 1·7 and 2·4 %, respectively. Serum intact PTH concentration was measured by an immunoenzymometric assay using Octeia® Intact PTH Kits (Immunodiagnostic Systems Limited, Boldon Colliery, Tyne and Wear, UK). The intra- and inter-assay CV were 2·9 and 5·1 %, respectively. Serum bone-specific alkaline phosphatase concentration was determined by an enzyme immunoassay (Metra™ BAP EIA Kit; Quidel Corp., San Diego, CA, USA). Intra- and inter-assay CV were 4·4 and 10·4 %, respectively. The excretion of urinary N-terminal telopeptide of type I collagen (NTx) was analysed by an ELISA using Osteomark® NTx Test Kits (Ostex International, Inc., Seattle, WA, USA). The intra- and inter-assay CV were 4·3 and 6·9 %, respectively.
Statistical analysis
Data were expressed as mean values with their standard errors. For serum variables, the area under the curve for the difference from the morning fasting value was calculated. To exclude the effect of the first fasting sample, the Δ values of the 0 h sample to the 24 h sample were used in the analyses. The results of urinary Ca, urinary phosphate and urinary NTx were corrected for urinary creatinine excretion before statistical analyses. Non-normal distributions were normalised by logarithmic transformations. ANOVA with repeated measures was used to compare the study sessions. If the sphericity assumption was violated, a Huynh–Feldt adjustment was applied. Contrast analysis was used for pairwise comparisons between the study sessions. Analyses were conducted with the SPSS 12.0 statistical package (SPSS Inc., Chicago, IL, USA) in a Windows environment. We regarded P < 0·10 as a trend and P < 0·05 as a statistically significant difference.
Results
Serum ionised calcium
The S-iCa concentrations differed between the study sessions (P = 0·0001; ANOVA) (Fig. 1). Both calcium carbonate (P = 0·001) and calcium citrate (P = 0·0001) increased S-iCa concentration as compared with the control session. The difference in S-iCa between the calcium carbonate and calcium citrate sessions was not significant (P = 0·300). Potassium citrate had no effect on S-iCa concentration relative to the control session (P = 0·337).
(a) Changes in serum ionised Ca (S-iCa) concentration during the four study sessions: control (□); calcium citrate (▲); calcium carbonate (*); potassium citrate (●). ↑ , Supplement administration time. (b) 24 h Urinary excretion of Ca (urinary Ca:creatinine ratio; U-Ca:Crea) during the four study sessions. Values are means, with their standard errors represented by vertical bars. The supplements affected area under the curve values of S-iCa (P = 0·0001; ANOVA) and 24 h U-Ca:Crea (P = 0·0001; ANOVA). † Mean value was significantly different from that of the control session (P < 0·05). ‡ Mean value was significantly different from that of the potassium citrate session (P < 0·05).

Urinary calcium
Differences were found in urinary Ca excretion between the study sessions (P = 0·0001; ANOVA) (Fig. 1). Urinary Ca excretion was higher during the calcium carbonate (P = 0·0001) and calcium citrate (P = 0·0001) sessions, but lower during the potassium citrate (P = 0·004) session than during the control session. During both Ca supplement sessions, urinary Ca excretion was also higher than in the potassium citrate session (P = 0·0001). Urinary Ca excretions did not differ between the calcium carbonate and calcium citrate sessions (P = 0·173).
Serum phosphate and urinary phosphate
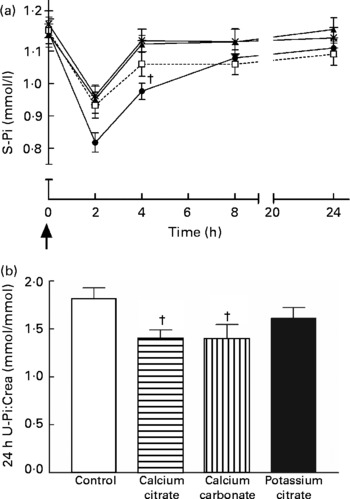
Serum phosphate concentrations differed between the study sessions (P = 0·0001; ANOVA) (Fig. 2). Calcium citrate (P = 0·050) and calcium carbonate (P = 0·071) tended to increase serum phosphate compared with the control session. Potassium citrate decreased the serum phosphate concentration (P = 0·012). Urinary phosphate excretions also differed between the study sessions (P = 0·003; ANOVA) (Fig. 2). Calcium citrate (P = 0·001) and calcium carbonate (P = 0·002) decreased urinary phosphate relative to the control session. In addition, calcium citrate tended to decrease urinary phosphate compared with the potassium citrate session (P = 0·077). The difference between the control and potassium citrate sessions was not significant (P = 0·131).
(a) Changes in serum phosphate (S-Pi) concentration during the four study sessions: control (□); calcium citrate (▲); calcium carbonate (*); potassium citrate (●). ↑ , Supplement administration time. (b) 24 h Urinary excretion of Pi (urinary Pi:creatinine ratio; U-Pi:Crea) during the four study sessions. Values are means, with their standard errors represented by vertical bars. The supplements affected area under the curve values of S-Pi (P = 0·0001; ANOVA) and 24 h U-Pi:Crea (P = 0·003; ANOVA). † Mean value was significantly different from that of the control session (P < 0·05).
Serum potassium
The area under the curve values of serum K tended to differ between the study sessions, but did not reach statistical significance (P = 0·068; ANOVA) (Fig. 3). However, when comparing the serum K results at 10.00 hours (2 h after ingesting the supplements or the placebo), differences were observed (P = 0·001; ANOVA). At the same point, serum K was higher at 10.00 hours in the potassium citrate session than in the control (P = 0·016), calcium citrate (P = 0·007) or calcium carbonate (P = 0·001) sessions. At other sampling times, serum K values did not differ.
(a) Changes in serum K concentration during the four study sessions: control (□); calcium citrate (▲); calcium carbonate (*); potassium citrate (●). ↑ , Supplement administration time. (b) 24 h Urinary pH during the four study sessions. Values are means, with their standard errors represented by vertical bars. The supplements tended to affect area under the curve values of serum K (P = 0·068; ANOVA) and affected urinary pH (P = 0·0001; ANOVA). † Mean value was significantly different from that of the control session (P < 0·05). § Mean value was significantly different from those of all the other sessions (P < 0·05).

Urinary pH
The supplements affected urinary pH (P = 0·0001; ANOVA) (Fig. 3). Urinary pH was greater in the potassium citrate session than in all other sessions (P = 0·0001). Moreover, in the calcium citrate session, urinary pH was higher than in the control session (P = 0·049). No difference was observed in urinary pH values between the calcium carbonate and control sessions (P = 0·214).
Serum parathyroid hormone
Differences were present in serum PTH concentrations between the study sessions (P = 0·002; ANOVA) (Fig. 4). Serum PTH decreased in the calcium citrate (P = 0·006) and calcium carbonate (P = 0·029) sessions relative to the control session. Serum PTH also decreased in the calcium citrate (P = 0·005) and calcium carbonate (P = 0·015) sessions relative to the potassium citrate session. No difference existed between the potassium citrate and control sessions in serum PTH concentrations (P = 0·803).
Changes in serum parathyroid hormone (S-PTH) concentration from the morning fasting value during the four study sessions: control (□); calcium citrate (▲); calcium carbonate (*); potassium citrate (●). ↑ , Supplement administration time. Values are means, with their standard errors represented by vertical bars. The supplements affected area under the curve values of S-PTH (P = 0·002; ANOVA). † Mean value was significantly different from that of the control session (P < 0·05). ‡ Mean value was significantly different from that of the potassium citrate session (P < 0·05).

Serum bone-specific alkaline phosphatase
No differences were found in serum bone-specific alkaline phosphatase concentrations during the study sessions (P = 0·198; ANOVA) (Fig. 5 (a)).
(a) Changes in serum bone-specific alkaline phosphatase (S-BALP) activity during the four study sessions: control (□); calcium citrate (▲); calcium carbonate (*); potassium citrate (●). ↑ , Supplement administration time. (b) 24 h Urinary excretion of N-terminal telopeptide of type I collagen (U-NTx:creatinine ratio; U-NTx:Crea) during the four study sessions. BCE, bone collagen equivalents. Values are means, with their standard errors represented by vertical bars. The supplements did not affect the area under the curve values of S-BALP (P = 0·198; ANOVA), but affected 24 h U-NTx:Crea (P = 0·027; ANOVA). † Mean value was significantly different from that of the control session (P < 0·05).

Urinary N-terminal telopeptide of type I collagen
Urinary excretion of NTx differed between the study sessions (P = 0·027; ANOVA) (Fig. 5 (b)). Urinary NTx decreased in the potassium citrate session (P = 0·017) and calcium carbonate (P = 0·045) sessions compared with the control session. The difference in urinary NTx between the calcium citrate and control sessions was not significant (P = 0·112). The results relative to the control session are summarised in Table 3.
Summary of the results relative to the control session

PTH, parathyroid hormone; BALP, bone-specific alkaline phosphatase; NTx, N-terminal telopeptide of type I collagen; –, no significance; ↓ , decrease; ↑ , increase.
* 0·05 < P < 0·1.
Discussion
The present results showed that a single, moderate dose of potassium citrate had a more positive effect on bone resorption than calcium citrate. Potassium citrate decreased Ca excretion and reduced bone resorption acutely in healthy premenopausal women in an experimental setting with a moderate protein intake. Furthermore, potassium citrate had no effect on serum PTH concentration, but affected phosphate metabolism by decreasing serum phosphate. Ca supplements decreased bone resorption, although the difference relative to the control session was significant only with calcium carbonate. Both Ca supplements also reduced serum PTH concentration equally efficiently. No significant differences were found between the calcium citrate and calcium carbonate sessions. In addition, none of the supplements affected the marker of bone formation (bone-specific alkaline phosphatase).
We first discuss the potassium citrate session and its results. The potential renal acid load of the test diet was low (–27 mEq/d), as calculated by using the algorithm of Remer et al. (Reference Remer, Dimitriou and Manz27), i.e. the test diet was alkalising rather than acidogenic. However, to our knowledge, the effect of an extra alkali load on an alkalising diet was not previously known. The low potential renal acid load value was due to moderate protein and P intakes. We kept P intake at the recommended level to avoid a possible effect of high P intake on serum PTH(Reference Kemi, Kärkkäinen and Lamberg-Allardt28). Because high-P foods are also high in protein, we could not use large amounts of protein-rich foods. Hence, protein intake during study sessions was 48·4 g/d. The subjects' average protein intake/kg body weight during study sessions was normal, 0·8 g/kg on average. The K supplement increased the alkaline load of the study diet relative to all other sessions, as indicated also by increased urinary pH. As citrate intakes during the potassium citrate and calcium citrate sessions were identical, the results for urinary pH suggest that potassium citrate provides a larger alkali load than calcium citrate, i.e. K per se has an alkalising effect, or that more citrate was absorbed from potassium citrate than from calcium citrate.
Dietary K intake (3·3 g) was at the level recommended by the Nordic nutritional recommendations(Reference Becker, Lyhne and Pedersen29). In dietary reference intakes, the adequate intake of K for adults is higher, 4·7 g(30). During the potassium citrate session, the total K intake (diet+supplement) was 5·55 g. The amount of K supplemented in the present study was smaller than in previous interventions(Reference Marangella, Di Stefano and Casalis19–Reference Sakhaee, Maalouf and Abrams22), suggesting that 2·25 g K is sufficient to increase Ca retention and affect bone resorption. We cannot distinguish whether this effect was due to higher K intake or an increase in dietary alkali load. It is unclear whether the positive effect of K anions on bone metabolism is due to an increased intake of K or buffering through the generation of bicarbonate(Reference Lanham-New6). By including another K supplement, without an alkalising anion (i.e. potassium chloride) in the present study, we would have more specific data on this issue. The skeletal benefit of dietary K has been speculated to be dependent on the accompanying bicarbonate-generating anion(Reference Rafferty and Heaney31).
Previous studies have shown that alkali substances affect Ca and bone metabolism through four separate mechanisms: by enhancing reabsorption of Ca in the kidneys(Reference Sebastian, Harris and Ottaway21, Reference Sakhaee, Alpern and Jacobson32), by enhancing Ca absorption in the intestine, as shown among patients with distal renal tubular acidosis(Reference Preminger, Sakhaee and Pak33), by inhibiting osteoclastic bone resorption(Reference Bushinsky34), and by stimulating osteoblastic bone formation(Reference Sebastian, Harris and Ottaway21, Reference Bushinsky34). Similarly, neutralisation of dietary acid load without an increase in K intake decreases urinary Ca excretion(Reference Jehle, Zanetti and Muser20, Reference Buclin, Cosma and Appenzeller35, Reference Maurer, Riesen and Muser36).
The decrease in bone resorption during the potassium citrate session is consistent with previous longer-term intervention studies. A decrease in bone resorption due to potassium citrate(Reference Marangella, Di Stefano and Casalis19, Reference Jehle, Zanetti and Muser20) and potassium bicarbonate(Reference Sebastian, Harris and Ottaway21) supplementation has been observed in postmenopausal women. Potassium citrate has also been shown to prevent increased bone resorption, as measured by urinary NTx excretion caused by high salt intake in postmenopausal women(Reference Sellmeyer, Schloetter and Sebastian37). In a cross-sectional study, bone resorption markers were significantly greater in the lowest quartile of K intake than in the other quartiles(Reference Macdonald, New and Fraser24). By contrast, in a recent 2-year trial, potassium citrate supplementation did not affect bone turnover(Reference Macdonald, Black and Aucott38).
Based on in vitro studies, a reduction of extracellular pH increases osteoclastic activity independent of the effect of PTH(Reference Arnett and Dempster39). In the present study, the alkaline load was largest during the potassium citrate session, which probably caused the largest increase in extracellular pH, and a further decrease in osteoclastic activity relative to other sessions.
To elaborate on the PTH results during the potassium citrate session, as in previous interventions(Reference Marangella, Di Stefano and Casalis19, Reference Jehle, Zanetti and Muser20, Reference Sakhaee, Maalouf and Abrams22, Reference Sellmeyer, Schloetter and Sebastian37), potassium citrate had no effect on serum PTH. Possibly, the increase in Ca retention due to potassium citrate was insufficient to produce a decrease in PTH secretion, despite the frequent sampling. Interestingly, a decrease in urinary NTx was seen regardless of low Ca intake (300 mg). S-iCa remained at the same level during the control and potassium citrate sessions, suggesting that potassium citrate did not increase Ca absorption. Based on these results, the direct effect of potassium citrate on osteoclasts can be speculated to be stronger and/or more rapid than its effect on bone through Ca metabolism. Furthermore, as the decrease in urinary NTx was notable, albeit not statistically significant, during the potassium citrate session relative to the Ca supplement sessions, this could imply that potassium citrate reduced bone resorption more rapidly than Ca.
Potassium citrate did not affect the bone formation marker (bone-specific alkaline phosphatase) used here. This may be due to the short duration of the study. Longer administration of K alkali has resulted in an increase in serum osteocalcin concentration(Reference Marangella, Di Stefano and Casalis19, Reference Sebastian, Harris and Ottaway21). In the 12-month study of Jehle et al. (Reference Jehle, Zanetti and Muser20), serum bone-specific alkaline phosphatase increased but serum osteocalcin decreased in both the potassium citrate and potassium chloride groups.
Relative to the control session, serum phosphate decreased during the potassium citrate session. The reason for this is unknown, as dietary P intake was exactly the same in all sessions, and P intake was at the recommended level(Reference Becker, Lyhne and Pedersen29). Due to the decrease in bone resorption, which was a consequence of the increased extracellular pH, a decrease in the release of P from bone probably also occurred. This may partly explain the decrease in serum phosphate. Urinary phosphate:creatinine ratio was not significantly lower during the potassium citrate session than during the control session. Possibly due to the short duration of the study or the limited number of the subjects, we could not detect a decrease in the urinary phosphate excretion. In longer-term studies, K administration has resulted in a decrease in urinary phosphate excretion(Reference Jehle, Zanetti and Muser20, Reference Sebastian, Harris and Ottaway21).
In examining the effects of Ca supplements, both calcium citrate and calcium carbonate supplements were absorbed well, based on S-iCa, and decreased serum PTH efficiently. Calcium carbonate decreased urinary NTx relative to the control session, but during the calcium citrate session the decrease in urinary NTx relative to the control session did not reach statistical significance. However, because no difference in serum PTH between Ca supplement sessions was found, the small difference in urinary NTx between these sessions was probably coincidental. The present results on serum PTH and urinary NTx are contrary to those recently published by Thomas et al. (Reference Thomas, Need and Tucker40) who found half the dose of calcium citrate to be at least as effective as calcium carbonate in suppressing PTH and C-terminal telopeptide, another marker of bone resorption, in postmenopausal women. The reason for the discrepant results may be in timing of the samples or in the different age group of subjects. However, not all previous studies support calcium citrate as being better absorbed than calcium carbonate(Reference Heaney, Dowell and Barger-Lux12, Reference Heaney, Dowell and Bierman16). The present results indicate that both Ca supplements when taken with a meal are as effective in healthy premenopausal women. The present results support the use of the most common and least expensive form of Ca, calcium carbonate, in this age group. Based on the study of Sakhaee et al. (Reference Sakhaee, Maalouf and Abrams22), combined treatment with potassium citrate and calcium citrate probably delivers the best result.
To conclude, potassium citrate supplementation, at least acutely, may decrease urinary Ca excretion and reduce bone resorption even when the diet is not acidogenic, Ca intake is low, and K intake is at recommended level. Furthermore, calcium citrate and calcium carbonate are absorbed effectively and suppress PTH equally well in healthy premenopausal women. The present results await confirmation in a longer-term setting.
Acknowledgements
The present study was funded by the National Technology Agency of Finland (TEKES), the Finnish Cultural Foundation, and the Juho Vainio Foundation. We thank all volunteers for their participation.
All authors took part in designing the study.
M. E. K. recruited the study subjects and conducted the experimental work. H. J. K. and M. E. K. did the laboratory and statistical analyses. H. J. K. wrote the manuscript, and C. J. E. L.-A. and M. E. K. participated in the critical revision of the paper. C. J. E. L.-A. was the principal investigator supervising the study.
None of the authors have conflicts of interest.


