


Weight loss results from an energy deficit, although the quality of food choices making up the diet may also be important( Reference Webber and Lee 1 , Reference Nazare, Smith and Borel 2 ). In examining this idea, an observational cohort study of 4-year weight change has found that weight gain was most strongly associated with intakes of meat (processed and unprocessed), potatoes, potato chips and sugar-sweetened beverages and inversely associated with free vegetables, fruit, whole-grain foods, nuts and yogurt( Reference Mozaffarian, Hao and Rimm 3 ). This study has provided some suggestion of specific foods of interest in weight loss. The recognition that we ‘eat foods, not nutrients’ sounds simplistic( Reference Jacques and Tucker 4 ), but it signals a paradigm shift from focusing on nutrient composition to food composition of the whole diet, embracing the concept of food synergy( Reference Patterson, Haines and Popkin 5 – Reference Jacobs, Tapsell and Temple 11 ). Encompassing this concept, diet quality tools have emerged in epidemiological research, moving the focus from single nutrients to a whole-diet-based perspective in relation to disease( Reference Freeland-Graves and Nitzke 12 ), and research now focusing entirely on the macronutrient proportions of the diet may be of limited value( Reference Fogelholm, Anderssen and Gunnarsdottir 13 ). The definition of diet quality used in constructing a tool depends on the attributes selected by the researcher( Reference Kant 14 ). In a review, Reul( Reference Reul 15 ) found no official definition of dietary quality, yet the concept of quality of energy is gaining support at the research level( Reference Ebbeling, Swain and Feldman 16 ). Historically, dietary quality referred to nutrient adequacy, and implied that the diet met requirements for essential nutrients within energy requirements( Reference Reul 15 ). In the management of chronic conditions such as obesity( Reference Wirt and Collins 17 ) and the metabolic syndrome( Reference Eckel, Grundy and Zimmet 18 ), a diet of high-quality food choices is essential and forms an integral layer of dietary advice. However, high diet quality may be more difficult to achieve within an energy restriction, and interventions tend to report energy- and nutrient-level changes, but not changes in diet quality( Reference Webber and Lee 1 ).
A diet quality tool is a predefined measure based on food groups and/or nutrients, or dietary guidelines and creates a single quantifiable rank or score by subject( Reference Togo, Osler and Sorensen 19 ). Several reviews of diet quality tools have been published( Reference Kant 14 , Reference Wirt and Collins 17 , Reference Togo, Osler and Sorensen 19 – Reference Kourlaba and Panagiotakos 24 ), defining important considerations in the methodological process of designing such tools and the differences between tools. The most recent review by Wirt & Collins( Reference Wirt and Collins 17 ) examined twenty-five indices of diet quality or diet variety that used a range of measures from nutrients to food servings or food groups. This review noted many methodological weaknesses in the existing tools, but concluded that higher diet quality was inversely related to all-cause mortality with a moderate protective effect. The ‘moderate’ effect size was generalised since the predictive capacity of most indices was reportedly in a similar range; that is, a 17–42 % reduction in all-cause mortality, a 18–53 % reduction in CVD mortality, a 14–28 % reduction in the risk of CVD, a 13–30 % reduction in cancer mortality and a 7–35 % reduction in all-cancer risk( Reference Wirt and Collins 17 ).
A number of diet quality tools are available for dietary pattern research, yet many are based on dietary guidelines including the Diet Quality Index( Reference Haines, Siega-Riz and Popkin 25 ), the Healthy Eating Index( Reference Kennedy, Ohls and Carlson 26 ) and the Dietary Guideline Index( Reference McNaughton, Ball and Crawford 27 ), and only some have been validated for certain populations( Reference Waijers, Feskens and Ocke 21 , Reference McNaughton, Ball and Crawford 27 , Reference Mainvil, Horwath and McKenzie 28 ). Few studies have assessed the effect of diet quality in terms of weight change in an intervention setting( Reference Webber and Lee 1 , Reference Togo, Osler and Sorensen 19 ). The published studies have tended to use an existing tool that includes both foods and nutrients( Reference Nazare, Smith and Borel 2 , Reference Valente, Sheehy and Avila 29 ) or a tool based on dietary guidelines( Reference Webber and Lee 1 , Reference Wiltheiss, Lovelady and West 30 ), or a tool that does not include all of the possible foods and drinks consumed( Reference Cottell, Dorfman and Straight 31 , Reference Raynor, Looney and Steeves 32 ). None of these studies has used a tool specifically designed for clinical weight loss, and this setting may require a more specific tool to correctly depict dietary change. The aim of the present study was to develop and validate a diet quality tool based on food categories to monitor dietary change in clinical weight-loss interventions.
Methods
Reference data for the analyses described herein were obtained from diet history records from two clinical weight-loss trials and included the participants completing 3 months (n 195). This sample has been described previously( Reference Grafenauer, Tapsell and Beck 33 ). Each trial was approved by the University of Wollongong Human Research Ethics Committee and registered with Australian New Zealand Clinical Trials Register Network (12608000425392 and 12610000784011). Both trials were based on individualised energy restriction (80 % of BMR × physical activity level 1·25 using the Mifflin St Jeor equation( Reference Mifflin, St Jeor and Hill 34 )) and focused on achieving a prescribed intake of core foods with high dietary quality. Diet history data reflective of a weekly pattern of intake were collected by Accredited Practising Dietitians. Before the interview, participants completed a 4 d food record that assisted with recall of types and amounts of foods consumed. A checklist of specific foods including their frequency of consumption was also used for items that may have been omitted from the history records. Household measures and food models were used as a prompt for serve size. All food records were analysed using a computerised food and nutrient database, FoodWorks™ Professional (version 6, 2009; Xyris). Under-reporters were excluded using the Goldberg cut-off limits (0·76–1·24)( Reference Goldberg, Black and Jebb 35 , Reference Black 36 ), reducing the sample size for the analysis presented herein (n 189).
The Food Choices Score (FCS) was developed based on seventeen food categories, and the scope of foods from within each food category has been adopted from previous research( Reference Grafenauer, Tapsell and Beck 33 ). Each food item reported in the diet history interviews was entered into the computerised food and nutrient database, categorised according to the described groups and then analysed in g and kJ. The number of serves of each food category was calculated in grams (except for alcoholic beverages and the non-core foods and drinks category where the number of serves was calculated in kJ). Serve sizes were adapted from two ready reckoners( 37 , Reference Stewart 38 ) and have been used in previously published research( Reference Grafenauer, Tapsell and Beck 33 ).
The 3-month diet history data were used to guide the development of the scoring scale as these data represented the improved, prescribed diet. To define the scoring scale for each food category, the number of serves (per d) for each food category was ranked from lowest to highest consumption that was examined graphically, noting the range (maximum and minimum number) of serves consumed. The highest score was adjusted as required in line with the recommended serves for each food group( 39 , 40 ). Reverse scoring, i.e. lower scores for highest consumption, was applied to food categories for which consumption limits (associated with negative health outcomes) have been documented in the literature, e.g. fatty meats have been linked with chronic disease( Reference Micha, Wallace and Mozaffarian 41 – Reference Roussell, Hill and Gaugler 43 ). A U-shaped scoring scheme was used for food groups for which benefits exist with limited consumption but negative consequences with excess intake( Reference Waijers, Feskens and Ocke 21 ), e.g. alcohol. Alcohol consumption within the recommended limits( 44 ) may provide some benefit to health and is not associated with weight gain( 45 ), but heavier consumption over time is associated with weight gain( Reference Behall, Howe and Anderson 46 ) and other negative health outcomes( Reference Corrao, Rubbiati and Bagnardi 47 – Reference Parry, Patra and Rehm 49 ).
A scoring scale in serves per d with scores ranging from 0 to 5 aligned with increments for each food category was identified to achieve a maximum FCS of 85 (Table 1). The highest score applied to each food category reflected the optimal range of intake based on the described considerations. Scores were applied to the serve-based data of each trial participant (n 189) at baseline and 3 months using equations in Microsoft Excel (2010) to ensure accuracy of the composite score.
Food Choices Score

Content validity involved a qualitative check of possible methodological weaknesses according to the latest review of diet quality scores( Reference Wirt and Collins 17 , Reference Waijers, Feskens and Ocke 21 ). This check addressed key issues relating to the content of the diet quality score as described by Waijers et al. ( Reference Waijers, Feskens and Ocke 21 ), including the choice of the index components and the assignment of food items to food categories (Table 2), for example distinguishing between whole grains and refined grains( Reference Wirt and Collins 17 , Reference McCullough, Feskanich and Rimm 50 ), assessing dairy foods and dairy food alternatives by fat content rather than Ca content, and providing separate categories for fruit and vegetables, and fish and seafood( Reference Waijers, Feskens and Ocke 21 ). Food preparation was also taken into account in accordance with our previously published work( Reference Grafenauer, Tapsell and Beck 33 ). For example, plain boiled or steamed starchy vegetables were assigned to the starchy vegetables category, while fried potatoes (or chips) were assigned to the non-core foods and drinks category. Similarly, fried meats such as schnitzel were assigned to the fatty meats category.
Validation plan outlining content and construct validity considerations( Reference Wirt and Collins 17 , Reference Waijers, Feskens and Ocke 21 , Reference Fransen and Ocké 23 , Reference Wirfält, Drake and Wallström 57 )
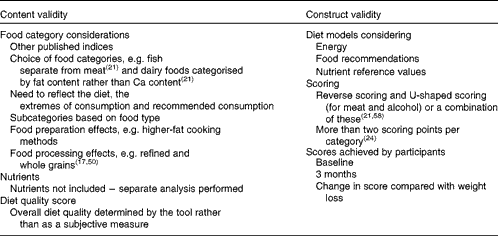
Construct validity evaluated quantitatively how well the scoring system measured what it was supposed to measure. This was assessed in two ways. First, two theoretical energy-deficit diet models were constructed (based on 6500 and 7400 kJ), representing the highest diet quality score of 85. The upper and lower boundary limits for energy intake were based on the mean reported energy intake of females (6031 (sd 1100) kJ) and males (7274 (sd 1752) kJ) at the 3-month time point, and on the energy intake range of the diet prescriptions for female (5000–7500 kJ) and male (6500–9000 kJ) participants. Both the mean (reported) and prescribed energy intakes were taken into consideration in order to accommodate both men and women within the highest score, and this score was validated through the modelling of food categories( Reference Waijers, Feskens and Ocke 21 ) (Table 3). The tool was specifically designed to prevent higher diet quality being the result of purely increasing energy intake, rather higher diet quality was based on specific food choices and specifically reflected lower energy intake resulting in weight loss (Table 3). The nutrient value of the associated range of serves by food category was tested using data from the FoodWorks™ Professional software system (version 6, 2009; Xyris) in comparison to food guide recommendations (in serves) in use for the healthy population( 40 ), and Nutrient Reference Values (Suggested Dietary Targets and Estimated Average Requirements)( 39 ) (Table 3). Second, using the trial data, change in the FCS was compared with weight loss achieved at 3 months in the trials. Thus, internal validity was demonstrated by comparing diet quality scores in idealised diets using the diet models, nutrient values and recommended number of serves from the national guidelines( 51 ), while external validity was demonstrated by comparing the highest ( ≥ 70 %) and the lowest ( ≤ 60 %) scores in relation to food categories, energy intake and nutrients consumed.
Diet model for the highest Food Choices Score rating of 85

NR, no recommendation; F, female; M, male.
Statistical analyses
The compatibility of the two combined trial databases in terms of age of participants, BMI, reported percentage of macronutrients consumed and a χ2 test tested for sex differences between groups at baseline has been established and reported previously( Reference Grafenauer, Tapsell and Beck 33 ). Independent-samples t tests were used to evaluate differences in the FCS at baseline and 3 months between sexes to ensure there was no sex effect.
To test the validity of the FCS, (1) the maximum FCS was calculated using the idealised diet model and (2) the FCS values were used to estimate the relationship between the score, food categories and weight loss. The mean (and standard deviation or 95 % CI) and range values of the FCS and the change in score were calculated for the total sample at each time point. The values for participants who lost weight were compared with the values for those who did not lose weight, for those that lost greater than (and less than) 5 % body weight and for those scoring greater than the mean change in score using independent-samples t tests. Overall, three score bands were formed to distinguish between the participants scoring below 60 % of the total score ( ≤ 44/85) and those scoring above 70 % of the total score ( ≥ 56/80). Food category data (at baseline and 3 months), energy intake and nutrients consumed were analysed using a one-way ANOVA with post hoc Bonferroni correction. Normality of the data was determined using the Shapiro–Wilk test, and then comparison between weight change and score change was made using Pearson's correlation coefficient. Logistic regression was used to determine whether weight loss was predicted by increasing or decreasing intakes of particular food categories in the total sample. All statistical analyses were performed using IBM SPSS Statistics (version 19.0.0; IBM Corporation).
Results
The maximum diet quality score of 85 was shown to meet food guide recommendations (in serves) and Nutrient Reference Values (Table 3). The Goldberg cut-off limits excluded six participants due to under-reporting at baseline, reducing the sample size (n 189) in the present analysis. At baseline, no differences were found between men and women in terms of reported energy intake or nutrients consumed (carbohydrate, protein, fat or dietary fibre). At 3 months, men reported a significantly reduced energy intake compared with women ( − 3935 (sd 3017) v. − 2715 (sd 1832) kJ; P= 0·010). At baseline, the mean FCS was 42·6 (sd 8·6) (range 19–61/85) and at 3 months, it was 49·1 (sd 7·6) (range 28–68/85). There was no difference found in mean FCS between the participants who lost weight (n 177) and those who did not (42·7 (sd 8·7) v. 41·1 (sd 6·5); P= 0·531) at baseline, whereas a difference was found between the participants who lost weight and those who did not (49·4 (sd 7·4) v. 44·4 (sd 10·0); P= 0·027) at 3 months.
At baseline, a difference was found in score for the participants who lost more than 5 % body weight (n 100/189) (40·9 (sd 8·5) v. 44·5 (sd 8·3); P= 0·003), in favour of the group who lost less weight at 3 months. At 3 months, there was no significant difference in score (49·1 (sd 7·1) v. 49·2 (sd 8·2); P= 0·967), although there was a difference in score change (Δ = 8·3 (sd 10·9) v. 4·6 (sd 11·1); P= 0·024), in favour of the weight-loss group. For the total sample, the mean change in the FCS was 7 (sd 11). When the score change value was greater than the mean change (Δ ≥ 7; n 100) for the total sample, BMI change was greater (Δ = − 1·8 (sd 1·1) v. − 1·5 (sd 1·1); P= 0·044).
Participants with the highest scores at 3 months (FCS ≥ 56/85) had a greater score change value, significantly higher than those with the lowest scores (Δ = 14·4 (sd 8·4) v. − 2·7 (sd 10·2); P< 0·001). The score change between the lowest and highest score bands was also reflected in an improvement in diet quality (in eight out of seventeen food categories), exemplified by a greater consumption of fruit (P< 0·001), more consumption of low-fat dairy foods (P= 0·003), more consumption of legumes (P= 0·032), less consumption of medium-fat dairy foods (P< 0·001), less consumption of higher-fat dairy foods (P= 0·001), less consumption of fatty meat (P< 0·001), less consumption of non-whole-grain (refined) cereals (P< 0·001) and less consumption of non-core foods and drinks (P< 0·001). The changes in the dietary pattern resulted in a significant difference in the intakes of energy (P= 0·018), total dietary fat (P< 0·001) and dietary fibre (P= 0·031) (Table 4).
Low (≤60 %), medium and high (≥70 %) Food Choices Scores (FCS) by food category, energy intake and nutrients consumed at 3 months (n 189)* (Mean values and standard deviations)

* One-way ANOVA with post hoc Bonferroni correction.
Pearson's correlation coefficient analysis revealed that a mean score change of 6·5 (sd 11·1) points was correlated with a mean weight change of − 4·7 (sd 3·0) kg; although this correlation was significant, it was weak (P= 0·023; 0·165)( Reference Cohen 52 ). Logistic regression analysis using the available sample revealed that for every one serve increase in non-core foods and drinks, the odds of weight loss was 0·645 (reduced by 35·5 %; P= 0·004), and that with every one serve increase in non-whole-grain (refined) cereals, the odds of weight loss was 0·825 (reduced by 17·5 %; P= 0·011). Therefore, increasing consumption of non-core foods and drinks and non-whole-grain cereals was less likely to lead to weight loss. Although increasing fruit consumption was less significant in comparison (P= 0·061), weight loss was 1·485 times more likely to be achieved for every one serve increase in consumption.
Discussion
Analyses using the FCS demonstrated the achievement of a maximum score in an idealised diet, and associations between better quality food choices and weight loss, in a setting where high-quality foods were advised. The FCS utilised the key suggestions by Waijers et al. ( Reference Waijers, Feskens and Ocke 21 ) in terms of content and met the food group and Nutrient Reference Values in an idealised diet model with the highest score of 85. A higher FCS was consistent with improved diet quality and was associated with increased consumption of fruit, legumes and low-fat dairy foods (closer to the requirements) and decreased consumption of medium- and higher-fat dairy foods, fatty meat, non-whole-grain (refined) cereals and, importantly, non-core foods and drinks. These food-level changes reflect those also noted by Mozaffarian et al. ( Reference Mozaffarian, Hao and Rimm 3 ) within an observational cohort described earlier. By segmenting participants based on weight loss, it was apparent that those losing the most body weight (>5 %) increased their score significantly by 3 months. The highest scores were a reflection of the degree of achievement in terms of diet quality and dietary change over time, although the highest possible score was not achieved by any participants in the sample. Thus, we considered the FCS to be valid and reliable in that the highest score was achieved in an idealised diet model, and the identified changes in the consumption of foods using the FCS were consistent with observational studies of foods that were negatively associated with weight loss. These, of course, are qualitative assessments, and we did not provide an exact measure of precision. Logistic regression using the entire sample suggested that certain foods were more likely to be associated with weight loss, and these same food categories were identified by the FCS.
A diet quality tool can fulfil a number of purposes, and, to date, they have been used to support disease predictions, outcome measures and monitoring of foods, food groups, nutrients or combination of these( Reference Kant 14 , Reference Wirt and Collins 17 , Reference Waijers, Feskens and Ocke 21 ). Many of the tools developed have provided a relative score or an assessment against Dietary Guidelines( Reference Waijers, Feskens and Ocke 21 ), and have not been tailored for the intervention setting( Reference Mainvil, Horwath and McKenzie 28 ). It has been suggested that a diet quality tool would be suited to the diet assessment process( Reference Wirt and Collins 17 ). Furthermore, there are suggestions in the literature( Reference Nazare, Smith and Borel 2 ) that choosing particular foods such as nuts( Reference Novotny, Gebauer and Baer 53 ) and whole foods v. more processed foods( Reference Barr and Wright 54 ) may better support weight maintenance. One of the arguments is that the metabolisable energy of the unprocessed food is less than the estimated available energy (reflected in food composition tables), whereas food processing may increase the availability of energy. So a measure of diet quality is helpful. Specifically, the present analysis highlighted a decreased consumption of non-whole-grain (refined) cereals and non-core foods and drinks in weight loss, as confirmed by logistic regression analysis further supporting the conclusions using the FCS.
Designing an index of diet quality is highly complex. Many tools have been validated in populations; however, they may have been incorrectly applied in different contexts( Reference Waijers, Feskens and Ocke 21 , Reference McNaughton, Ball and Crawford 27 , Reference Mainvil, Horwath and McKenzie 28 ). There are many forms of dietary scores, and there are calls in the literature to be clear regarding the intention of the score( Reference Wirt and Collins 17 , Reference Waijers, Feskens and Ocke 21 ). If an index is based on dietary guidelines, it provides a relative measure against that standard, or if the index is designed with specific culturally based dietary elements, it should really only be applied to that specific population. The FCS was developed to measure diet quality specifically in a weight-loss context in which the dietary advice focused on high-quality foods. Many arbitrary choices have been made in designing past tools and applying scores( Reference Waijers, Feskens and Ocke 21 ). The advantage of the FCS is that it was developed using context-sensitive dietary data and pre-tested with theoretical diet models. This differentiated the FCS from tools appropriate for use at the population level. To develop this clinical research tool, there was a need to define sensible, data-driven cut-off points for each food category so as not to overemphasise a single food category variable. It is not plausible that all index components contribute equally to the total score or to the same health outcome( Reference Waijers, Feskens and Ocke 21 ), and this is an issue for some existing tools. The score range for each food category was then validated within the theoretical diet models to ensure that the highest score could accommodate current nutrient targets and food recommendations without exceeding the energy range for males and females. Consequently, an alignment with energy, nutrient and food category targets was considered to be of importance in designing the FCS. While energy restriction is pivotal to weight loss, this can compromise nutrient intake or nutrient status( Reference Kant 55 ). In recent research of dietary patterns at the baseline stage of a clinical trial, we found that weight loss was more easily achieved when poor-quality diets were improved( Reference Grafenauer, Tapsell and Beck 33 ). This lead us to consider the concept of a diet quality score and how this might change over time in the trial. The emphasis on diet quality in a weight-loss context recognises the inter-relationships between foods and food components, and considers the relationship between the dietary pattern and overall health. Importantly, the FCS was able to capture as much detail on all foods and drinks consumed in the diet as possible, and points to particular foods and drinks as possible targets for the weight-loss setting.
Waijers et al. ( Reference Waijers, Feskens and Ocke 21 ) suggested that a diet quality tool includes a measure of two macronutrients as an assessment of overall dietary balance; however, a check of nutrients can be easily conducted as an additional analysis without needing to be incorporated into the tool itself. We were able to demonstrate relevant nutrient changes alongside the food category changes. Rather than including a subjective score for overall diet quality as part of the tool, the overall assessment of diet quality was determined by the tool itself and the final FCS( Reference Waijers, Feskens and Ocke 21 ). The present study demonstrates that the change in the FCS discerned differences in diet quality since the total score was able to distinguish between the participants with improved consumption habits and those with less consumption habits, and the FCS at 3 months differentiated those with a greater change in BMI and an overall change in score was correlated with weight loss, even though all subjects were prescribed the same energy deficit. Application of the FCS demonstrated that participants can achieve weight loss, although improving diet quality, meeting nutrient requirements and reducing intakes of non-core foods and drinks appear to be an important step in achieving this outcome.
The FCS diet index tool was based on data from a small population of overweight to obese subjects (n 189). An important consideration is the interpretation of the score and understanding the limitations of the tool and the score. In the present study, no participants achieved greater than 80 % of the possible FCS, and it is recommended that the tool be tested with a group within the healthy weight range to further assess the validity of the tool. Food classification was central to the way in which the FCS was developed, and there are questions as to the classification of foods: first, in relation to nutritional homogeneity within the categories( Reference Reul 15 ) and, second, food classification is influenced by how foods are viewed culturally( Reference Reul 15 ). As with all dietary assessment methods, the FCS is context-sensitive and may need modification for other clinical settings. The food categories and the serve size of each category used in the FCS have been utilised in previously published research( Reference Grafenauer, Tapsell and Beck 33 ), and the food categories selected reflected the current recommendations concerning foods and food groups in relation to weight loss( Reference Reul 15 , Reference Waijers, Feskens and Ocke 21 ). Ensuring that the tool captures the current emphasis on diet–disease relationships represents a limitation, and the FCS would need to be adjusted as new evidence about specific foods is established. Finally, all dietary studies must deal with the issue of misreporting of dietary data, particularly among overweight participants( Reference Kuhnle 56 ). In the present study, under-reporters were removed using the Goldberg cut-off limits( Reference Goldberg, Black and Jebb 35 , Reference Black 36 ).
Conclusion
The FCS proved to be valid when applied to an idealised diet model, and the highest FCS represented higher diet quality discerning the differences in energy and nutrient intakes. Furthermore, weight loss was related to a greater improvement (change) in the FCS, suggesting that examination of the changing pattern of foods consumed during weight loss is informative and complements the change in macronutrient intakes. The ability to deliver specific food advice in the clinical setting is pivotal to changed dietary behaviour, and these findings suggest that particular foods and beverages may be able to be targeted in weight-loss advice. The FCS was specifically designed to align with energy-, nutrient- and food-based recommendations, and, together, the analysis of the food categories, energy intake, nutrients consumed, body weight loss and change in BMI helps validate the FCS. The highest scores using the FCS indicated improved diet quality as a result of dietary change and represent increased reported consumption of positive, core food choices and decreased consumption of non-core food and drinks and non-whole-grain cereal choices, giving specific direction for advice in practice. The FCS proved to be valid for assessing diet quality in clinical weight-loss settings, producing maximum scores in the optimised diet models and demonstrating expected changes in food choice patterns under supervised weight-loss conditions.
Acknowledgements
The authors thank Nathan Larkin, Research Fellow from the Faculty of Engineering for his assistance with data management.
The present study was supported by an Australian Postgraduate Award, and the trials from which the data were made available for this analysis were funded by the National Health and Medical Research Council and Horticulture Australia Limited (ACTRN 12608000425392 and 12610000784011). The funding bodies had no role in the design, analysis or writing of this article.
The authors' contributions are as follows: S. J. G. was responsible for conceptualising the study, data analysis and the initial and final drafts of the manuscript; E. J. B. and L. C. T. wrote the manuscript; M. J. B. provided guidance regarding the statistical analyses. All authors read and approved the final manuscript.
The authors declare that they have no conflicts of interest.



