


1 Introduction
Understanding the underlying physics of laser-plasma interactions (Kruer & Dawson Reference Kruer and Dawson1988) is extremely important for energy coupling into targets, particularly to achieve ignition in inertial confinement fusion (ICF) (Nuckolls et al. Reference Nuckolls, Wood, Thiessen and Zimmerman1972; McCrory et al. Reference McCrory2013). Laser-plasma instabilities (LPI) such as stimulated Raman scattering (SRS), stimulated Brillouin scattering (SBS) and two-plasmon decay (TPD) can play a detrimental role in ICF. The plasma conditions (temperature, density, spatial scale and composition) and laser irradiation (spatial and temporal intensity profiles and wavelength) determine the conditions under which LPI can grow and saturate. Understanding and controlling LPI are extremely important for the success of all three main focus areas of ICF i.e. laser indirect-drive (LID) (Nuckolls et al. Reference Nuckolls, Wood, Thiessen and Zimmerman1972), laser direct drive (LDD) (McCrory et al. Reference McCrory2013) and magnetized liner inertial fusion (MagLIF) (Slutz et al. Reference Slutz, Herrmann, Vesey, Sefkow, Sinars, Rovang, Peterson and Cuneo2010). For both LID and LDD, the instabilities can be strongly excited in the extended under dense plasma, for example, at the laser entrance hole (LEH) and inside the hohlraum for LID targets and coronal plasma surrounding the LDD fuel capsule. Laser beams are arranged in various cones that enter the gas-filled high-Z hohlraum from the LEH. The cross-beam energy transfer mediated by ion acoustic waves occurs at the LEH region where outer beams transfer power to inner beams when they overlap. The SRS grows continuously along the inner beam path in the long-scale-length and under-dense plasma. This can lead to a significant reduction of laser energy coupling due to the energy being scattered by SRS and SBS. In addition, SRS and TPD both involve electron plasma waves (EPWs) and can produce copious energetic hot electrons that can preheat the fusion target, degrading implosion performance.
Recent success of the MagLIF concepts (Slutz et al. Reference Slutz, Herrmann, Vesey, Sefkow, Sinars, Rovang, Peterson and Cuneo2010) has prompted further investigation of applying a seed magnetic field ($B$ -field) to indirect-drive ICF implosions to enhance implosion performance (Perkins et al. Reference Perkins, Logan, Zimmerman and Werner2013, Reference Perkins, Ho, Logan, Zimmerman, Rhodes, Strozzi, Blackfield and Hawkins2017; Moody et al. Reference Moody, Johnson, Javedani, Carroll, Fry, Kozioziemski, Kucheyev, Logan, Pollock, Sio, Strozzi, Stygar, Tang and Winters2020; Moody Reference Moody2021; Walsh et al. Reference Walsh, O'Neill, Chittenden, Crilly, Appelbe, Strozzi, Ho, Sio, Pollock, Divol, Hartouni, Rosen, Logan and Moody2022). Additionally, previous work using directly driven capsules at Omega (Chang et al. Reference Chang, Fiksel, Hohenberger, Knauer, Betti, Marshall, Meyerhofer, Séguin and Petrasso2011) demonstrated that even a modest background $B$
 -field (8 T) can increase the ion temperature and neutron yield by 15 % and 30 %, respectively. A myriad of other works establishes the clear gains in ignition physics provided by a background $B$
 -field, namely thermal conduction suppression and enhanced $\alpha$
 -particle confinement (Basko, Kemp & Meyer-ter-Vehn Reference Basko, Kemp and Meyer-ter-Vehn2000). Magnetization of the plasma is characterized by the Hall parameter $\omega _{ce} \tau _{ei} \sim 0.3 B [\mathrm {T}] \times T_e[\mathrm {keV}]^{3/2} \times ({0.1}/{n_e/n_{c(3\omega )}})$
 , where B is the magnetic field strength in units of Tesla, Te is the electron temperature in units of kiloelectronvolts, $\omega _{ce}$
 is the electron gyrofrequency, $n_c$
 is the critical density at $\lambda =351$
 nm ($3\omega$
 ) and $\tau _{ei}$
 the electron–ion collision time. When $\omega _{ce} \tau _{ei}$
 is greater than unity, the $B$
 -field can confine electrons and induce anisotropic thermal-electron diffusion. The subsequent magnetic insulation of the electron heat conduction results in hotter plasma with a prolonged lifetime, which can in turn further reduce SRS with higher $T_e$
 (increased Landau damping). Previous work by Montgomery et al. has demonstrated increased $T_e$
 with an externally applied parallel $B$
 -field ($\sim$
 7.5 T) in a gas-filled hohlraum; measured with $4\omega$
 optical Thomson scattering (Montgomery et al. Reference Montgomery, Albright, Barnak, Chang, Davies, Fiksel, Froula, Kline, MacDonald, Sefkow, Yin and Betti2015). Potential applications using $B$
 -fields to directly control and reduce SRS is yet to be confirmed in laser-matter experiments.
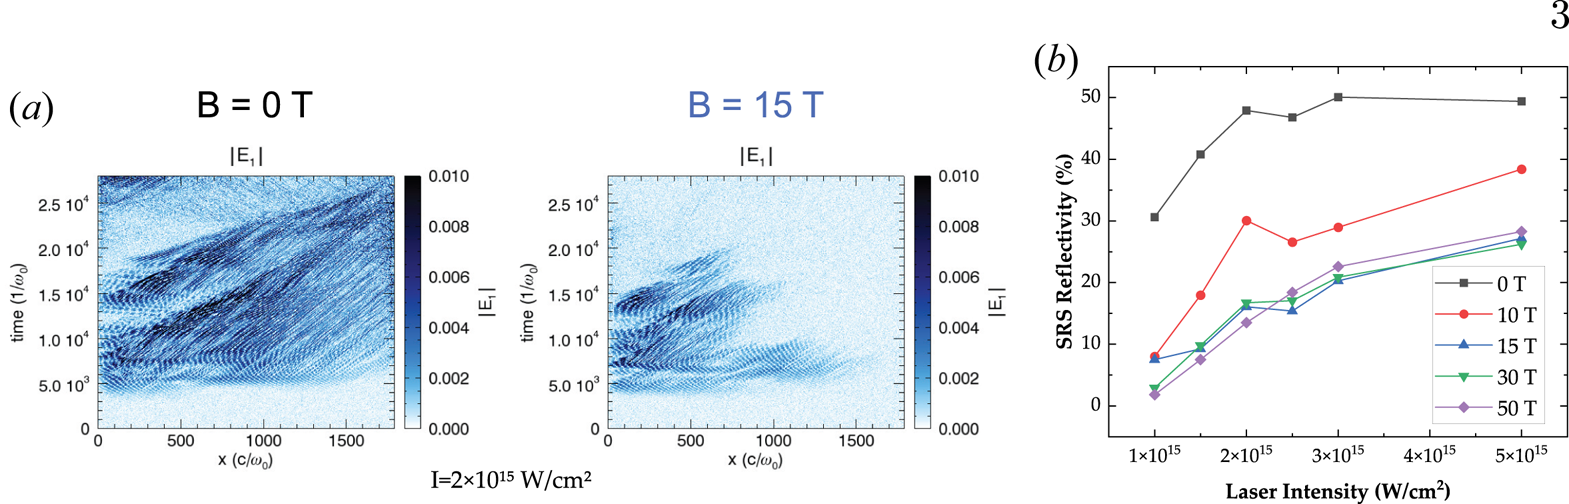
It was shown in Winjum, Tsung & Mori (Reference Winjum, Tsung and Mori2018) that a moderate strength $B$ -field ($\sim$
 10–30 T) can significantly reduce the reflectivity of SRS (figure 1) in the kinetic regime of the instability. The kinetic regime corresponds to plasma conditions where the wave–particle interactions govern the SRS growth rate and where an applied magnetic field is predicted to produce the greatest changes in SRS reflectivity. This regime is attained when the dimensionless parameter $k \lambda _D$
 is between ${\sim }0.25$
 and ${\sim }0.35$
 , where $k$
 is the EPW wavenumber and $\lambda _D$
 is the Debye length. The reduction in SRS reflectivity is most significant for a purely perpendicular $B$
 -field ($B \perp k$
 ), due to the enhanced dissipation of nonlinear EPWs propagating perpendicular to the magnetic field. This dissipation of the EPW activity with an applied $B$
 -field perpendicular to $k$
 can be observed in the particle-in-cell (PIC) simulation results of figure 1(a). A reduction also occurs for other angles, as well as for single and multi-speckled laser beams (Winjum et al. Reference Winjum, Tsung and Mori2018).
OSIRIS one-dimensional PIC simulation results. (a) Nonlinear electron plasma waves driven by SRS are shown to be heavily damped by a 15 T $B$ -field perpendicular to the laser propagation direction at a laser intensity of $I = 2 \times 10^{15}$
 W cm$^{-2}$
 (at $3 \omega$
 ). (b) OSIRIS predicts suppression of SRS by moderate 10–50 T $B$
 -fields over laser intensities in the range $0.6\unicode{x2013}5 \times 10^{15}$
 W cm$^{-2}$
 (at $3 \omega$
 ). The simulations are all run for plasma parameters $T_e = 3$
 keV, $n_e/n_{c}$
 ranging from 0.128 to 0.132 within a 100 $\mathrm {\mu }$
 m linear gradient, and $k\lambda _D \approx 0.30$
 .
.
In summary, an externally applied magnetic field has been predicted to mitigate LPI by altering wave–particle interactions (Yin et al. Reference Yin, Albright, Rose, Montgomery, Kline, Kirkwood, Michel, Bowers and Bergen2013; Winjum et al. Reference Winjum, Tsung and Mori2018) as well as to confine the plasma energy by reducing electron thermal conduction losses (Montgomery et al. Reference Montgomery, Albright, Barnak, Chang, Davies, Fiksel, Froula, Kline, MacDonald, Sefkow, Yin and Betti2015; Walsh et al. Reference Walsh, Chittenden, Hill and Ridgers2020). Magnetization of capsule implosions is an important topic for ICF due to its potential to relax the constraints of reaching ignition, as shown by the recent efforts within the national ICF program (Chang et al. Reference Chang, Fiksel, Hohenberger, Knauer, Betti, Marshall, Meyerhofer, Séguin and Petrasso2011; Perkins et al. Reference Perkins, Logan, Zimmerman and Werner2013, Reference Perkins, Ho, Logan, Zimmerman, Rhodes, Strozzi, Blackfield and Hawkins2017; Moody et al. Reference Moody, Johnson, Javedani, Carroll, Fry, Kozioziemski, Kucheyev, Logan, Pollock, Sio, Strozzi, Stygar, Tang and Winters2020; Moody Reference Moody2021; Walsh et al. Reference Walsh, O'Neill, Chittenden, Crilly, Appelbe, Strozzi, Ho, Sio, Pollock, Divol, Hartouni, Rosen, Logan and Moody2022). While SRS backscatter is not critical in present low-gas-fill LID designs, when moving to high-gain implosions, high-gas-fill targets will again be implemented wherein SRS is an important loss mechanism. Moreover, the role of preheating by SRS-driven hot electrons remains an issue, even at low gas filling. External $B$ -field capabilities at the OMEGA laser facility are available using the MIFEDS pulsed-power device (Gotchev et al. Reference Gotchev, Chang, Knauer, Meyerhofer, Polomarov, Frenje, Li, Manuel, Petrasso, Rygg, Séguin and Betti2009) and $B$
 -fields up to 30 T are readily achievable. A systematic study of the effects of an external $B$
 -field on the LPI onset and growth and their dependence on laser and plasma conditions can now be conducted at the OMEGA Laser Facility. In that context, we propose an experimental platform providing the ability to directly observe and quantify the effect of a background $B$
 -field on SRS backscatter in a well-characterized laser-plasma interaction.
2 Validation of magnetohydrodynamic simulations with data from a first experiment
We conducted a first experiment at the OMEGA-EP facility with a magnetic field of 5 T aimed at validating the feasibility of the platform and modelling capabilities. Reaching the kinetic regime for the backward-SRS (BSRS) instability requires fine control of the plasma conditions (electron temperature and density). The kinetic regime lies, for $k \lambda _D$ , between $\sim 0.25$
 and $\sim 0.35$
 . A value of $k \lambda _D$
 below or above this range results in BSRS being in the fluid regime (where no magnetic field mitigation occurs) or in the strong Landau damping regime (where the BSRS reflectivity becomes marginal), respectively. We will show next that we were able to measure a BSRS spectrum in the kinetic regime with an applied $B$
 -field of 5 T.
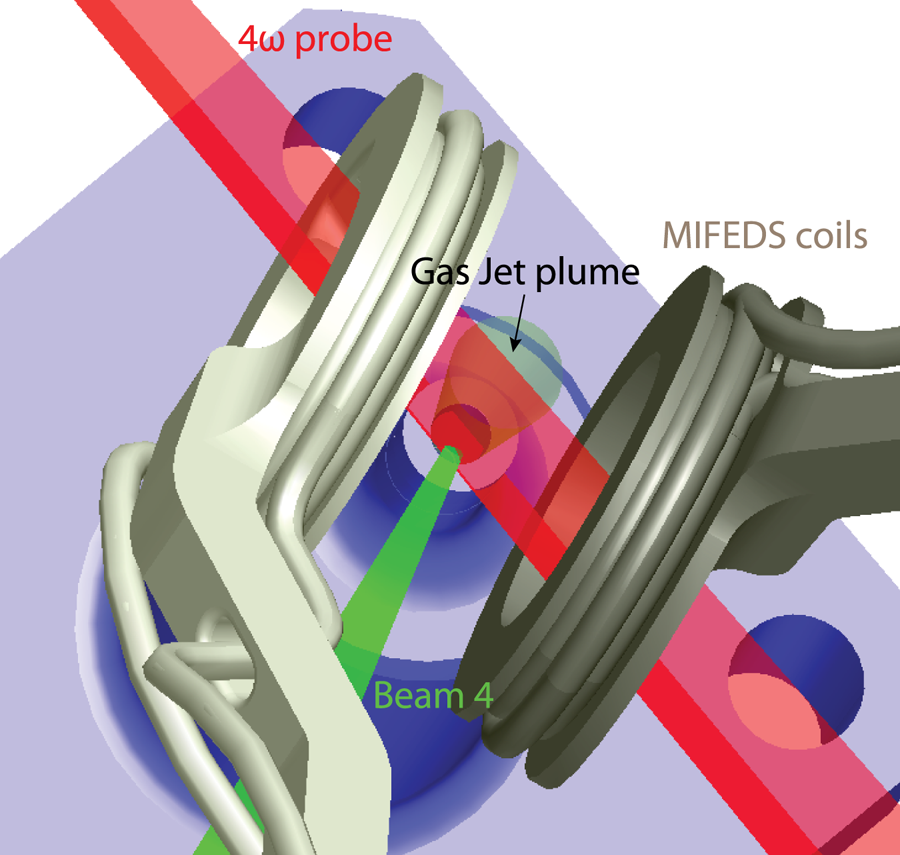
The experimental set-up is sketched in figure 2. We used a shaped laser pulse for beam 4 comprising a foot pedestal (60 J in 300 ps, 0.2 TW, $1.3 \times 10^{14}$ W cm$^{-2}$
 ) to heat the gas prior to the interaction of the high-power part of the beam (1.25 kJ in 1 ns, 1.25 TW, $8.1 \times 10^{14}$
 W cm$^{-2}$
 ). Beam 4 was equipped with a 400-$\mathrm {\mu }$
 m phase plate, giving $50\,\%$
 of enclosed energy at a spot diameter of $326\ \mathrm {\mu }$
 m. Based on the measured BSRS wavelength shift (figure 5a) and temperature measurement from Ar K-shell spectroscopy, we estimated that the target peak electron density is $\sim 1.1 \times 10^{21}$
 cm$^{-3}$
 ($n_e/n_c \sim 13\,\%$
 ) for the applied gas pressure of $\sim 640$
 psi and the target is preheated to ${\sim }1$
 keV before the main pulse arrives at 0.45 ns. This is in agreement with pressure–density scaling laws for the gas jet (Hansen et al. Reference Hansen, Haberberger, Katz, Mastrosimone, Follett and Froula2018) and two-dimensional magnetohydrodynamic (MHD) simulations. We will now detail the comparison between measurements and MHD simulations.
Visrad schematic of the platform as used during the first shot day. The MIFEDS coils magnetize the system. Beam 4 preheats the gas (pedestal) and then generates the scattered light spectrum, which is measured with the sub-aperture backscatter streak (SABS) diagnostic. The plasma density and temperature are characterized by the $4 \omega$ probe, X-ray spectrometer (XRS) and self-Thomson scattering (self-TS).
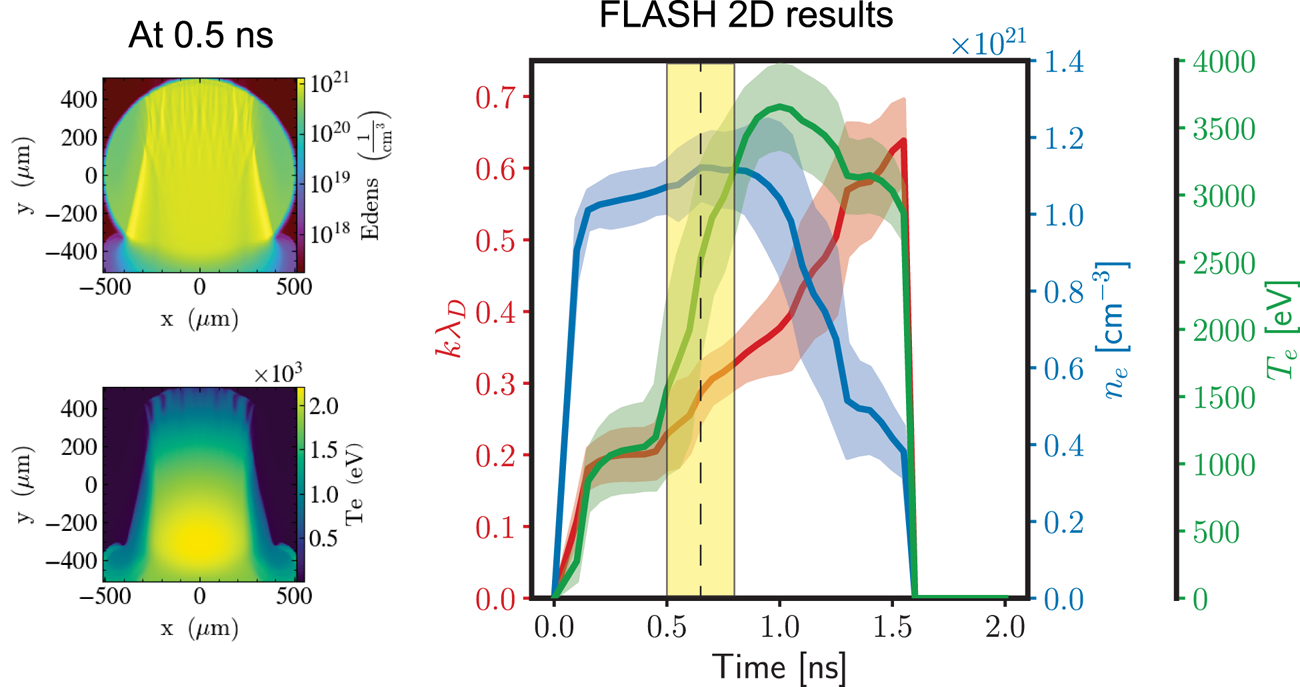
The MHD simulations shown in figure 3 are performed in two-dimensional Cartesian geometry, using the open-source FLASH code (Dubey et al. Reference Dubey, Antypas, Calder, Daley, Fryxell, Gallagher, Lamb, Lee, Olson, Reid, Rich, Ricker, Riley, Rosner, Siegel, Taylor, Weide, Timmes, Vladimirova and ZuHone2014) with equation-of-state and multi-group opacity tables from PrOpacEOS (Golovkin & Macfarlane Reference Golovkin and Macfarlane2018). The magnetic field is oriented along the $\hat {x}$ direction, that is here perpendicular to the laser propagation. The non-resistive MHD physics is activated, which specifically computes the effect of magnetic pressure via plasma advection and the anisotropy of the heat conduction due to the magnetic field, the latter using the Epperlein–Haines theory (Epperlein & Haines Reference Epperlein and Haines1986). Concerning extended-MHD effects (Walsh et al. Reference Walsh, Chittenden, Hill and Ridgers2020), we checked with the MHD code GORGON (Walsh et al. Reference Walsh, Florido, Bailly-Grandvaux, Suzuki-Vidal, Chittenden, Crilly, Gigosos, Mancini, Pérez-Callejo, Vlachos, McGuffey, Beg and Santos2022) that the Nernst effect was not important in this orientation. The time profiles shown in figure 3 are extracted from the simulation at each printout time step (every 50 ps), averaged in a box defined by $-100\ \mathrm {\mu }\mathrm {m} < x < 100\ \mathrm {\mu }$
 m and $-500\ \mathrm {\mu }\mathrm {m} < y < 500\ \mathrm {\mu }$
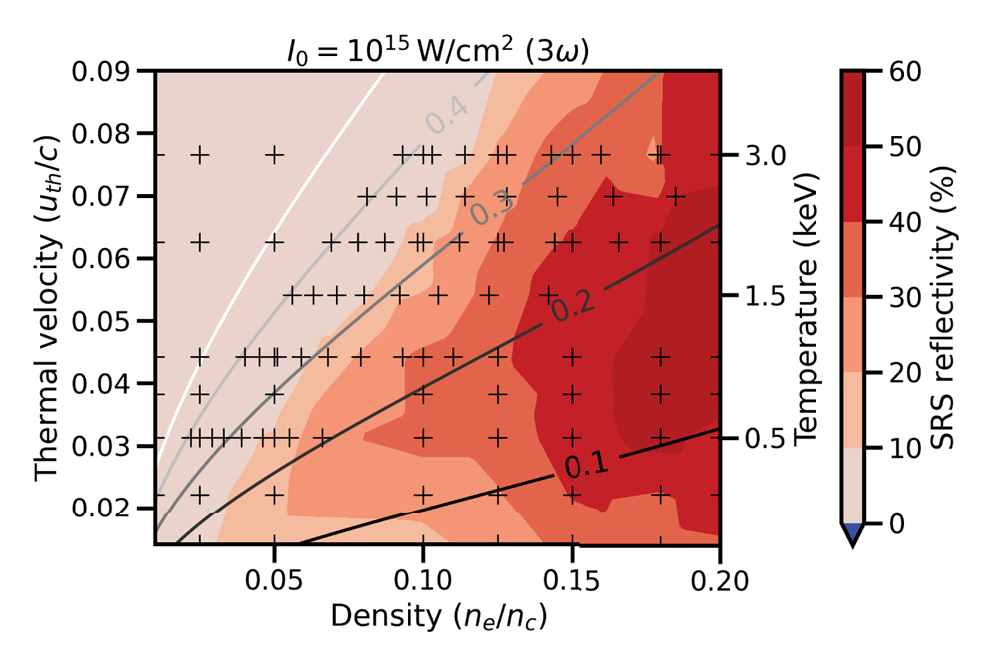
 m, encompassing the laser transverse spot size and longitudinal plasma length, respectively. We calculate the average and standard deviation of plasma conditions from the MHD simulations using a weighting function that accounts for the laser energy deposition and BSRS reflectivity in each cell, in order to characterize the plasma conditions with a metric that will give prevalence to regions where the laser interacts and backscatters. The reflectivity weighting is evaluated by interpolating the results of a collection of one-dimensional electromagnetic PIC simulations using the code OSIRIS (Hemker Reference Hemker2000; Fonseca et al. Reference Fonseca, Silva, Tsung, Decyk, Lu, Ren, Mori, Deng, Lee, Katsouleas and Adam2002, Reference Fonseca, Martins, Silva, Tonge, Tsung and Mori2008) performed across a wide range of plasma parameters and shown in figure 4.
Weighted average and standard deviation of electron temperature (green curve) and density (blue curve) extracted from a FLASH-2D simulation, with the corresponding calculated $k \lambda _D$ (red curve). The yellow shaded region corresponds to the time span for which BSRS is expected to be strongly excited, matching the lifetime of the BSRS experimental signal in figure 5(a).
Map of backward SRS reflectivity at $B=0$ T calculated from one-dimensional OSIRIS PIC simulations (cross symbols) across a wide range of plasma parameters. The solid lines represent contours of constant $k \lambda _D$
 . The map is interpolated and the resulting two-dimensional function is used to weight the average and standard deviation of plasma conditions extracted from the MHD simulations.
The MHD simulation results in figure 3 show that during the interaction of the high-power main beam, the electron temperature rises quickly from ${\sim} 1$ keV to ${\sim} 3$
 keV in approximately 200–300 ps. The electron temperature is ${\sim} 2$
 keV when the electron density peaks, which is in reasonable agreement with the average temperature at peak density inferred from Ar K-shell spectroscopy. In figure 5(b), we show the K-shell emission collected by a time-integrated Rowland XRS (Thorn et al. Reference Thorn, Coppari, Döppner, MacDonald, Regan and Schneider2018) forward fitted by synthetic spectra calculated by the collisional-radiative spectral analysis code PrismSpect (Prism Computational Sciences, Inc. 2023). Note that the fit sensitivity to opacity effects places our estimate of the average temperature in the range 1200–1600 eV. This measured average temperature is lower than inferred from MHD simulations, likely due to the underestimation of heat losses in the two-dimensional geometry. The target density then decreases due to expansion and $T_e$
 stays at its maximum.
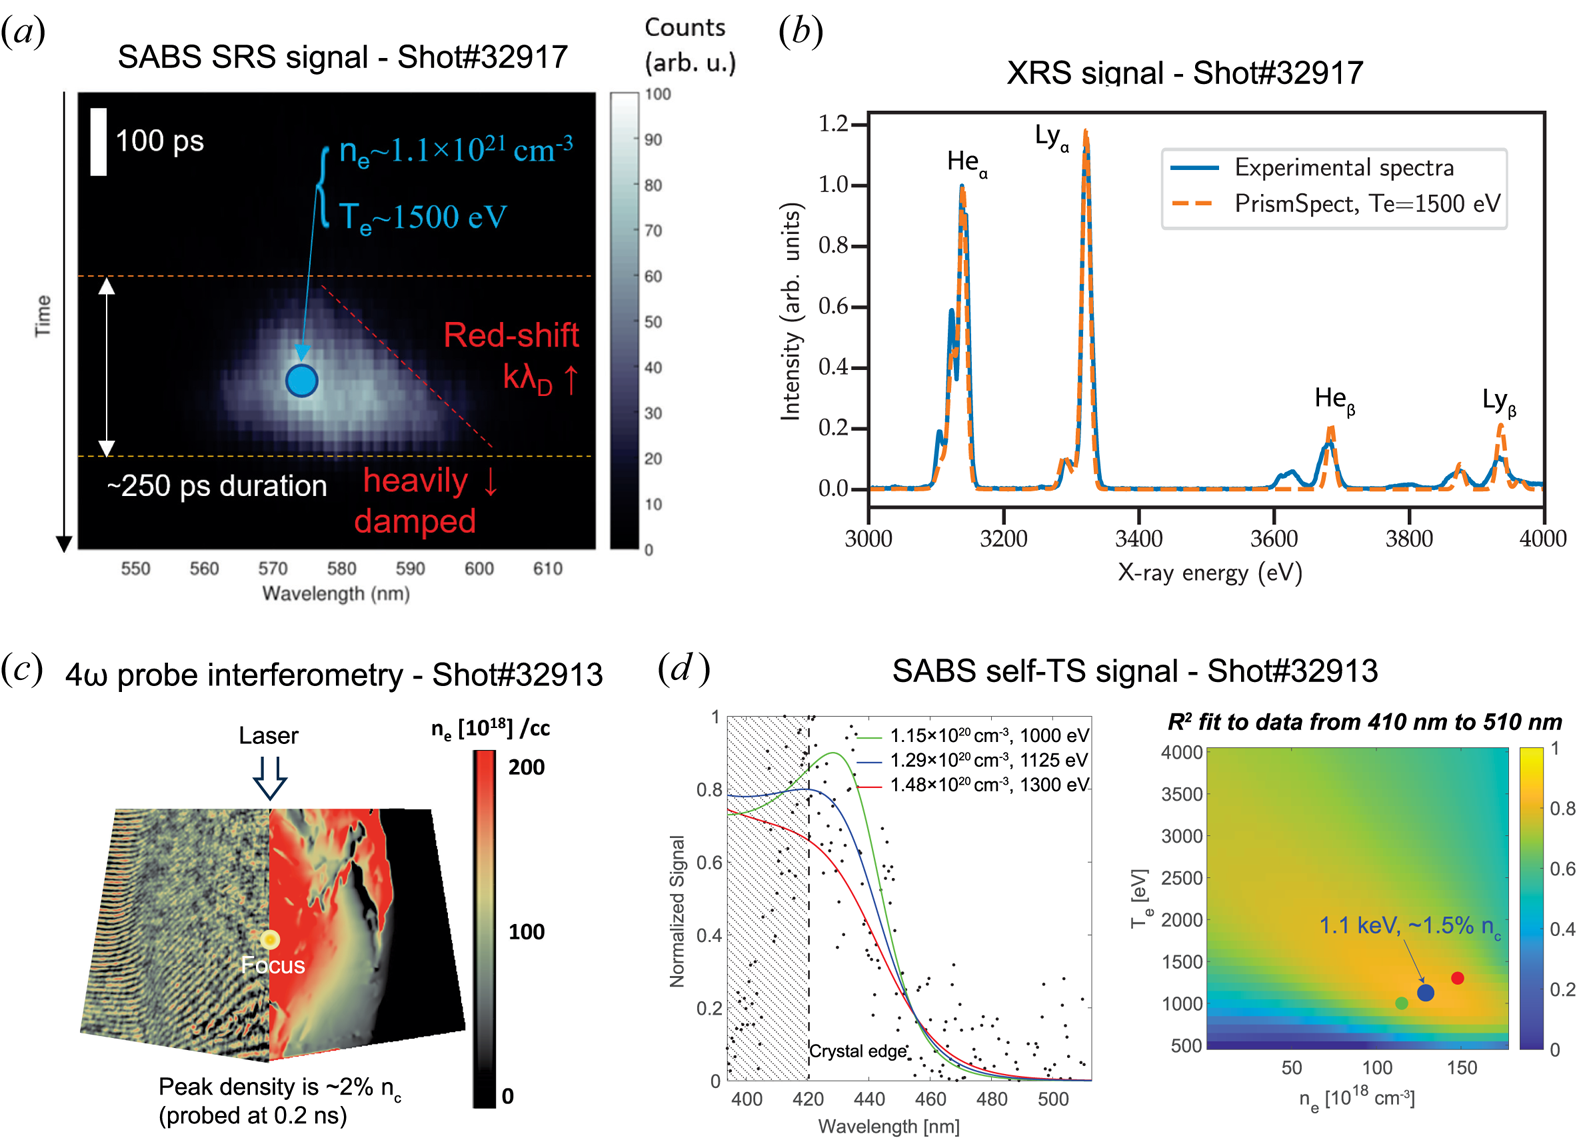
(a) The BSRS signal measured by the SABS diagnostic for $B=5$ T. The peak wavelength shift agrees well with the average conditions – at peak density – for this shot, i.e. ${\sim }13\,\% n_c$
 and ${\sim }1500$
 eV, according to FLASH (e) and XRS spectroscopy measurement (b), respectively. (b) XRS signal with a fit using the PrismSpect code, giving an electron temperature of ${\sim }1500$
 eV. For the same gas pressure, a shot with $B=0$
 T had a very different density, measured to be only ${\sim }2\,\% n_c$
 from both (c) interferometry (raw data on the left half and reconstructed density on the right half) and (d) self-TS, but showed no BSRS signal due to the lower density. The three curves in the self-TS plot in (d) correspond to the best-fit conditions ($R^2_{\max }$
 ) and min/max conditions at $R^2=0.9 R^2_{\max }$
 . The $R^2$
 fit map and corresponding coloured symbols for the three conditions are shown on the right side of (d).
From linear theory (Estabrook & Kruer Reference Estabrook and Kruer1983), one can relate the SRS backscattered wavelength to plasma conditions

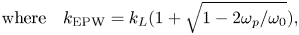
where $k_\mathrm {EPW}$ is the wavenumber of the BSRS EPW. The scattered wavelength $\lambda _{\mathrm {BSRS}}$
 in (2.1) depends on plasma density and temperature, respectively from the plasma frequency $\omega _p=\sqrt {n_e e^2 / m_e \epsilon _0}$
 and Debye length $\lambda _D=\sqrt {\epsilon _0 k_B T_e/n_e e^2}$
 , with e and me respectively the electron charge and mass, ε 0 the dielectric constant, and k B the Boltzmann constant. Here, we note that $k_L$
 is the laser wavenumber in the plasma, which writes $k_L = \sqrt {\omega _0^2-\omega _p^2}/c$
 , where $\omega _0=2 {\rm \pi}c / \lambda _0$
 ($\lambda _0=351$
 nm) is the laser fundamental frequency in vacuum. This is the formalism used to calculate the $k \lambda _D$
 evolution (red colour) in figure 3 from extracted MHD plasma conditions.
The simulation suggests that, during the first ${\sim }300$ ps of the main pulse irradiation (yellow shading in figure 3), the BSRS signal would (red)-shift to larger wavelengths in time due to the increase in $T_e$
 (density is almost constant), and eventually become heavily damped ($k \lambda _D>0.35$
 ) approximately 150 ps after the peak density. In figure 5(a), we show the BSRS signal measured in a shot with $\sim 5$
 T applied $B$
 -field. First, the wavelength position of the signal, accounting for the average temperature of ${\sim} 1500$
 eV, yields a value of electron density in agreement with the simulation using (2.1). Moreover, we observe the redshift broadening of the BSRS signal, in line with the increasing temperature, and the signal lasts ${\sim }250$
 ps before fading, which agrees with the expected $k \lambda _D$
 evolution shown in figure 3 from MHD simulations. The measurement validates the prediction from simulation and confirms the feasibility of the diagnostic for measuring BSRS in the kinetic regime of the instability ($k \lambda _D \sim 0.3$
 ).
).
We also performed a shot without $B$ -field, which resulted in a density of $n_e/n_c \sim 2\,\%$
 , according to $4\omega$
 probe interferometry (figure 5c) and self-TS from the SABS diagnostic (figure 5d). At this density, the time-averaged temperature inferred from XRS is ${\sim} 750$
 eV. A FLASH simulation at $n_e/n_c {\sim}2\,\%$
 peak electron density shows electron temperatures ${\sim} 60\,\%$
 lower than at $n_e/n_c \sim 13\,\%$
 , which is consistent with the XRS measurements. These plasma conditions correspond to a very large $k \lambda _D \sim 0.5$
 , which pertains to a strongly Landau damped regime. We can also see in figure 4 that the average reflectivity is almost zero at this very low density. Hence, as expected, no BSRS signal was observed in this shot.
Still, this low density was obtained despite firing at the same gas pressure as the shot at $n_e/n_c \sim 13\,\%$ (figure 5a). We suspect that the nozzle or the gas-jet valve system failed to provide the expected density on this shot. Consequently, due to this pressure–density variability and the limited number of shots at OMEGA-EP, we were not able to compare during this first experiment the BSRS signal of figure 5(a) with an unmagnetized shot at a similar density.
Moreover, the broad continuous BSRS signal observed in the magnetized shot (figure 5a) advocates for a narrower range of plasma conditions throughout the excitation beam interaction to make a clearer comparison with an unmagnetized shot. The mitigation of BSRS by the magnetic field is a kinetic effect that requires targeting of a stringent range of $k \lambda _D$ conditions. Being able to carefully characterize the MHD effects on plasma conditions is thus critical when designing an experiment that aims at demonstrating the kinetic mitigation of BSRS by an external magnetic field. We showed that FLASH MHD simulations can successfully predict the average plasma conditions to make predictions. Besides, post-processing the MHD results using a weighting function specially designed to mimic the sensitivity of BSRS to plasma conditions allows for evaluating the effect of plasma inhomogeneity on the scattered light spectra, with and without applied $B$
 -field. Finally, note that, according to figure 1(b), a higher $B$
 -field strength would help increase the differences in BSRS reflectivity between the cases with and without applied $B$
 -field.
Along these lines, we detail in the next section a series of improvements to the experiments, in particular aiming at reducing the variation of plasma conditions from hydrodynamics, and carry out detailed predictions of the upgraded design using the simulation workflow presented earlier. The workflow consists of post-processing MHD simulations for the designed experiment using the aforementioned weighting function to ‘mimic’ the conditions that BSRS will be sensitive to and then run PIC simulations to calculate synthetic BSRS spectra. Our goal is to show that one can leverage the current capabilities of OMEGA-EP to design an experiment that can unambiguously demonstrate the kinetic mitigation of SRS with an external magnetic field in spite of the magnetization effects on the hydrodynamics, as well as the inherent temporal and spatial variations in plasma conditions.
3 Numerical investigation of the effects of an external $B$ -field on plasma hydrodynamics and kinetic mitigation of BSRS in an upgraded experiment

We propose a revised platform to measure the mitigating effect of the $B$ -field on the BSRS reflectivity in the kinetic regime. As such, this would be the first experiment to directly observe $B$
 -field effects on BSRS at ICF-relevant $3\omega$
 ($\lambda =351$
 nm) wavelengths and kinetic conditions for the SRS instability ($k \lambda _D \sim 0.3$
 ), in line with the kinetic inflation regime of BSRS in indirect drive ICF (Kline et al. Reference Kline, Montgomery, Yin, DuBois, Albright, Bezzerides, Cobble, Dodd, DuBois, Fernández, Johnson, Kindel, Rose, Vu and Daughton2006). The collected data would also contribute to validating and constraining the modelling of BSRS under $B$
 -field influence in PIC codes such as the OSIRIS code.
The strongest mitigating effect for a specified $B$ -field strength occurs for $B$
 perpendicular to the EPW wavenumber $k$
 . Therefore, the MIFEDS coils ideally should be aligned perpendicular to the excitation beam axis (the axis of beam 4 in figure 2). Mitigation is also more significant for stronger magnetic fields. One could generate up to $\sim 30$
 T in the irradiated volume by orienting the MIFEDS coils along the gas-jet axis, while keeping the path of the $4\omega$
 probe beam to the target centre cleared.
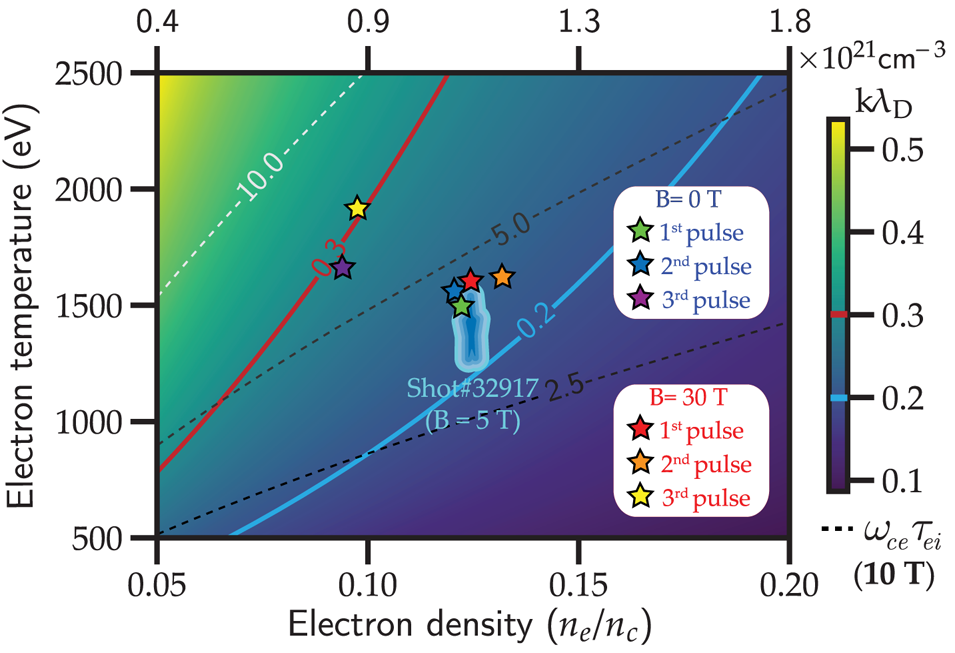
Figure 6 shows the parameter space for $k \lambda _D$ and for the Hall parameter $\omega _{ce} \tau _{ei}$
 for values of electron density and temperature ranging from 5 % $n_c$
 to 20 % $n_c$
 and 500 to 3500 eV, respectively. Note that the blue ‘cloud’ symbol corresponds to the average conditions of the $B=5$
 T shot presented earlier from the first experiment, for which the value of $k \lambda _D$
 for the average temperature is ${\sim }0.23$
 and the Hall parameter is $\omega _{ce} \tau _{ei} \sim 2$
 with $B=5$
 T. The Hall parameter would consequently be ${\sim }12$
 for $B=30$
 T.
T.
Parametric space for $k \lambda _D$ (solid line contours and colour bar) and the Hall parameter $\omega _{ce} \tau _{ei}$
 (dashed line contours, for $B=10$
 T), with the electron density ranging from $5\,\%$
 and $20\,\% n_c$
 ($3 \omega$
 ) and the electron temperature from 500 to 2500 eV. The blue ‘cloud’ symbol represents the average conditions from the magnetized shot of the first experiment. The star symbols represent the estimated conditions at each of the first three 100 ps pulses of the pulse shape proposed for the updated platform at $B=0$
 T and $B=30$
 T.
T.
Given that the experimental observations described above showed that the electron temperature (and thus the value of $k \lambda _D$ ) evolved quickly over the ${\sim }250$
 ps BSRS emission time (figure 3), it is essential to conduct experiments that exercise sufficient control over laser and plasma fluctuations. A dedicated heater beam with a larger phase plate could be used to prepare the plasma prior to the excitation beam interaction. Its larger size would allow for improved uniformity, reducing gradients within the smaller excitation beam spot size, and its lower intensity on target would aid in avoiding filamentation during heating.
Following the heater beam, we furthermore propose a special pulse shape for the main excitation drive that would aid in the interpretation of the BSRS signal by drastically reducing temporal variations of plasma conditions during excitation. The pulse shape, selected from the available pulses of OMEGA-EP, consists of a train of up to six $\sim$ 100 ps pulses separated by $\sim$
 600 ps peak-to-peak (only the first three pulses should generate measurable BSRS in the present design). Note that the temporal resolution of the SABS diagnostic is ${\sim }80$
 ps Full Width at Half Maximum (FWHM), hence the evolution within the duration of 100 ps pulses would not be resolved. However, the separation between pulses would be large enough to generate discrete bursts of BSRS with a clear separation in time on the SABS diagnostic. As we observed in the magnetized shot of the first experiment (figure 5a), the continuous and rapid change of plasma temperatures makes it difficult to associate the BSRS signal with a given set of plasma conditions. In contrast, the quasi-discrete nature of the BSRS excited by short 100 ps pulses would allow for correlating the spectra to better-defined plasma conditions for each pulse that could then be compared with theory and modelling for unmagnetized and magnetized shots.
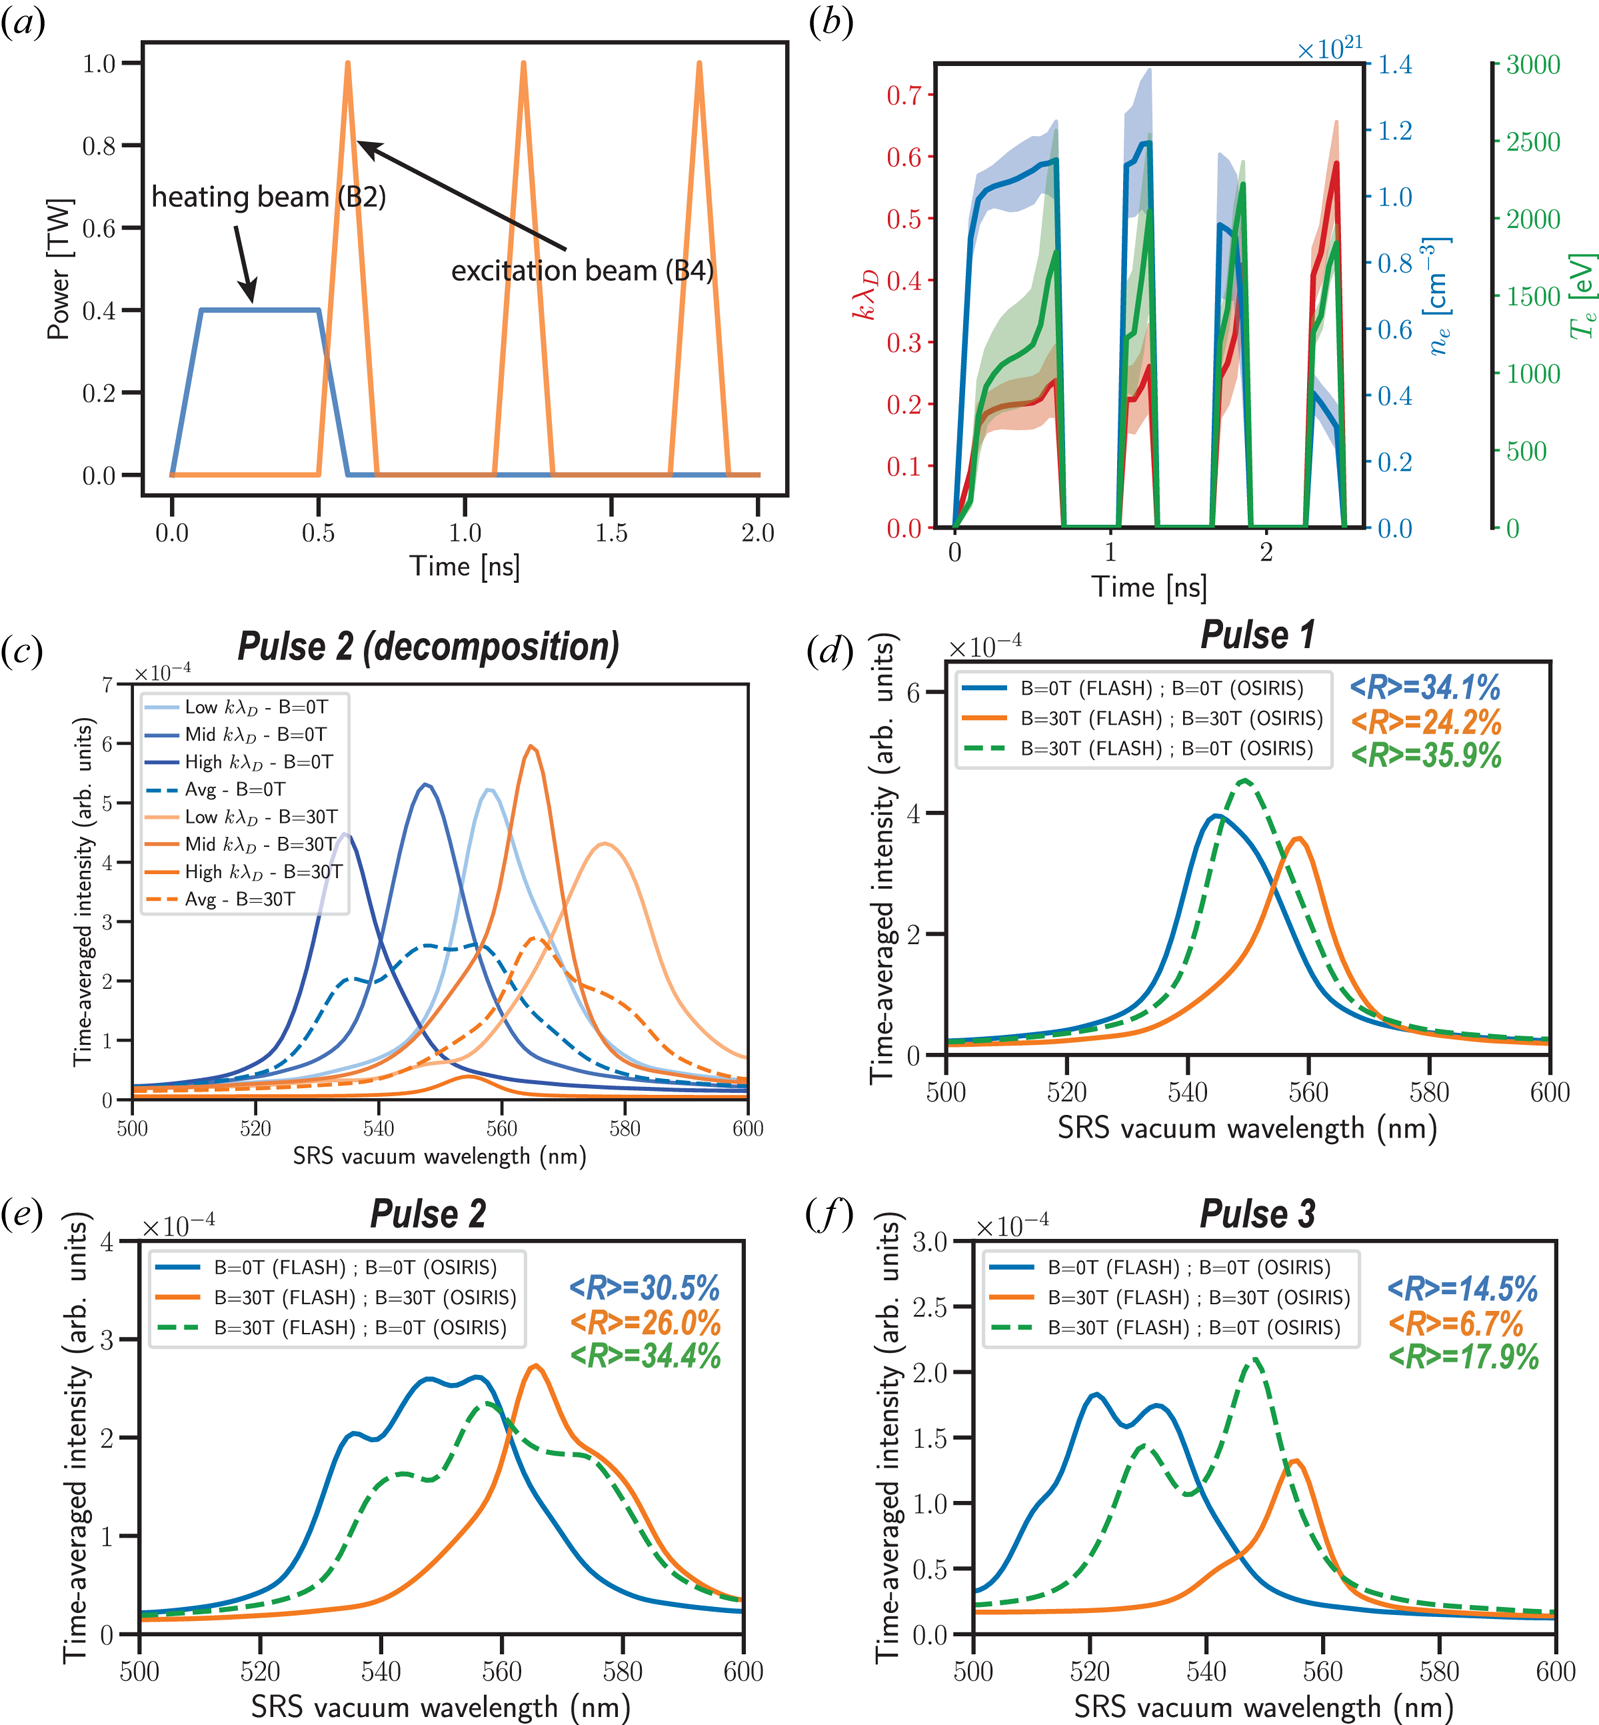
Based on these considerations, we show in figure 7 the pulse shape (a) and the conditions ($n_e$ , $T_e$
 , $k \lambda _D$
 ) for each of the first three 100 ps pulses for $B=30$
 T (b), as inferred from two-dimensional FLASH MHD simulations. Note that the weighting of the plasma conditions by the laser energy deposition causes the reported quantities to drop to zero when no laser is in the simulation box, i.e. between pulses. The average plasma conditions for $B=0$
 T and $B=30$
 T at the peak of each pulse extracted from FLASH using the designed BSRS weighting function are illustrated with star symbols on the density/temperature phase-space graph of figure 6, and are also reported with standard deviation in table 1.
(a) Pulse shape of the proposed experiment. (b) Evolution of the electron density, electron temperature and $k \lambda _D$ from a two-dimensional FLASH MHD simulation with $B=30$
 T. Time-averaged light spectral density calculated by OSIRIS-1D for the conditions of the first (d), second (e) and third pulses (f), at 0 T (blue solid line) and 30 T (orange solid line). In (c), we show the decomposition of the synthetic BSRS spectra of the second pulse, obtained from the mid-$k \lambda _D$ $(n_{e,\mathrm {avg}},T_{e,\mathrm {avg}})$
 , the low-$k \lambda _D (n_{e,\mathrm {avg}}+\sigma _{n_e},T_{e,\mathrm {avg}}-\sigma _{T_e})$
 and high-$k \lambda _D (n_{e,\mathrm {avg}}-\sigma _{n_e},T_{e,\mathrm {avg}}+\sigma _{T_e})$
 conditions, where $\sigma$
 is the standard deviation extracted from FLASH for the respective quantity. The spectra in green dashed lines are obtained using the FLASH magnetized ($B=30$
 T) conditions, but without magnetic field in OSIRIS, thereby isolating the influence of magnetohydrodynamic on the BSRS spectra excluding kinetic effects. Note that all the spectra displayed in this figure account for a spectral resolution of 5 nm FWHM. The average BSRS reflectivity $\langle R \rangle$
 is displayed in the plot legend for (d–f). The conditions extracted from FLASH for the first three pulses of the proposed excitation beam are shown in table 1 and the average conditions are also illustrated with star symbols of different colours in the parametric space graph of figure 6 for 0 T and 30 T.
Plasma conditions (average and standard deviation) extracted from the two-dimensional FLASH MHD simulation for the three pulses of the excitation beam, for $B=0$ T and $B=30$
 T.
T.
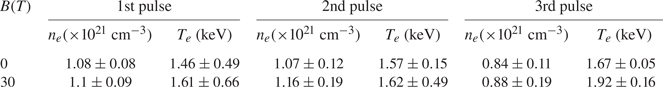
Note that, while the average plasma conditions can change by up to ${\sim }15\,\%$ in temperature and ${\sim }9\,\%$
 in density between unmagnetized and magnetized shots due to MHD effects, the average value of $k \lambda _D$
 only changes by maximum ${\sim }5\,\%$
 . The other sources of variations to consider are (i) the temporal variations within the excitation pulse duration, and (ii) the spatial variations due to inhomogeneities in plasma conditions in the interaction region. Note that temporal variations are marginal for 100 ps short pulses compared with spatial variations.
To investigate the physics of SRS under the proposed laser and plasma conditions, we used the electromagnetic PIC code OSIRIS 4.0 in one dimension. We accounted for the spatial inhomogeneities of plasma conditions in the interaction volume by considering the average and lower/upper bounds in $k \lambda _D$ obtained from the FLASH weighted quantities. All simulations were one-dimensional in Cartesian geometry. For each pulse, the plasma was initialized with the conditions extracted from MHD and weighted by the laser energy deposition and BSRS reflectivity, respectively at (i) the average electron temperature ($T_{e,\mathrm {avg}}$
 ) and average electron density ($n_{e,\mathrm {avg}}$
 ) called ‘mid-$k \lambda _D$
 ’, (ii) at $T_{e,\mathrm {avg}}+\sigma$
 and $n_{e,\mathrm {avg}}-\sigma$
 , called ‘high-$k \lambda _D$
 ’ and (iii) at $T_{e,\mathrm {avg}}-\sigma$
 and $n_{e,\mathrm {avg}}+\sigma$
 , called ‘low-$k \lambda _D$
 ’, where $\sigma$
 is the corresponding standard deviation (see table 1). In all cases, the electron density profile had a slight linear gradient, $n_e = [0.98n_{e,\mathrm {avg}},1.02n_{e,\mathrm {avg}}]$
 , in order to limit the amount of forward SRS and focus on backward SRS. 1024 particles per cell with cubic interpolation, and a total of 8192 cells, were used to simulate a domain 100 $\mathrm {\mu }$
 m long for a total time of 6 ps. Ions were immobile so as to focus purely on SRS. We simulate a laser beam with a wavelength of 0.351 $\mathrm {\mu }$
 m and a constant intensity of $10^{15}$
 W cm$^{-2}$
 , with a rise time of 300 $\omega _0^{-1}$
 . The laser propagated in $\hat {x}$
 , was polarized in the $\hat {z}$
 direction and for simulations with an externally imposed magnetic field, $B=B_0\hat {z}$
 with $B_0=30$
 T. The boundaries were absorbing for the fields and had the plasma extending up to the boundary in all directions, with thermal bath boundaries for the particles.
In figure 7(c), we show the light spectra calculated for the low, mid and high $k \lambda _D$ conditions extracted from FLASH at the peak of the second pulse, at $B=0$
 T (shades of blues) and $B=30$
 T (shades of orange). The spectra in dashed lines are obtained by averaging the three individual spectra at the three FLASH conditions. Note that we chose to decompose the second pulse here as an example: the same methodology was applied for the two other pulses to calculate an average spectrum from the span of plasma conditions. The comparison of the $B=0$
 T and $B=30$
 T spectra shows that the $B$
 -field is mainly effective in reducing the high $k \lambda _D$
 component (lower wavelengths here due to the density governing the scattered wavelength position), that is $k \lambda _D \sim 0.29$
 here. On the other hand, at the low $k \lambda _D \sim 0.17$
 , the reflectivity is not significantly affected by the magnetic field. This is in line with the expected increasing influence of the magnetic field on BSRS as the plasma becomes more kinetic and $k \lambda _D$
 approaches 0.3. The average spectra have a resulting average reflectivity of $30.5\,\%$
 for $B=0$
 T and $26.0\,\%$
 for $B=30$
 T.
T.
In figure 7, we show the average backscattered light spectra for the first (d), second (e) and third (f) pulses. Note that the average reflectivity can be defined as the area under the time-average spectral intensity curves. Note also that the shifted wavelengths are within the detectable range of the SABS diagnostic, which extends from ${\sim }400$ to ${\sim }800$
 nm, with a resolution of ${\sim }5$
 nm FWHM using a spectrometer slit width of $400\ \mathrm {\mu }$
 m (value of the first experiment). The spectra from simulations are convoluted by this spectral resolution. The spectra in blue solid lines are obtained from the FLASH unmagnetized conditions and without $B$
 -field in OSIRIS. The spectra in orange solid lines are obtained from the FLASH magnetized conditions and with $B=30$
 T in OSIRIS. To check the MHD influence on plasma conditions and the resulting BSRS light spectra, we also performed simulations using the magnetized FLASH conditions but turning off the external $B$
 -field in OSIRIS. This is equivalent to accounting for hydrodynamic effects from MHD on BSRS, yet without accounting for the kinetic effects due to the $B$
 -field in the PIC code. The results are shown by dashed green lines in (d–f). By comparing the blue $B=0$
 T and orange $B=30$
 T spectra in solid lines, it appears clearly that the BSRS reflectivities are reduced when applying the $B$
 -field. The average reflectivities are reduced by $29\,\%$
 , $13\,\%$
 and $54\,\%$
 , for the first, second and third pulses, respectively. Moreover, based on the comparison of the orange $B=30$
 T spectra with the spectra in green dashed lines described above, it demonstrates that this reduction is caused by kinetic mitigation.
A slight increase of average BSRS reflectivity is observed for the spectra in green dashed lines compared with the blue $B=0$ T spectra, which may look counter-intuitive given that one would expect a reduction of BSRS reflectivity in a hotter plasma. This is indeed what would occur if the density was constant between magnetized and unmagnetized cases due to the higher $k \lambda _D$
 caused by the temperature increase. However, the constant density assumption is not valid. We observe instead a higher average density and a wider range of plasma conditions when magnetizing the plasma (see table 1), which leads instead to a slight increase in the average BSRS reflectivities. The reader can refer to figure 4 to see the competition between a higher density and a higher temperature in terms of BSRS reflectivity and conclude that the higher density has indeed a stronger impact.
4 Conclusions
The PIC simulations have shown that a small (in terms of cyclotron frequency compared with the plasma frequency) magnetic field of a few tens of Tesla can significantly reduce the BSRS reflectivity in the kinetic regime of the instability ($k \lambda _D {\sim}0.3$ ), due primarily to the enhanced dissipation of EPWs propagating perpendicular to a magnetic field, as well as to reduced collective SRS for multi-speckle beams. We designed a platform for the OMEGA-EP facility based on a gas-jet target, with the possibility of applying an external $B$
 -field up to 20–30 T. The first measurement of a BSRS time-resolved spectrum is presented and used to benchmark a predictive numerical workflow based on MHD and PIC simulations.
Improvements to the platform are proposed to more readily identify temporally discrete BSRS spectra for different plasma conditions. Explicitly, the use of a dedicated heater beam and a custom excitation beam pulse shape consisting of a train of short pulses is shown to strongly improve the uniformity of the plasma and yield quasi-discrete bursts of BSRS at specific times of the plasma evolution, providing the ability to quantify the effect of an external magnetic field on BSRS at various $k \lambda _D$ . We validated our design with simulations showing that $B$
 -field kinetic mitigation of BSRS in the experiment would have a strong enough impact on the backscattered light spectra to be measured, in spite of spatial inhomogeneities in plasma conditions and magnetization effects on the hydrodynamics. We believe that the magnetized gas-jet design presented in this paper will be of great interest to the community for measuring magnetic field effects on various aspects of LPIs and the demonstration of BSRS $B$
 -field mitigation, in particular, will pave the way for other similar studies. Such experiments are of fundamental interest for studying laser coupling and hot electron generation in the context of ICF and exploring the uncharted behaviour of LPIs in magnetically assisted ignition schemes. Finally, to obtain a better understanding of LPIs at a fundamental level and test the validity of PIC simulations, performing experiments and collecting data are essential, especially considering the fact that LPIs experiments are quite scarce, especially under ICF-relevant laser conditions.
Acknowledgements
The experiment was conducted at the Omega Laser Facility at the University of Rochester's Laboratory for Laser Energetics with the beam time through the National Laser Users’ Facility (NLUF) program.
Editor Troy Carter thanks the referees for their advice in evaluating this article.
Declaration of interest
The authors report no conflict of interest.
Funding
This material is based upon work supported by the Department of Energy, National Nuclear Security Administration under Award Numbers DE-NA0003842 and DE-NA0003856, the University of Rochester, and the New York State Energy Research and Development Authority.
Data availability statement
The data that support the findings of this study are available upon reasonable request to the corresponding author.


 Open access