


Introduction
Social relationships and the support they provide have been reliably associated with health and quality of life in old age (Berkman et al., Reference Berkman, Glass, Brissette and Seeman2000; Holt-Lunstad, Reference Holt-Lunstad2018; Uchino et al., Reference Uchino, Bowen, Kent de Grey, Mikel and Fisher2018). Social isolation and insufficient social support are risk factors for morbidity and early mortality (Leigh-Hunt et al., Reference Leigh-Hunt, Bagguley, Bash, Turner, Turnbull, Valtorta and Caan2017) and these effects may become heightened as people age (Cacioppo et al., Reference Cacioppo, Hawkley, Norman and Berntson2011). Consequently, maintaining supportive social connections and being integrated into the community are key contributors to healthy ageing.
Social networks are the structures that provide connection and potential support (Stephens et al., Reference Stephens, Alpass, Towers and Stevenson2011). Individuals are embedded in webs of social relations and interactions which form their social networks, characterised by varying numbers and types of membership between individuals (Litwin and Shiovitz-Ezra, Reference Litwin and Shiovitz-Ezra2011). According to the convoy model (Kahn and Antonucci, Reference Kahn and Antonucci1980), people create relationships with their age-related peers earlier in life and carry these connections with them as they age. However, as people get older, they are less likely to create new convoys of social relationships and social contacts are reduced (Carstensen et al., Reference Carstensen, Fung and Charles2003).
In addition to this natural shrinking in size over time, significant life events can cause disruptions in the structure of social networks. Immigration is one such life transition that can disrupt social networks and family life (Maleku et al., Reference Maleku, España, Jarrott, Karandikar and Parekh2022). When moving to a foreign country, social convoys in the home country may break and some relationships may dissolve. One of the challenges of adaptation for immigrants is to develop new social ties in an unfamiliar environment, while navigating the transformation of existing social relationships into transnational connections. Language difficulties, differences in cultural norms regarding appropriate social behaviours, negative interpersonal experiences and discrimination are only a few of the migration-related challenges that can impede immigrants' ability to build and maintain new relationships (Ward and Szabó, Reference Ward and Szabó2019). Steadily rising trends in international migration combined with a rapidly ageing population structure mean that a growing proportion of people are ageing in a country different to where they were born (McAuliffe et al., Reference McAuliffe and Khadria2019). This is particularly relevant in larger migrant-receiving countries, such as Aotearoa New Zealand. The present study examined the social networks of older immigrants living in Aotearoa New Zealand with a specific focus on identifying upstream (e.g. socioeconomic position) factors that contribute to the development of restricted versus integrated networks and, in turn, the downstream influence of these networks on social support.
Social networks of older immigrants
Numerous typologies have been developed to describe older adults' social networks. Wenger (Reference Wenger1991) used extensive qualitative data to derive a typology of five social networks reflecting restricted – family-dependent, self-contained and private-restricted – and integrated – locally integrated and wider community-focused – network configurations. Informed by Wenger's findings, but utilising quantitative survey data on frequency of interactions, community engagement and marital status, Litwin and Shiovitz-Ezra (Reference Litwin and Shiovitz-Ezra2006) and Fiori et al. (Reference Fiori, Antonucci and Cortina2006) identified social network types described as diverse, friend-, family- and neighbour-focused, community-integrated and restricted among older adults in Israel and the United States of America (USA).
A few studies have also been conducted on social network types in older immigrant samples. In an early investigation, Litwin (Reference Litwin1997) examined how social networks of late-life immigrants transformed from pre- to post-transition. Most people in the study experienced a network shift, moving from networks consisting of mostly non-kin ties (e.g. friend-focused and diffuse ties) to more familial, close kin-restricted networks post-migration. These findings suggest that as people migrate, networks tend to become more restricted and change from connections of choice to connections of necessity.
More recently, Burholt and Dobbs (Reference Burholt and Dobbs2014) have highlighted the importance of considering cultural factors, such as the prevalence of multigenerational living or values related to filial piety in collectivistic societies, in the development of network types. In South Asian immigrants living in the United Kingdom (UK), they found four network types: multigenerational households with either a younger or older family network, family- and friend integrated networks, and non-kin restricted networks. Burholt et al. (Reference Burholt, Dobbs and Victor2018) later confirmed these network types in other communities, including Black Caribbean, Black African and Chinese immigrants living in the UK. Similar configurations were identified by Park et al. (Reference Park, Jang, Lee, Ko, Haley and Chiriboga2015) with Korean older immigrants in the USA, although their classification was further differentiated based on marital status, resulting in six network types: diverse/married, diverse/unmarried, co-residence/married, family-focused, restricted/unmarried and restricted/married.
Following Wenger's typology, the present study aimed to identify social networks of older immigrants living in Aotearoa New Zealand by distinguishing between restricted (e.g. private-restricted, family-dependent, self-contained) and integrated (e.g. locally integrated and wider community-focused) network configurations. Typologies highlight differences in the structure of social networks. However, they tell us little about how networks develop and the pathways through which they influence health and wellbeing. Berkman et al. (Reference Berkman, Glass, Brissette and Seeman2000) proposed a conceptual model that links social networks to both upstream, macro-level sociopolitical factors and downstream, micro-level psychological mechanisms. At the macro level, social and cultural influences create the conditions for the development of social networks. At the micro level, networks provide opportunities for social support and engagement, which in turn impact health through behavioural, psychological and physiological pathways.
Upstream influences: sociodemographic and contextual factors
We need to consider both cultural differences in how people build social networks and the social conditions of the receiving society. It has been widely demonstrated that cultural values of individualism and collectivism influence the way people relate to others around them (Markus and Kitayama, Reference Markus and Kitayama1991; Na et al., Reference Na, Kosinski and Stillwell2015). In individualistic cultures, people tend to view the self as a unique, independent entity that is separated from others. This independent self-construal is conducive to more private, egocentric and self-contained social networks that are less tightly integrated into the wider community. In collectivistic cultures, on the other hand, people tend to experience the self as part of a wider net of social relationships with social engagement and interpersonal harmony as valued goals. This construal of the self as interdependent and connected to others leads to social networks that are sociocentric, collective, relational and, thus, more tightly integrated into the wider community.
Based on these differences in broad cultural value orientations, it is expected that those immigrating from an individualistic context would be more likely to create restricted, private and self-contained social networks. In contrast, community-based and integrated networks would be more prevalent among immigrants of a dominantly collectivistic cultural origin. Similar cultural differences in social networks have been demonstrated by Szabo et al. (Reference Szabo, Stephens, Allen and Alpass2018) who found that older Māori (the indigenous population of Aotearoa New Zealand) were almost twice as likely to have a locally integrated or a wider community-based network compared to their age-related non-Māori peers.
In addition to cultural norms, social networks are shaped by social structures that pattern access to resources (e.g. education) and economic opportunity (e.g. employment). Previous research has shown that the structure, size, proximity and composition of social networks are not only conditioned by education and occupational grade, but these effects become greater as people age (Ajrouch et al., Reference Ajrouch, Blandon and Antonucci2005). Immigrating to a new country frequently results in downward social mobility due to limited access to employment, educational qualifications not recognised in the host society, language difficulties and inability to access opportunities through existing social networks (Reyneri and Fullin, Reference Reyneri and Fullin2011). Palmberger's (Reference Palmberger2017) work with older Turkish labour migrants in Austria highlighted socioeconomic inequities, including insecure work, low income, prolonged unemployment and precarious living conditions, as significant barriers to social connection across the lifecourse. These findings indicate that lower socioeconomic position is likely to lead to the development of more restricted network types.
Importantly, these upstream influences of cultural and socioeconomic factors are not static. The extent to which they foster or hinder the development of social networks varies across people's lives and with social change. Length of residence and age at immigration are key determinants of social networks for immigrants. Previous research, including experiences of more recent immigrants (Ryan, Reference Ryan2011) and retrospective accounts of older immigrants (Cela and Fokkema, Reference Cela and Fokkema2017), suggests that social isolation is more prevalent at the earlier stages of migration and building social ties proves to be particularly challenging for late-life immigrants. More time spent in the receiving country means more opportunities to make new connections and engagement with host nationals (Millán-Franco et al., Reference Millán-Franco, Gómez-Jacinto, Hombrados-Mendieta, González-Castro and García-Cid2019).
Downstream influences: social support
The provision of social support is a core function of social networks and one of the main mechanisms through which social networks impact health and wellbeing (Berkman et al., Reference Berkman, Glass, Brissette and Seeman2000; Wills and Ainette, Reference Wills and Ainette2012). A common thread across the network typologies identified in the literature is the distinction between networks integrated into the wider community and those restricted to contacts with close friends and family. The few studies on the social support provided by different network types have shown that these more restricted networks provide less perceived support. For example, using Wenger's network typology, Stephens et al. (Reference Stephens, Alpass, Towers and Stevenson2011) showed that private-restricted, local self-contained and family-dependent networks provided the least social support (assessed as social provisions). A later study in Aotearoa New Zealand also showed that private-restricted and family-dependent networks were predictors of loneliness among a community sample of older people while more integrated networks were not (Stephens et al., Reference Stephens, Phillips, Allen, Beagley and Alpass2019). In general, findings from population studies point to greater levels of loneliness and feelings of social isolation among older immigrants when compared to their native-born peers (Wu and Penning, Reference Wu and Penning2015), even when social embeddedness in the family is high (Fokkema and Naderi, Reference Fokkema and Naderi2013). This is corroborated by qualitative research showing that older immigrants often report feeling isolated from the wider community (Ip et al., Reference Ip, Lui and Chui2007; Cela and Fokkema, Reference Cela and Fokkema2017; Park et al., Reference Park, Morgan, Wiles and Gott2019).
However, the association of restrictive network types with lower perceived support and loneliness may not be universal. Cultural differences in social connection and networks (Litwin, Reference Litwin1997; Burholt and Dobbs, Reference Burholt and Dobbs2014; Ramos and Karl, Reference Ramos and Karl2016; Burholt et al., Reference Burholt, Dobbs and Victor2018) suggest that different types may be differently beneficial for people from different cultural backgrounds. A longitudinal study in Aotearoa New Zealand found that Māori reported higher engagement in their social networks than non-Māori, but less perceived social support (Stephens et al., Reference Stephens, Noone and Alpass2014). In regard to health, Litwin (Reference Litwin2006) compared three cultural groups in Israel to show differences in the association of social network types and self-rated health between those of the majority Jewish culture in Israel, Arab-Israelis and new immigrants. Specifically, for new immigrants the association between contact frequency and health was reduced, while the protective effect of social support was enhanced when compared to members of the majority group. Importantly, Litwin's study focused on self-rated health as a distal outcome of social networks and it is unclear whether differential effects extended to social support as well. The general paucity of empirical research on the well-theorised association between social networks and perceived social support (Berkman et al., Reference Berkman, Glass, Brissette and Seeman2000) among immigrant groups highlights the need for further enquiry.
The literature to date suggests potential moderators of the relationship between social network types and perceived social support. Compared to younger generations, older adults are generally more satisfied with smaller networks that consist of close, intimate and meaningful relationships (Lansford et al., Reference Lansford, Sherman and Antonucci1998). An important characteristic of social networks in older ages that impacts the perceived level of social support is the presence of a spouse (Chen and Feeley, Reference Chen and Feeley2014; Štípková, Reference Štípková2021). Previous studies showed that older immigrants without a partner were at a greater risk of reporting loneliness or feelings of social isolation, especially when living alone (Wu and Penning, Reference Wu and Penning2015; Park et al., Reference Park, Morgan, Wiles and Gott2019). On the other hand, the study by Burholt et al. (Reference Burholt, Dobbs and Victor2018) found that unpartnered (never married, divorced or widowed) older immigrants were more likely to have a community-based network that consisted of mostly non-kin members, such as friends and neighbours.
The context of Aotearoa New Zealand
In Aotearoa New Zealand, immigrants account for around 27 per cent of the population aged 65 or older. Most older immigrants were born in the UK, Ireland and continental Europe (55%), followed by Asia (20%), the Pacific Islands (12%), the Middle East and Africa (5%), Australia (5%) and North America (3%). There are large differences across groups based on both length of residence and place of residence. Around 90 per cent of older adults from the UK, Ireland, continental Europe and Australia have been in Aotearoa New Zealand for over 20 years, whereas the corresponding figure in Pacific, North American, Asian, and Middle Eastern and African groups is 76, 71, 52 and 47 per cent, respectively. The majority of older immigrants from the Pacific Islands (84%), Asia (78%), and the Middle East and Africa (59%) reside in two large urban areas (Wellington and Auckland regions), compared to 38 per cent of older immigrants from North America, 39 per cent from Australia, 42 per cent from the UK and Ireland, and 45 per cent from continental Europe (Statistics New Zealand, 2018).
Summary of research aims and hypotheses
The focus of the present study was to investigate the social networks of older immigrants living in Aotearoa New Zealand by distinguishing between restricted and integrated network configurations. Based on previous investigations (e.g. Litwin, Reference Litwin1997; Burholt and Dobbs, Reference Burholt and Dobbs2014), we expected to find restricted networks to be more prevalent than integrated networks (Hypothesis 1).
Further, we investigated upstream and downstream correlates of social networks. Upstream, we expected to find differences based on individualistic versus collectivistic culture of origin (Burholt and Dobbs, Reference Burholt and Dobbs2014; Na et al., Reference Na, Kosinski and Stillwell2015), socioeconomic factors (Palmberger, Reference Palmberger2017) and length of residence (Cela and Fokkema, Reference Cela and Fokkema2017; Millán-Franco et al., Reference Millán-Franco, Gómez-Jacinto, Hombrados-Mendieta, González-Castro and García-Cid2019). Specifically, we expected individualistic culture of origin, lower socioeconomic position and shorter length of residence to be predictive of having a restricted network (Hypotheses 2–4).
Downstream, we examined associations with the provision of social support (Wenger, Reference Wenger1997; Stephens et al., Reference Stephens, Alpass, Towers and Stevenson2011) and the protective influence of partner status (Štípková, Reference Štípková2021). It was expected that having a restricted network would be associated with lower levels of social support (Hypothesis 5) but having a partner would buffer the negative influence of restricted networks (Hypothesis 6).
Method
Design and participants
Data were drawn from Wave 1 of the New Zealand Health, Work and Retirement Study (NZHWR). The NZHWR surveys adults aged 55 years or older every two years on their health, social relationships, work and economic wellbeing (for more information on the design and sampling frame, see Allen et al., Reference Allen, Alpass, Stephens, Gu and Dupre2019). In Wave 1, a random sample of 13,044 adults aged 55–70 was drawn from the New Zealand electoral roll. Of the 6,634 respondents who returned the survey in Wave 1, N = 568 (46% female) immigrated to Aotearoa New Zealand after the age of 18. Analyses were based on this sample. The mean age of participants was 61 years (standard deviation (SD) = 4.7; 30% over the age of 65) and they had been in Aotearoa New Zealand for a mean of 28.5 years (SD = 12.5). Most participants (76%) immigrated before the age of 40 and 87 per cent had lived in Aotearoa New Zealand for more than 10 years at the time of data collection. Participants originated from a wide range of contexts, with the majority (69%) having a European heritage (e.g. Irish, Dutch, British), followed by those of Asian heritage (13%; e.g. Chinese, Indian, Filipino), Pacific Peoples (10%; e.g. Samoan, Fijian, Tongan) and other ethnocultural affiliations (8%; e.g. South American, Middle Eastern). There were 22 participants (4% of the sample) who did not indicate their country of origin. Most respondents were partnered (77.5%; i.e. either married or in a de facto relationship), in paid employment (55%) and living in an urban area (86.5%). Qualification levels ranged from no qualification (18.5%) through secondary (31%) and trade (30%) certificates to tertiary degrees (20.5%).
Measures
Sociodemographic and contextual controls
Sociodemographic and contextual variables included age group (0 = under 65, 1 = 65+), gender (0 = female, 1 = male), partner status (0 = not partnered, 1 = partnered), length of residence (measured in years), country of origin (0 = collectivistic, 1 = individualistic), employment status (0 = retired or not in paid employment, 1 = in paid employment), education level (0 = no formal education, 1 = formal education), urban–rural residence (0 = residing in a rural area with a population less than 1,000, 1 = residing in an urban area with a population of at least 1,000) and economic living standards. Country of origin was categorised into individualistic (75%) and collectivistic (25%) cultural background following Hofstede's classification of countries based on the cultural dimension of individualism versus collectivism (Hofstede et al., Reference Hofstede, Hofstede and Minkov2010; Hofstede, Reference Hofstede2011). Countries are scored between 0 and 100. Scores closer to 100 indicate greater individualism, whereas scores closer to 0 indicate greater collectivism. In this study, countries scoring above the mid-point of 50 were categorised as individualistic and countries scoring below the mid-point of 50 were categorised as collectivistic. Economic living standards were assessed with the short-form Economic Living Standards Index (ELSI-SF; Jensen et al., Reference Jensen, Spittal and Krishnan2005), a 25-item non-monetary measure of socioeconomic status designed for the context of Aotearoa New Zealand. A composite score is calculated by summing all items (range = 0–31), with higher scores indicating better economic living standards.
Social networks
The Practitioner Assessment of Network Type (PANT) is a scoring system of social network typologies developed by Wenger (Reference Wenger1991). It consists of eight items measuring three domains of social networks: distance, interactions and engagement. Physical distance to nearest children, siblings and other relatives is assessed by three items on a six-point scale (0 = don't have children/not living, 1 = same house/within 1 kilometre (km), 2 = 1–5 km, 3 = 6–15 km, 4 = 16–50 km, 5 = 50+ km). Frequency of interactions with family, friends and neighbours is assessed with three items on a six-point scale (1 = never/I have none, 2 = 2–3 times a week, 3 = at least weekly, 4 = at least monthly, 5 = less often, 6 = daily). Engagement is assessed with two items asking participants to indicate the frequency with which they attend community and religious activities on a three-point scale anchored at 1 = never, 2 = occasionally and 3 = regularly. The construct validity of the PANT has been supported among older adults in Aotearoa New Zealand (Szabo et al., Reference Szabo, Stephens, Allen and Alpass2018).
Social support
The extent to which participants derive adequate social support from their social networks was assessed with the Social Provisions Scale (SPS; Cutrona and Russell, Reference Cutrona and Russell1987). The SPS consists of six domains: (a) attachment, i.e. having emotionally close and intimate relationships that foster a sense of security; (b) social integration, i.e. having a strong sense of belonging to a group or community; (c) reassurance of worth, i.e. feeling valued and acknowledged; (d) reliable alliance, i.e. having social relationships that can be counted on for help if needed; (e) guidance, i.e. being able to seek and give advice; and (f) opportunity for nurturance, i.e. providing care for others and the sense that others need the person's help, each measured with four items using a four-point scale anchored at 1 = strongly disagree and 4 = strongly agree. All six subscales yielded acceptable reliability: Reliable alliance (α = 0.73), Attachment (α = 0.72), Guidance (α = 0.79), Opportunity for nurturance (α = 0.70), Social integration (α = 0.70) and Reassurance of worth (α = 0.70). All correlations between subscales were significant at the p < 0.001 level and ranged from 0.37 (between Guidance and Opportunity for nurturance) to 0.76 (between Guidance and Reliable alliance). A summary score of social provisions was derived by summing all items (range = 24–96, α = 0.92).
Data analysis
Analyses were conducted in Mplus7 (Muthén and Muthén, Reference Muthén and Muthén2017). Responses to the PANT were subjected to a latent profile analysis (LPA). Models with increasing numbers of profiles were estimated and evaluated based on a combination of indices. The adjusted Bayesian Information Criterion (aBIC) and the adjusted Lo-Mendell-Rubin Adjusted Likelihood Ratio Test (aLMR-LRT) were used to determine whether a model with k + 1 profiles fits the data better compared with a model with k number of profiles. Lower aBIC and significant LMR-LRT indicate improved fit (Nylund et al., Reference Nylund, Asparoutiov and Muthen2007). Entropy and posterior membership probabilities were examined to assess the extent of uncertainty around classifying individuals into profiles, with higher values indicating less classification uncertainty (Clark and Muthén, Reference Clark and Muthén2009). In addition, emerging profiles were expected to be meaningful and represent at least 5 per cent of the total sample (Ram and Grimm, Reference Ram and Grimm2009).
Logistic regressions were calculated to estimate the association between sociodemographic and contextual variables and network types. A multiple regression analysis was used to test the relationship between network types and provision of social support, and the moderating effect of partner status. Sociodemographic and contextual variables were entered to control for upstream influences. Missing data were handled with the full information maximum likelihood function (FIML) and Monte Carlo integration. FIML is an estimation strategy that allows the estimation of parameters when missing data are present, so that all available information can be used for model estimation. FIML requires data to be missing at random.
Results
Missing data
Missingness on the PANT items ranged between 2.7 and 10.8 per cent. Little's test indicated that data were missing completely at random; χ2(203) = 187.594, p = 0.774. Missingness in the social provisions scale ranged between 1.7 and 1.9 per cent. Little's test indicated that data were missing completely at random; χ2(10) = 11.812, p = 0.298. Consequently, FIML could be used to handle missingness in the LPA and multiple regression. Age, gender, place of residence and length of stay did not have missing data. Missingness on the remaining categorical predictor variables was low (between 1.5 and 5%) and was handled with Monte Carlo Integration in the logistic regression.
Latent profile analysis
Models with increasing numbers of profiles were estimated. Model fit improved up until the four-profile solution (Table 1). The model with five profiles yielded a non-significant LMR-LRT and two groups represented less than 5 per cent of the total sample. The four-profile solution produced well-separated profiles with an entropy of 0.73 and posterior classification probabilities of 0.80 or higher. Prototypical profile configurations are presented in Figure 1. The emerging profiles were meaningful, each representing a substantial proportion (around 10% or more) of the total sample. The first profile (N = 203; 35.8% of the total sample) included participants whose social networks were best described as family-dependent with children living close by, daily interactions limited to children, and no or occasional community engagement. The second profile (N = 62; 10.9%) was characterised by a locally integrated network; family living close by, interactions with family daily, and with friends and neighbours weekly, as well as frequent engagement with religious communities. The third profile (N = 56; 9.9% of the total sample) resembled a wider community-based network with family living within 50 km, interactions with family daily and with friends weekly, and frequent engagement in both religious and other community activities. The fourth and largest profile (N = 246; 43.4% of the total sample) had a private-restricted network. They reported family living more than 50 km away, less than monthly interactions with children, weekly interactions with friends and some interaction (few times a month) with neighbours, and little engagement in any community activities. Profile membership could not be estimated for one participant, because they did not respond to any of the PANT items.
Prototypical social network configurations.
Notes: The y-axis indicates standardised (z) scores (mean = 0, standard deviation = 1). Dotted lines indicate one standard deviation from the mean. The direction of the bars indicates scores above or below the mean. Longer bars represent greater deviation from the mean. Higher scores indicate greater distance from relatives, children and brothers/sisters, more frequent interactions with relatives, friends and neighbours, and more active community involvement.

Results of the latent profile analysis

Notes: N = 567. aLMR-LRT: adjusted Lo-Mendell-Rubin Likelihood Ratio Test. aBIC: adjusted Bayesian Information Criterion. PMP: range of posterior membership probabilities.
Significance levels: * p < 0.05, *** p < 0.001.
Two of the emerging profiles (locally integrated and wider community-based) indicated an integrated network type (N = 118; 21% of the total sample), while the other two profiles (family-dependent and private-restricted) were indicative of restricted network types (N = 449; 79% of the total sample). The two integrated profiles, i.e. the locally integrated and wider community-based networks, accounted for a substantially smaller proportion of the total sample compared to the restricted profiles, i.e. private-restricted and family-dependent networks; therefore, to increase power and reduce the probability of type 2 error, in subsequent analyses we differentiated between integrated and restricted network types. Univariate comparisons indicated that the two restricted and two integrated profiles were comparable in terms of their sociodemographic makeup. Sociodemographic description and comparison of the profiles is reported in Table 2. There were no differences between the two integrated profiles in any of the variables tested. Similarly, there were no differences between the two restricted profiles in any of the variables tested, except place of residence. Those in the private-restricted group were more likely to live rurally.
Sociodemographic description of the network profiles
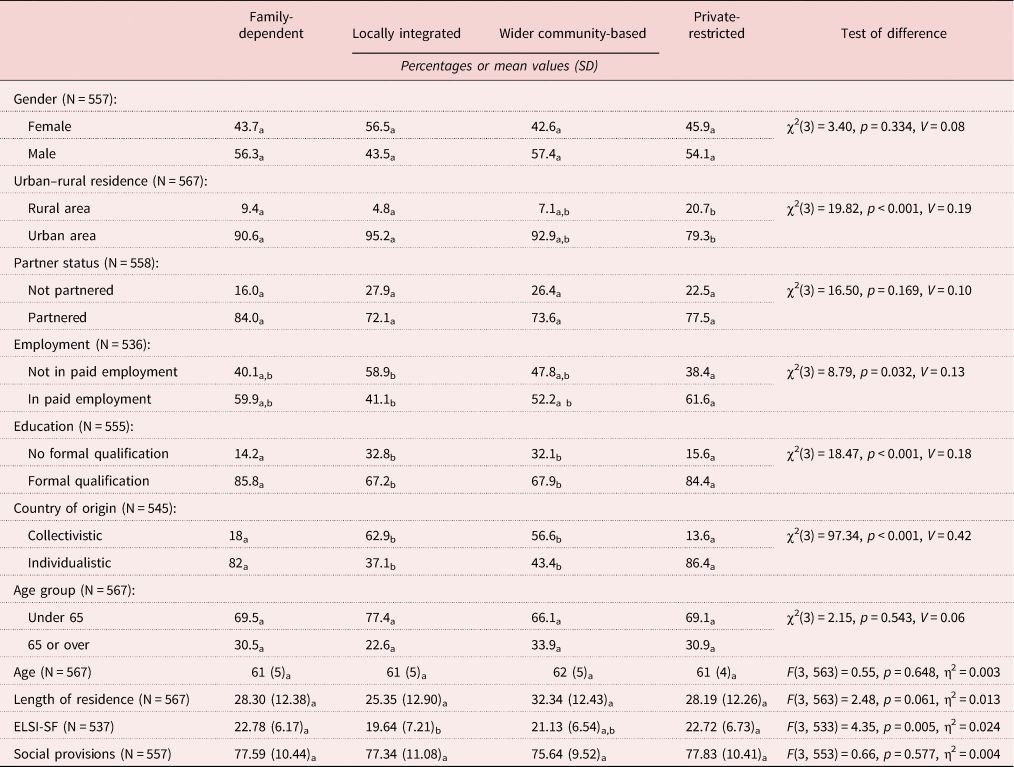
Notes: Each subscript letter denotes a subset of social network profile categories which do not differ significantly from each other at the 0.05 level. SD: standard deviation. ELSI-SF: short form Economic Living Standards Index.
Sociodemographic and contextual predictors of network type
Binary logistic regression indicated two significant effects (Table 3). Length of residence and country of origin emerged as sociodemographic and contextual correlates of network types. A shorter length of residence and immigrating from a more individualistic context were predictive of being assigned to a restricted network.
Coefficients of a multivariate logistic regression predicting a restricted (versus integrated) network type
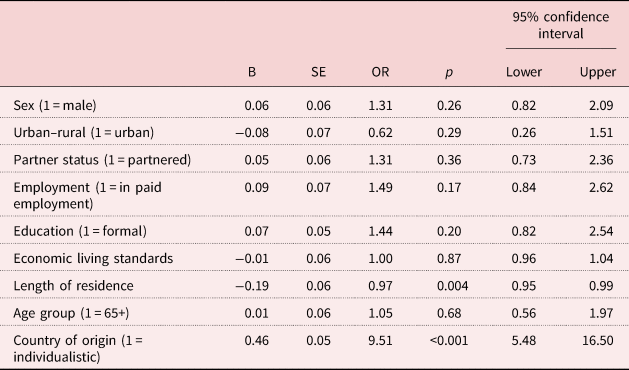
Notes: N = 567. SE: standard error. OR: odds ratio.
Associations with social support
Results from the multiple regression are presented in Table 4. Of the sociodemographic and contextual control variables, being female, being partnered and greater economic living standards were associated with greater levels of social support. In addition, network type emerged as a significant predictor, indicating a negative association between having a restricted network and the provision of social support. The main effect of network type was qualified by the moderating effect of partner status. Post hoc analyses indicated that, having a restricted network was associated with less social support for those unpartnered (β = −0.31, 95% confidence interval (CI) = −11.87, −3.27; p < 0.001) but not for those partnered (β = −0.011, 95% CI = −2.87, −2.28; p = 0.824).
Multiple regression analysis: prediction of provision of social support
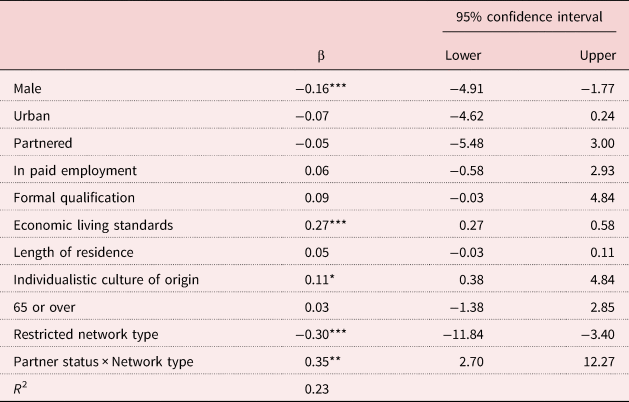
Note: N = 567.
Significance levels: * p < 0.05, ** p < 0.01, *** p < 0.001.
Discussion
Most older immigrants in this study had a restricted network (family-dependent or private-restricted), which supported Hypothesis 1. Although restricted networks are common in older adult samples (Fiori et al., Reference Fiori, Antonucci and Cortina2006; Litwin and Shiovitz-Ezra, Reference Litwin and Shiovitz-Ezra2006), studies consistently find lower levels of social capital and more restricted networks among older immigrants (Litwin, Reference Litwin1997; Völker et al., Reference Völker, Pinkster and Flap2008; Burholt and Dobbs, Reference Burholt and Dobbs2014; Burholt et al., Reference Burholt, Dobbs and Victor2018). Indeed, the analysis by Szabo et al. (Reference Szabo, Stephens, Allen and Alpass2018) reported a substantially lower prevalence (62% versus 79% in the current study) of restricted networks (private-restricted, self-contained and family-dependent) in a general sample of New Zealanders aged 60+. Importantly, the sample of the current study was somewhat younger, and a higher percentage of participants were still in paid employment.
Upstream, socioeconomic factors were not associated with social networks; thus Hypothesis 3 was rejected. However, as expected based on Hypothesis 2, those from a collectivistic culture were more likely to have integrated social networks (Markus and Kitayama, Reference Markus and Kitayama1991; Na et al., Reference Na, Kosinski and Stillwell2015) characterised by more frequent interactions with friends and neighbours, and greater engagement in community activities. Importantly, the PANT items do not assess homophily in network composition. We do not know whether older immigrants in integrated social networks were interacting predominantly with members of their own community, other immigrants or locals. Nonetheless, these findings highlight the importance of considering cultural values and norms related to the development and maintenance of both close and extended social ties. Selective narrowing of social networks (Carstensen et al., Reference Carstensen, Fung and Charles2003) may not be universal and could be a characteristic of network development in more individualistic cultures. Length of residence was also associated with network types in expected ways, supporting Hypothesis 4. Long-term immigrants were more likely to be integrated into their local and wider communities; and conversely, more recent migration was associated with a greater likelihood of having a restricted network. This points to the potential vulnerability of late-life immigrants to social isolation (Litwin, Reference Litwin1997; Cela and Fokkema, Reference Cela and Fokkema2017; Park et al., Reference Park, Morgan, Wiles and Gott2019), and the need for services that support the social integration of older immigrants.
Downstream, as predicted in Hypothesis 5, restricted networks were associated with lower levels of perceived social support after controlling for upstream influences (Wenger, Reference Wenger1997; Stephens et al., Reference Stephens, Alpass, Towers and Stevenson2011). However, partner status moderated the relationship between social support and restricted networks; having a restricted network was associated with diminished social support only for those without a partner. This supports Hypothesis 6 and previous research on the link between living alone and lower perceived support among older immigrants (Wu and Penning, Reference Wu and Penning2015; Park et al., Reference Park, Morgan, Wiles and Gott2019) and the protective effect of spousal support against loneliness among older adults (Štípková, Reference Štípková2021). In addition, recent research points to the critical role partners play in network development for immigrants. Li et al. (Reference Li, Li and Lou2022) found that immigrants who moved with a companion were less likely to make new friends in the host environment. They argued that immigrants are less motivated to actively establish new connections when they can derive the necessary emotional support from their significant other. Taken together, our findings suggest that the prevalence of restricted networks is high among older immigrants in Aotearoa New Zealand; however, having a restricted network does not necessarily mean reduced social support. Partner status is an important modifying factor with compensatory functions.
Limitations and directions for future research
The sample consisted of self-selected participants whose English proficiency was likely high, as they responded to a population survey in English; therefore, not representative of the older immigrant population. Language skills play an important role in the development of local social networks and integration into the wider community (Ip et al., Reference Ip, Lui and Chui2007). In addition, the sample's age range was restricted to those aged 55–70. This meant that analyses were conducted with a young-old sample, with many of them still employed and in relatively good health. In older ages, the need for social support is likely to increase as functional and cognitive ability decline, while networks tend to narrow (Carstensen et al., Reference Carstensen, Fung and Charles2003). A restricted network may have different implications for the old-old compared to the young-old. Exploring how restricted and integrated networks impact social wellbeing for immigrants over different periods of older adulthood warrants further attention in research.
Distance from various family members was one of the factors considered when deriving network types. However, the PANT does not explicitly differentiate between national and transnational family connections, which are strongly linked for immigrants (Koelet et al., Reference Koelet, Van Mol and De Valk2017), or source of contact (i.e. locals, other immigrants and ethnic peers). Disentangling the effects of transnational and local relationships is an important focus for future research, as these connections are likely to afford different levels of social support. Similarly, distinguishing between local, same-ethnic and other-ethnic ties would provide a more nuanced picture of network configurations and their association with social support. Moving forward, the revision of the PANT may be necessary to account for diverse forms of connections (e.g. transnational, online, same-ethnic versus local).
Participants were categorised into broad cultural groups based on Hofstede's classification. While this allowed us to investigate cultural differences in social network development, it is important to acknowledge the limitations of this approach. By assigning people in one of two cultural orientations, we have reduced the large heterogeneity that exists across countries into an artificial dichotomy. Because of the relatively small sample sizes per country, we were unable to do more sophisticated country-based analyses. It would be, however, desirable to conduct more in-depth analyses based on country of origin in the future. Finally, the study assessed perceived levels of social support, not actual or desired levels of social support. Future research should examine the discrepancy between social support received and needed, and how it relates to social networks. It is possible that, although they receive less of it, some people in restricted networks are satisfied with the amount of social support afforded to them by their connections. Conversely, some older immigrants in integrated networks may not have their social support needs met.
Strengths and theoretical contributions
The main strength of this research is its attempt at combining data-driven (bottom-up) and theory-driven (top-down) approaches to understanding an increasingly significant public health issue. On one hand, the hypotheses and the analytic approach were guided by a robust theoretical framework. On the other, the use of LPA allowed us to identify social networks that were a fair representation of the data without forcing specific conceptual configurations. Although Wenger's (Reference Wenger1991) typology distinguishes between five conceptual network types, only four of these could be empirically confirmed in our sample. Equally, this method can enable researchers to uncover specific or unique network types previously not theorised. This approach can be applied across countries and populations to identify both commonly occurring networks and context-specific configurations.
As theorised by Berkman et al. (Reference Berkman, Glass, Brissette and Seeman2000) and supported by the findings of this research, the formation and function of social networks are strongly influenced by social and cultural conditions. As such, the impact of social networks cannot be fully evaluated in isolation from the broader context. There may be differences across receiving countries and immigrant groups regarding which specific upstream and downstream factors have the strongest influence; however, our findings highlight that contextual and individual-level resources should always be considered alongside network types.
Conclusions and implications
The prevalence of restricted networks is high among older immigrants. Our findings suggest that unpartnered older immigrants with a restricted network are more likely to experience diminished social support. There are individual differences in what level of support someone needs, cultural differences in how people build and access social networks, and contextual factors that create social conditions for the development of networks. While a restricted network does not necessarily lead to social isolation, it may be a risk factor. To support our increasingly diverse older adult populations, we need to better understand the complex relationship among network types, social support and social isolation. This requires considering both upstream and downstream factors and their influence on social networks. Research development in this area has potential to inform both community work and policy making. At the micro level, understanding risk factors for social isolation (such as living alone and having a restricted social network) can help community organisations to offer targeted support for the most vulnerable. At the macro level, social policy development may support integration through more equitable distribution of resources and by building social and cultural capital both within and across communities.
Financial support
This work was supported by the Health Research Council of New Zealand (CS and FA, HRC05/311); and a Rutherford Discovery Fellowship (ÁS, RDF-VUW-1901).
Conflict of interest
The authors declare no conflicts of interest.
Ethical standards
Ethics approval was granted by the Massey University Human Ethics Committee (MUHEC). Approval was granted under the following protocol: MUHEC Southern A (05/90): A study of the health of older adults in the transition from work to retirement (2006–2008).


 Open access