

Researchers have long recognized that the mean of replicated measurements is more reliable than a single measurement; that is, it includes less variation due to random measurement error than a single measurement instance( Reference Martorell, Habicht and Yarbrough 1 , 2 ). Consequently, it has become commonplace to include replicate measurements in anthropometric studies. However, many studies neglect to report the reliability of the replicated measurements even though it is a direct indicator of data quality. Lack of reliability not only attenuates measures of association, making it difficult to uncover relationships among anthropometric, environmental and other covariates, but also limits the extent to which anthropometric measurements can assess growth and nutritional status and the effectiveness of therapeutic interventions at the level of the individual child.
The National Children’s Study (NCS) Vanguard was a pilot for a planned cohort study of environmental influences on child health and development. It provided a unique opportunity to assess the feasibility of a data collection strategy executed in a non-clinical setting to capture physical measurements in young children with sufficient reliability for measuring growth over time and for detecting relationships among factors that can affect child health and development.
Drawing on data from the NCS Vanguard, the present study evaluated the reliability and precision of replicate physical measurements taken by the same data collector to ascertain whether using trained data collectors is a viable option for collecting high-quality data in a large-scale field study. Large field studies must maintain participation rates and engagement amidst increasing budget limitations, making home-based data collection by trained data collectors a particularly attractive option( Reference Loscalzo 3 ). Previous studies have relied on anthropometrists or health-care clinicians to gather physical measurements in clinical settings( Reference Johnson, Cameron and Dickson 4 , Reference Yin, Dai and Li 5 ), even though home-based data collection has the potential to decrease costs and reduce participant burden. If measurements can be completed with an acceptable level of reliability by trained data collectors who, as a rule, do not have a medical background, significant savings may be realized.
Methods
Study population and design
The NCS Vanguard protocol included a suite of questionnaires, biological and environmental sample collections, and physical measurements to evaluate the influence of environmental factors on child health. Environmental factors were broadly defined as physical, chemical, biological and psychosocial influences with potential to affect the growth, health and development of children. Participants were recruited in forty locations across the USA using five different recruiting strategies. Twenty-two of those locations were approved to complete the physical measures battery. The study population and recruitment procedures have been described elsewhere( 6 ).
The study was conducted according to the guidelines laid down in the Declaration of Helsinki and all procedures involving human subjects were approved by the Institutional Review Board of the Eunice Kennedy Shriver National Institute of Child Health and Human Development (NICHD). Written informed consent was obtained from all participants. Physical measurements were performed at study visits at ages 5–7, 11–16, 23–28 and 35–40 months. While not all participants completed the entire battery, the sample encompassed males and females, premature and full-term births, and white and non-white children born in the USA.
Physical measures battery
The physical measures included an anthropometry battery as well as systolic and diastolic blood pressure and pulse rate. The anthropometry battery consisted of up to ten measures requiring replicate measurements. Table 1 shows the measurements completed at each collection event. The measures are presented in the suggested sequence of administration; however, the order of collection varied by child to maximize cooperation rates. Study procedures called for measurements to be performed with children wearing only diapers or underwear, or in light indoor clothing (e.g. pyjamas).
Choreography/measures included by each data collection event; National Children’s Study Vanguard performed in twenty-two study locations across the USA, 28 August 2012 to 12 December 2014
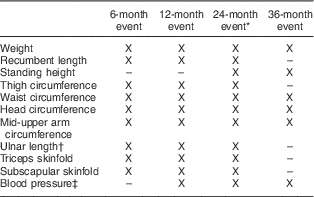
* Prior to 2 July 2014, recumbent length was collected at the 24-month collection event. After 2 July 2014, standing height was collected at the 24-month collection event.
† As of 12 June 2014, ulnar length was collected via two distinct protocols.
‡ As of 15 January 2014, blood pressure measurements were discontinued at the 12- and 24-month collection events.
Weight was measured using the SECA 874 digital scale (Seca, Germany). For infants unable to stand alone, tare weight was measured with the adult caregiver. Recumbent length and standing height were measured using the Lightweight Infantometer (Perspective Enterprises, USA) or HM200P Portstad Portable Stadiometer (Charder, Taiwan). Circumference and length measurements were taken on the right side of the body using the Shorr Productions Insertion Tape (Weigh and Measure, USA) and skinfolds were measured with the Lange Skinfold Calliper (Creative Health Products, USA).
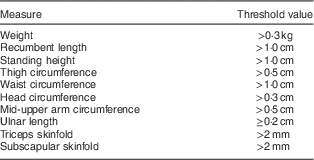
The anthropometric protocol for each event called for a minimum of two replicates per measure; if the first two measurements differed by more than a pre-set threshold value (or limit of tolerance), a third measurement was taken. The threshold values for taking a third replicate measurement are provided in Table 2. A third replicate was required for 6·2 % or 1216 of the 19 610 sets of measurements across the ten anthropometric measures. All children with at least two recorded replicates for a measure were included in the measure-specific analyses.
Threshold values (limits of tolerance) for a third replicate by measure; National Children’s Study Vanguard performed in twenty-two study locations across the USA, 28 August 2012 to 12 December 2014
Following a rest period of 5 min, blood pressure was measured using the GE Carescape V100 Blood Pressure Monitor (GE, USA). During the measure, the child was seated with legs uncrossed and upper right arm supported at heart level and unobstructed by clothing. Data collectors completed blood pressure readings three times for each child, with the first reading excluded from analysis because it generally tends to be unreliable( Reference Pickering, Hall and Appel 7 ). All cases with both a second and third measurement were included in the computations.
Over 100 data collectors were staffed on the NCS over the duration of the study. All data collectors attended in-person physical measures trainings in addition to completing remote, self-directed and refresher trainings. In-person trainings included practice with children as well as mannequins. Data collectors were selected for their skill in participant retention and gaining cooperation, rather than clinical experience with anthropometry or physical measures. Since no previous clinical experience was required on the part of data collectors, data collectors entered training with varied levels of experience. Some had clinical training while others had never taken physical measurements before. In addition, as with all larger field studies, data collectors had differing tenures with the study as well as varying opportunities to perform the anthropometric battery.
Data source
Physical measurements were collected from 28 August 2012 through 12 December 2014 and submitted monthly to a central repository. Measurements of zero, missing values and obvious recording errors were removed from the file prior to analysis. For example, if data entered were outside the measurement device’s recording parameters, such as a standing height of less than 16 cm, they were eliminated from the calculations. Entries that seemed unlikely to be valid given other recorded measurements for the child were retained as it was not possible to determine with certainty whether the values were due to recording errors or to difficulties encountered during the measurement. For example, if the first replicate of mid-upper arm circumference was 6·2 cm for a 6-month-old child, but both subsequent replicate measurements were 16·0 cm for the same child, these data would have been retained as is even though it seems likely that the first measurement was taken in inches rather than centimetres.
Statistical methods
The anthropometric literature offers a number of indices to evaluate the reliability or precision of replicate measurements taken by the same data collector. The present study relied on three of those indices: (i) the technical error of measurement (TEM); (ii) the relative or percentage TEM (%TEM); and (iii) the coefficient of reliability (R).
TEM, often referred to as absolute TEM, is one of the most commonly used indices in the literature. Intra-examiner TEM is derived from differences among replicate measurements taken on the same child within a short span of time by the same data collector( Reference Ulijaszek and Kerr 8 ). When the number of replicate measurements per child is the same across all children, computing intra-examiner TEM for a single data collector involves taking the square root of the average of the measurement error variances,
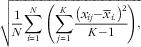 $$\sqrt {{1 \over N}\mathop{\sum}\limits_{i{\equals}1}^N {\left( {\mathop{\sum}\limits_{j{\equals}1}^K {{{\left( {x_{{ij}} {\minus}\bar{x}_{{i.}} } \right)^{2} } \over {K{\minus}1}}} } \right)} ,} $$
where x
ij
is one of K replicate measurements recorded by the data collector on child i, $\bar{x}_{{i}.} $
is the mean of the K replicate measurements taken on child i, and N is the number of children measured by the data collector. The formula can be generalized to handle applications that involve more than one data collector and applications in which the number of replicate measurements varies from child to child, as in the present study.
$\bar{x}_{{i}.} $
is the mean of the K replicate measurements taken on child i, and N is the number of children measured by the data collector. The formula can be generalized to handle applications that involve more than one data collector and applications in which the number of replicate measurements varies from child to child, as in the present study.
For most measures, differences among the replicate measurements simply reflect imprecision in the measurements. For some measures, such as blood pressure and pulse rate, the differences also capture momentary fluctuations in the physiological state of an individual.
The units of TEM are in the same metric as the anthropometric measurements themselves. The magnitude of TEM depends in part on the unit of measurement, which varies across measures, and, in part, on the magnitude of the measurements, which tends to vary with the demographic characteristics of the population under study. As a result, absolute TEM values are not suitable for making comparisons across physical measures with different metrics or across groups with different anthropometric characteristics( Reference Ulijaszek and Lourie 9 ). To address this issue, Norton and Olds( Reference Norton and Olds 10 ) have recommended an index, referred to as relative or percentage TEM, which takes into account the average size of the measurements. Intra-examiner relative TEM is computed by dividing intra-examiner absolute TEM by the mean of the measurements and multiplying the result by 100, which may be more familiar as the CV. The index, which has no units, allows for comparisons across anthropometric measures and populations.
Gore et al.( Reference Gore, Norton and Olds 11 ) have developed target standards (prescribed upper limits) for acceptable values of intra-examiner relative TEM following practical training. The standards have been adopted by the International Society for the Advancement of Kinanthropometry and used by researchers to evaluate the quality of anthropometric measurements collected in their studies( 12 , Reference Perini, Oliveira and Santos Ornellas 13 ). The Society’s accreditation scheme requires anthropometrists to obtain relative TEM values at or below specific target levels. Level 1 accreditation requires demonstration of adequate technical precision in the measurement of seventeen anthropometric dimensions including height, weight, skinfolds and some, but not all, of the circumference and length measures included in the NCS battery. For accreditation at Level 2, anthropometrists must demonstrate adequate technical precision in measuring thirty-nine anthropometric dimensions, including all of those measured in the present study as well as several others. Targets for skinfolds are 7·5 for Level 1 accreditation and 5·0 for Level 2. For all other measures, the target values are 1·5 for Level 1 accreditation and 1·0 for Level 2 accreditation. Ulijaszek and Kerr( Reference Ulijaszek and Kerr 8 ) report that while relative TEM appears to work well for circumferences and skinfolds, correcting for the positive correlation between TEM and the size of the measurements, it tends to overcompensate for length measurements, resulting in a negative correlation between relative TEM and length measurements. This finding suggests that relative TEM is not suitable for comparing length measurements across populations or with other physical measures.
The coefficient of reliability is another index that can be used to compare the relative precision of anthropometric measurements across physical measures and across groups. Intra-examiner reliability is the ability of the same data collector to obtain the same or similar measurements when the measurements are repeated under the same conditions. The coefficient of reliability estimates the proportion of variance in the measurements that is free from measurement error and physiological variation( Reference Ulijaszek and Lourie 9 ). Intra-examiner reliability is calculated by subtracting the proportion of total variance due to measurement error (TEM2/sd 2) from 1·0 to obtain an estimate of the proportion of variance attributable to true differences among those measured. The index ranges from 0·0 to 1·00, with higher values indicating greater reliability. Ulijaszak and Lourie( Reference Ulijaszek and Lourie 9 ) argue that researchers should strive for R>0·95 where possible, but recognize that lower levels of reliability may suffice depending on the objectives of the study.
Formulae for computing the indices can be found throughout the literature on anthropometric measurement error( Reference Ulijaszek and Lourie 9 , Reference Norton and Olds 10 , Reference Mueller and Martorell 14 , Reference Pederson and Gore 15 ). The present study relied exclusively on formulae for intra-examiner TEM and reliability (all replicate measurements on a given child in a given measurement period were taken by the same data collector). All computations were performed with the statistical software package IBM SPSS Statistics Version 20.6.5. As a quality control measure, two statistical programmers generated code for the computations and verified the results across their programs.
ResultsFootnote *
Summary indicators
Descriptive data
For each assessment with replicate measurements completed, Table 3 lists the number of children measured at each age along with the overall mean and sd of the replicated measurements. The number of children measured at each age and on each individual measure varied. Pulse rate was obtained for as few as forty-one children at the 12-month event, while weight measurements were obtained for as many as 1410 during the 24-month event. As expected, the average of the measurements for weight, recumbent length or standing height, ulnar length and the various circumferences increased with age, while the average for the skinfold measures decreased with age. The sd of the measurements reflect the wide range of variation in physical traits found among children at each age, as well as the variation in the replicated measurements.
Intra-examiner absolute technical error of measurement (TEM), relative TEM (%TEM) and reliability (R) for the data collectors as a whole by age of the children at the time of measurement; National Children’s Study Vanguard performed in twenty-two study locations across the USA, 28 August 2012 to 12 December 2014
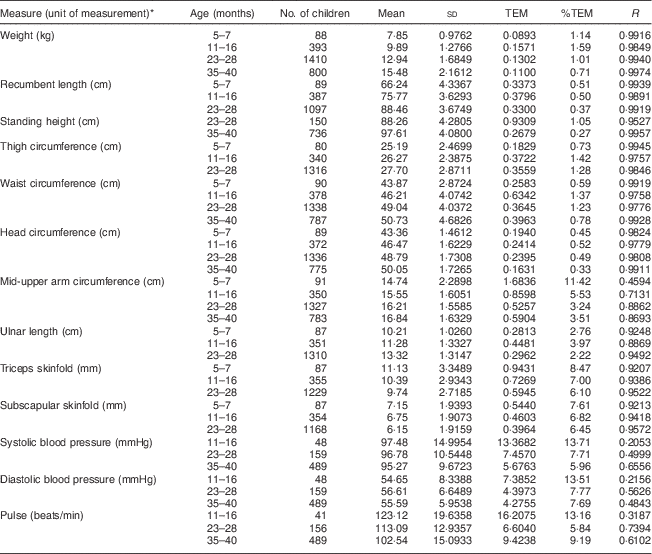
* For the blood pressure and pulse rate measures, only the second and third replicate measurements were included in the calculations. The computations for all other measures took into account all three measurements.
Absolute technical error of measurement
The results of the reliability analysis for the data collectors as a whole are presented in Table 3. The table lists estimates of absolute TEM (TEM), relative TEM (%TEM) and the coefficient of reliability (R) for each physical measure at each event.
Within each physical measure, TEM varies by age. This variation reflects differences in the precision of the measurements and differences in the anthropometric characteristics of children as they age. Within a measure, larger values of TEM tend to be associated with larger mean values, a common pattern reported in the anthropometric literature( Reference Ulijaszek and Lourie 9 ). There are, however, exceptions to this rule. The largest mean value for head circumference, for example, is associated with the lowest TEM value. Table 3 also shows that the magnitude of TEM varies with the unit of measurement, with smaller units (e.g. mm) generally associated with larger values of TEM. This pattern is often reported in the anthropometric literature and is the reason why Ulijaszek and Kerr( Reference Ulijaszek and Kerr 8 ), among others, recommend against using TEM for comparisons across populations or across measures with different units of measurement.
Relative technical error of measurement
As expected, the values of relative TEM, which take into account the average of the measurements at each age, tend to exhibit a different pattern from the absolute TEM values. The %TEM values for recumbent length, for example, suggest that the precision of the measurements for children aged 5–7 months is less than that for children aged 23–28 months; while the values of absolute TEM, as well as the reliabilities, suggest that the precision is about the same at both ages.
Recumbent length, standing height and head circumference exhibit the lowest relative TEM of any measures in the study. With the exception of standing height at the 24-month event, the relative TEM values for data collectors as a whole on those measures are well below the upper limit of 1·0 set by Gore et al.( Reference Gore, Norton and Olds 11 ) for Level 2 accreditation. The relative TEM values for standing height, thigh circumference and waist circumference all fall below the upper limit of 1·5 set for Level 1 accreditation. The relative TEM for mid-upper arm circumference and ulnar length, on the other hand, consistently exceed the limit of 1·5 set for Level 1 accreditation, while those for the other anthropometric measures sometimes fall below and sometimes exceed the Level 1 accreditation upper limits (7·5 for skinfolds and 1·5 for all other measures)( 12 ).
Reliability
Table 3 reveals that weight and recumbent length at all ages are the most reliable measurements in the battery, with all estimates exceeding 0·98. The reliabilities for standing height and waist, thigh and head circumference exceed 0·95 at each age, while those for ulnar length and triceps and subscapular skinfolds tend to be slightly lower. Table 3 also shows that measurements of blood pressure and pulse rate exhibit the lowest reliabilities. The R estimates for systolic and diastolic blood pressure at 12 months are as low as 0·2053, indicating that nearly 80 % of the variance in the measurements is due to measurement error or momentary fluctuations in the physiological state of the children. Despite the poor reliability of the blood pressure results, the means in Table 3 fall within published norms for children of each age range( 16 ).
It is interesting to note that as indicators of measurement precision, the reliabilities and relative TEM values exhibit a somewhat different pattern across the measures. For example, the relative TEM values suggest that head circumference, recumbent length and standing height are measured with the highest level of precision, while the coefficients of reliability suggest that weight and recumbent length are measured with the highest level of precision.
Functioning of the adaptive protocol
For each measure with an adaptive protocol, Table 4 displays the total number of replicate sets (i.e. the total number of children measured across all events) and the number and proportion of those sets with third measurements. Table 4 shows that data collectors were required to take a third measurement on fewer than 5 % of the sets on most measures. The two exceptions to this rule are head circumference and ulnar length where close to 8 and 30 % of the respective sets involved three replicates.
Number and proportion of replicate sets requiring a third measurement by measure; National Children’s Study Vanguard performed in twenty-two study locations across the USA, 28 August 2012 to 12 December 2014
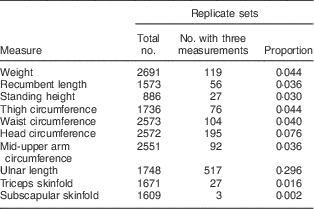
In interpreting these results, it is important to consider that the relative number of third measurements depends on the skill of the data collectors, the complexity of the measurement protocols and the threshold values for the individual measures. Subscapular skinfold thickness, for example, required far fewer third replicates – about two in every thousand children – than all other measures in the anthropometric battery. The reliabilities for this measure, although good, tended to be lower in value than the reliabilities for several other measures with higher rates of third measurements (e.g. weight and thigh circumference), suggesting that the threshold value for this measure was too high to yield comparable reliabilities. The threshold value for ulnar length, on the other hand, required data collectors to take a third measurement on nearly one in every three children. Despite the difficulty data collectors encountered with this measure as indicated by the high rate of third measurements, reliabilities ranged from 0·89 to 0·95.
Results at the level of the individual data collectors
For each anthropometric measure in the battery, Table 5 presents the minimum and maximum values of absolute TEM, relative TEM and reliability obtained by data collectors who completed twenty or more sets of replicated measurements across all measurement events. While some data collectors achieved reliabilities >0·99 across all measures, indicating that less than 1 % of the variation in their measurements was due to measurement error, a few data collectors encountered great difficulty with some measures. One data collector obtained reliability as low as 0·39 on mid-upper arm circumference, indicating that nearly 61 % of the variation in his or her measurements was attributable to measurement error. This data collector was responsible in large part for the relatively low estimates of reliability obtained for mid-upper arm circumference in the present study. Overall, these findings suggest that high levels of precision are attainable for all anthropometric measures included in the battery, but some data collectors were unable to perform at those levels.
Range of intra-examiner absolute technical error of measurement (TEM), relative TEM (%TEM) and reliability (R) for the individual data collectors for each anthropometric measureFootnote *; National Children’s Study Vanguard performed in twenty-two study locations across the USA, 28 August 2012 to 12 December 2014
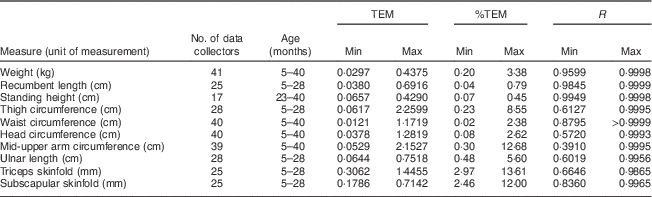
* Blood pressure and pulse rate measures are excluded from the table since no data collectors were able to obtain replicate measurements on twenty or more children. Since some data collectors were required to take third measurements while others were not, all computations in the table are based on just the first two measurements to provide as comparable estimates as possible across data collectors.
Discussion
Main findings and implications
One of the goals of the NCS Vanguard was to assess the feasibility of paediatric physical measurement collection by trained data collectors in a non-clinical setting. The present study evaluated the reliability and precision of the measurements and found that many data collectors performed at high levels. While a number of previous studies have evaluated the precision of anthropometric measurements, most have assessed intra-examiner consistency prior to data collectors entering the field. This evaluation confirms that high levels of precision can be obtained by a largely non-clinical staff under field conditions.
Many measures, including weight, height, length, most circumferences and even skinfolds, which often prove to be especially challenging to assess in young children( Reference Ulijaszek and Lourie 9 ), were collected with a high degree of precision, suggesting that the data are suitable for studying relationships among physical characteristics and other variables, and for tracking growth. In the case of blood pressure and pulse rate, levels of reliability were not sufficient to warrant future field use of the protocols employed in the present study. While blood pressure readings are expected to vary due to momentary fluctuations in the physiological state of children, the current results indicated that up to 80 % of the variability in the measurements was due to a combination of measurement error and momentary fluctuations rather than to actual differences among the children. This finding suggests that blood pressure and pulse rate measurement by trained data collectors may not be reliably obtained in home-based studies of children under 4 years of age.
The complexity of the measurements can also affect the level of reliability obtained in a non-clinical setting. As noted above, blood pressure measurements are highly sensitive to the physiological state of the child, adding a layer of difficulty to obtaining reliable measurements. Recumbent length, weight and height, however, present a more straightforward measurement protocol and do not depend on a child’s internal state or the identification of anatomical landmarks. Thus, the relative difficulty in measurement protocol could also explain some of the variation in the reliabilities of the measurements.
Comparisons with other studies
Estimates of intra-examiner reliability obtained in other studies of children roughly the same age as participants in the NCS Vanguard are shown in Table 6. The majority of these studies collected data in a clinical setting with medically trained data collectors.
Reliabilities from other studies with child populationsFootnote *
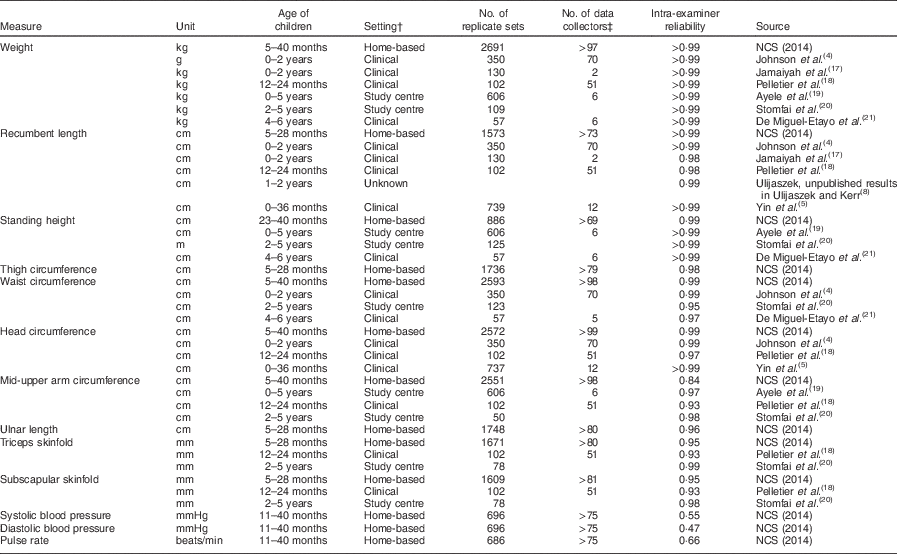
* Missing values were not provided in the published literature.
† Setting definitions: clinical=hospital, medical clinic, health centre; study centre=centralized study operations centre; home-based=home visit.
‡ Some records are missing unique data collector ID due to changes in the data recording structure.
Table 6 displays the estimates of intra-examiner reliability, the number of data collectors, and the number and age range of the children in each study. NCS estimates for the measurement events as a whole are also included for comparison; when the data are collapsed across multiple measurement events, reliabilities tend to increase since there is greater variation among the children’s physical characteristics due to the wider age span. Comparing the reliabilities with those recorded in the present study demonstrates that NCS data collectors achieved comparable levels of reliability on the majority of physical measures. Three of the four measures with relatively low reliabilities among NCS data collectors – diastolic and systolic blood pressure, and pulse rate – were not found in any of the published studies. Mid-upper arm circumference is the only measure where measurements obtained in the NCS appear to be consistently less reliable than measurements collected in other studies. Excluding nine cases that appeared to contain recording errors rather than data collector measurement errors yielded a reliability coefficient of 0·9527 for the 5–7-month event, which is comparable to other studies.
Compared with previously published studies, the NCS included over twice as many child participants. The NCS also involved over 100 collectors, nearly half of whom took more than twenty sets of replicate measurements, allowing for a detailed analysis of intra-examiner reliability at the level of the individual data collector. The two other studies with over fifty data collectors were based on relatively small numbers of children, limiting the scope of analyses that could be performed at the level of the individual data collector.
Application to future work
Reliability estimates at the data collector level will allow managers to identify individuals who struggle with a particular measure or the physical measures battery as a whole and to offer corrective training. For example, the overall reliability of the mid-upper arm circumference measurements increased substantially with the removal of one data collector who took unreliable measurements on a relatively large number of participants. Targeted training for this data collector would likely improve his or her future measurements as well as summary statistics for that measure.
If low reliability by data collectors is the rule rather than the exception, it may indicate a protocol issue or other concern. Reliability indicators can also inform the spacing of data collection events. If growth between events is relatively small compared with the magnitude of the measurement error, then true change between those events might be difficult to detect. In such cases, the timing of events could be spaced further apart, reducing participant burden.
Limitations
The findings of the present study support the use of a home-based data collection strategy by trained data collectors. However, the data collected do not allow for an assessment of the accuracy of the measurements; that is, the extent to which the measurements provide unbiased estimates of the ‘true’ values of children’s physical characteristics. The reliability analysis simply demonstrates that the measurements are consistent, but does not indicate whether the estimates are biased due to factors that may affect their accuracy. There are no known ‘true’ values to compare the readings against.
It is also important to note that data collectors did not complete the same number of collections. Some were involved for multiple years at very active sites, while others were staffed for shorter periods or at sites where physical measures data collection did not begin until children reached 3 years of age. Data collectors at those sites would not be represented in the data for the younger age groups. While it is unlikely that the population of children sampled differed across events in a way that would affect the results of the study, it is possible that differences among the characteristics of data collectors across measurement periods may have affected the relative reliability and precision of the measurements across events. Nevertheless, the same is apt to hold true in any large-scale field study employing a sizeable number of data collectors. Collectors are likely to take measurements on different numbers of children and participate for varying amounts of time.
Conclusion
Findings of the present study suggest that studies incorporating anthropometric measures in children as young as 6 months of age may realize efficiencies without sacrificing data quality by training data collectors to collect physical measurements. Field-based collection can ease participant burden, negating the need for participants to visit a clinic or other location. These findings have key implications for future physical measures data collection in the areas of cost and participant burden, measurement protocol and data quality. Incorporating measures of precision into regular data review can inform changes to the measurement protocol, which may increase precision and reduce measurement error. Study directors can also use interim reliability analysis to refine data collector training in general and to target remedial training where refinements are needed.
Acknowledgements
Acknowledgements: The National Children’s Study is indebted to the many communities, families and their health-care providers, whose participation made this study possible. The authors for this manuscript wish to acknowledge Emma Kaufman and Lauren Sedlak for their contribution. Financial support: This analysis was conducted as part of the National Children’s Study, supported by the NICHD, and funded, through its appropriation, by the Office of the Director of the National Institutes of Health (through NICHD contract number HHSN275201000015C). The funder was involved in design and writing of this article. Conflict of interest: None. Authorship: M.Z. wrote the paper and conducted the statistics. J.M. was involved in the study design and provided comments on the manuscript. B.D. conducted the statistics and provided comments on the manuscript. M.H.V. was involved in the study design and implementation and helped to prepare the manuscript. H.C. was involved in the study design and implementation and helped to prepare the manuscript. K.W. was involved in the study design and implementation and provided comments on the manuscript. Ethics of human subject participation: This study was conducted according to the guidelines laid down in the Declaration of Helsinki and all procedures involving human subjects were approved by the NICHD Institutional Review Board. Written informed consent was obtained from all subjects. Disclaimer: The views expressed in this article are the responsibility of the authors and do not necessarily represent the position of the National Children’s Study, the National Institutes of Health, or the US Department of Health and Human Services.


