



Adoption and promotion of a healthy diet is a priority for reducing chronic diseases including obesity, diabetes, CVD and several cancers. For example, the broad scientific literature demonstrates that greater adherence to a healthy diet, like the Mediterranean diet, is associated with a significant reduction in overall mortality (9 %), mortality from CVD (9 %), incidence of or mortality from cancer (6 %) and incidence of Parkinson’s and Alzheimer’s disease (13 %)( Reference Sofi, Cesari and Abbate 1 ). These data are of major interest. To cite an instance, in the last two decades obesity has more than tripled in Europe, causing more than 1 million deaths and 12 million life-years of illness each year. Moreover, obesity is associated with increased medical costs, premature death, less healthy lifestyle choices, psychological problems and poor quality of life( Reference Burkert, Rásky and Großschädl 2 ). Many governments have taken this problem to heart and developed strategies (i.e. websites improving consumer nutrition knowledge) that can promote food choices that are not only healthy but also economical. Perhaps the most well-known example of these efforts is represented by the US Department of Agriculture’s nutrition strategy Choose MyPlate.
Many different factors affect consumer food choices including nutrition knowledge, sensory preferences, food cost and availability, and cultural background( Reference Raynor, Kilanowski and Esterlis 3 – Reference Blundell and MacDiarmid 5 ). Social environment and emerging lifestyle conditions, including fragmentation/disruption of family roles and a new pace of work, also induce significant changes in dietary habits( Reference Saulle, Semyonov and La Torre 6 ). Moreover, media suggestions (advertising, fascination with lifestyles other than one’s own) influence individuals’ food choices and point them towards globalised dietary models( Reference Schmidhuber and Traill 7 , Reference Bonaccio, Bonanni and Di Castelnuovo 8 ). Taken together, these variables may pose barriers to adopting a healthy diet. Food sensory characteristics and cost seem to have a crucial impact on consumer choices. This latter factor is particularly relevant, given that the highest rates of obesity and diabetes are observed among lower-income groups( Reference Drewnowski and Eichelsdoerfer 9 – Reference Kirkpatrick, Dodd and Reedy 14 ). Thus, it is possible to speak of a clear social gradient in health: when compared with people of high socio-economic status, people of low socio-economic status show an increased prevalence of morbidity, a high level of health complaints and a lower life expectancy by 7 years( Reference Burkert, Rásky and Großschädl 2 ).
Common wisdom suggests that healthier foods are more expensive than less healthy choices( Reference Drewnowski and Darmon 12 , Reference Drewnowski and Darmon 15 ). Food cost comparisons may be performed using three price metrics: the price per energy (kJ/kcal), per edible gram and per average serving. The method by which food prices are compared has a great effect on findings related to food cost comparisons. Foods low in energy for a given weight, typically fruit and vegetables, appear to have a higher price when expressed per kilojoule. Conversely, less healthy foods (sugar- and fat-rich foods) tend to be high in energy and to have a low price per kilojoule. Finally, when measured based on edible weight or average serving size, grains, vegetables, fruit and dairy foods are less expensive than most protein foods and foods high in saturated fat and added sugars( Reference Carlson and Frazão 16 , Reference Rao, Afshin and Singh 17 ).
The main purpose of the present study was to select the most affordable healthy foods and to demonstrate that it is possible to follow a healthy diet without heavy economic effort. To reach these objectives, we calculated the nutrient adequacy of different foods, using the mean adequacy ratio (MAR) and the mean excess ratio (MER)( Reference Vieux, Soler and Touazi 18 ), and subsequently correlated each food’s MAR and MER with its cost. This allowed us to link nutrient density and food prices and to compare the costs of foods from a given food category according to their nutritional quality (NQ). Our nutrieconomic model (NEM) notes the most economical choices among similar foods and represents an important tool to help consumers identify foods that provide optimal nutrition at lowest possible cost.
Materials and methods
Food items
The main food categories in the Italian Food Pyramid (Istituto di Scienza dell’Alimentazione, Università la Sapienza, Roma)( 19 ) were included in the present study: non-starchy vegetables, fruit, dairy products, cereals and starchy vegetables, legumes, fish, poultry and red meat. A total of seventy-one food items belonging to these groups were chosen on the basis of their cost and availability; particularly for fruit and vegetables, seasonal choices were preferred.
Food price survey
Each food cost was represented by the mean price over a 4-week monitoring period (April 2013); price data were collected using the SMS CONSUMATORI website( 20 ), an innovative free service offered by the Italian Ministry of Agricultural, Food and Forestry Policies. This tool considered the most popular food items and collected their daily retail prices in 2200 different stores (hyper- and supermarkets, discount stores, fruit and vegetable stores, butchers, fishmongers, grocery stores and street markets) located in thirty-five different provinces throughout Italy.
The prices determined in this way were then referred to the recommended servings for the Italian adult population reported in Table 1 ( 19 ). Moreover, each price was normalised according to the edible part of each considered food (data sources: CRA-NUT, Centro di Ricerca per gli Alimenti e la Nutrizione and IEO, Istituto Europeo di Oncologia)( 21 , 22 ).
Recommended servings of analysed food items for the Italian adult population( 19 )

Nutritional evaluation
To assess the nutritional quality (NQ) of each food item, the MAR was calculated as follows( Reference Vieux, Soler and Touazi 18 ):
 $${\mathop{\rm MAR}\nolimits} ={1 \over n}{\times}\mathop{\sum}\limits_{bn=1}^n {{{{\mathop{\rm INTAKE}\nolimits} _{{bn}} } \over {{\mathop{\rm RDA}\nolimits} _{{bn}} }}} {\times}100,$$
where n is the number of beneficial nutrients considered, bn is an index identifying one of the beneficial nutrients, INTAKE bn is the amount of beneficial nutrient bn provided by a recommended serving of food and RDAbn is the daily amount of beneficial nutrient bn according to its RDA.
Each ratio was truncated at 100 so that a high intake of one nutrient could not compensate for the low intake of another. Energy density and twenty-eight beneficial nutrients were considered: energy intake, total proteins, total and polyunsaturated fats, total fibre, water-soluble (C, thiamin, riboflavin, niacin, pantothenic acid, pyridoxine, biotin, folic acid and cyanocobalamin) and fat-soluble vitamins (A, D and E) and, finally, various mineral elements (Ca, Cl, Cu, iodine, Fe, Mg, Mn, P, K, Se and Zn). For dietary protein sources, e.g. meat, fish, legumes and dairy products, essential amino acids (histidine, isoleucine, leucine, lysine, methionine + cysteine, phenylalanine + tyrosine, threonine, tryptophan and valine) were also considered. Single nutrients were included if a specific daily RDA for the Italian adult population was available from the Italian Society of Human Nutrition (Società Italiana de Nutrizione Umana; SINU)( 23 ). Daily requirements of essential amino acids were calculated on the basis of a mean protein intake of 0·66 g protein/kg body weight per d for adult males and females( 24 , 25 ).
Definitions of ‘healthy food’ vary depending on the source and context, but in a general way healthy foods provide essential nutrients, support health and contain only moderate amounts of saturated fats, free sugars and Na( Reference Carlson and Frazão 26 ). Thus, as a global nutritional assessment, MAR was reduced by its counterpart mean excess ratio (MER), which was calculated for fats, free sugars and Na, as follows( Reference Vieux, Soler and Touazi 18 ):
 $${\mathop{\rm MER}\nolimits} =\left[ {{1 \over 3}{\times}\left( {\mathop{\sum}\limits_{nl=1}^3 {{{{\mathop{\rm INTAKE}\nolimits} _{{nl}} } \over {{\mathop{\rm MRV}\nolimits} _{{nl}} }}} {\times}100} \right)} \right]{\minus}100,$$
where nl is an index identifying one of the nutrients to limit, INTAKE nl is the amount of nutrient nl provided by a recommended serving of food and MRV nl is the daily maximum recommended value for nutrient nl.
In particular, SINU recommends limiting daily Na intake to a maximum of 2 g and intake of free sugars and saturated fats to less than 15 % and 10 % of total energy intake, respectively. To calculate MER, each ratio below 100 was set to 100, so that a low intake of one nutrient could not compensate for the high intake of another. To note that all selected foods presented a null MER. In principle, maximum NQ quality scored 100 (maximum MAR and null MER).
The chemical composition of each food was determined using the CRA-NUT and IEO databases and normalised for the recommended serving.
Nutrieconomic charts
A nutrieconomic chart was defined for each food group, reporting the NQ and price of each analysed food item along the x- and y-axis, respectively. This graphical solution allowed immediate comparisons between similar foods and identification of the best nutrieconomic choices in each food category. Nutrieconomic charts comparing different food categories were not performed, except for the typical protein sources (meat, fish, legumes and dairy products), as each food group provides unique nutritional benefits and offers different macronutrients (carbohydrates, proteins and fats) and micronutrients (vitamins and minerals).
Results
The importance of the recommended serving
As previously discussed, a nutritional comparison among different foods could be based on price per kilojoule, per 100 g or per average serving size. Even if the first two methods seem to be more universally comprehensible than recommended servings, which very often differ according to country, these approaches do not consider that different foods are consumed in very different amounts. These methods dramatically affect the results of food comparisons aimed to identify nutritionally optimal choices.
Nutrieconomic model for food groups: identifying the best nutrieconomic choices
Considering cereals and their derivatives, our NEM revealed a homogeneous NQ for this group (data not shown). These products presented similar NQ as well as similar cost, except for bread and rusks, taking into consideration their smaller serving sizes (50 g and 20 g, respectively, v. 80 g of pasta/rice). Unfortunately, the official price database did not include data about whole grains, which most likely represent the best nutrieconomic choices in this category. This lack reflected the still insufficient consumption of these products by Italian consumers.
In the fruit and vegetables group, NQ varied substantially, while cost showed a narrow range because the foods selected represented seasonal choices (Fig. 1). In this scenario, spinach emerged for its excellent NQ, due to a high content of riboflavin, vitamins C and A, folic acid, pyridoxine, Fe and Zn. Artichokes showed a very good NQ but also had the highest cost per serving.
Fruit and vegetables nutrieconomic chart: nutritional quality (NQ) and cost referred to the recommended serving, namely 150 g for fruit (□), 250 g for cooked vegetables (♦) and 50 g for fresh leafy vegetables (♦)

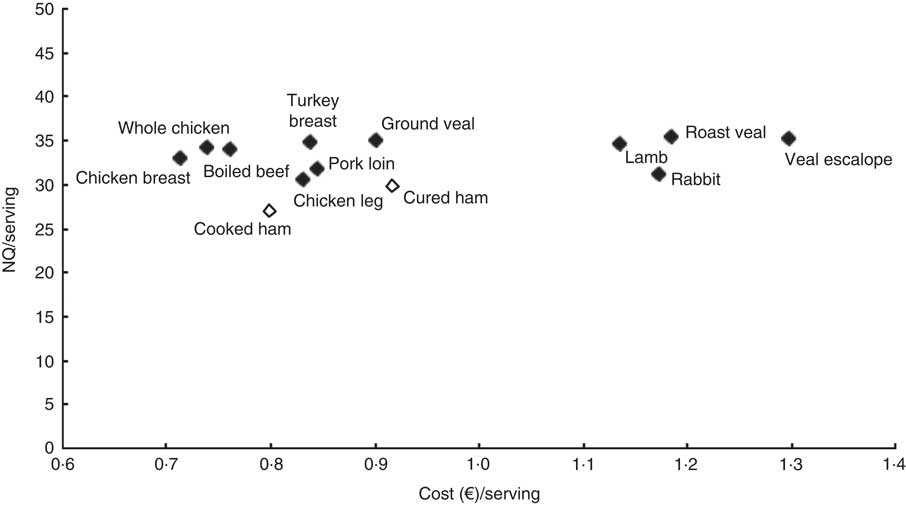
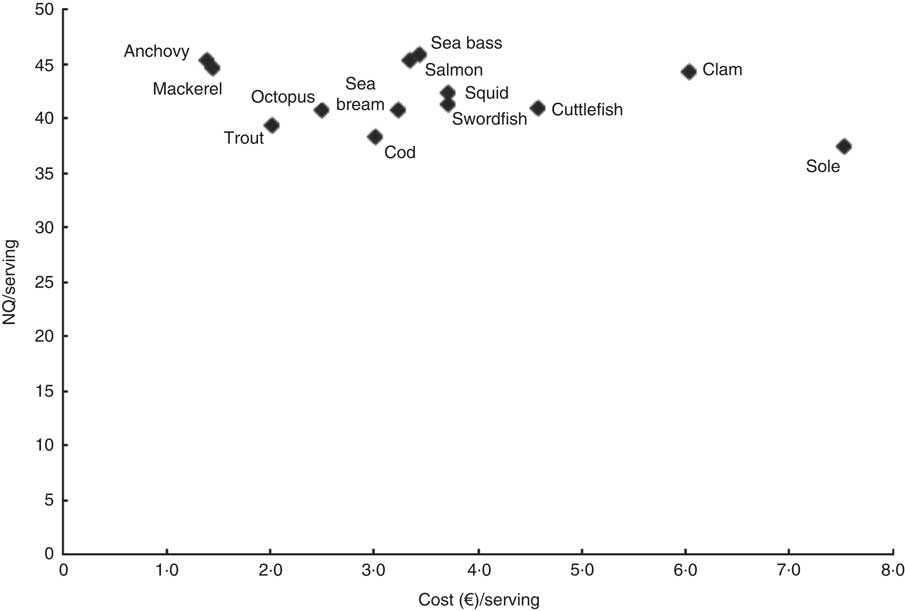
In the meat (Fig. 2) and fish (Fig. 3) groups, the NEM showed a wide range of food cost for a relatively similar NQ per serving. Within the meat group, poultry such as chicken and turkey without skin represented the best nutrieconomic choice. In the fresh fish group, the best balance between NQ and cost per serving was reached by oily fish such as anchovy and mackerel. It is interesting to note the case of sole, which in Italy is often recommended for children: it has a very similar NQ to others but a much higher price per serving.
Meat nutrieconomic chart: nutritional quality (NQ) and cost referred to the recommended serving, namely 100 g for fresh meat (♦) and 50 g for deli meats (◊)
Fresh fish nutrieconomic chart: nutritional quality (NQ) and cost referred to the recommended serving (150 g)
In the milk and dairy products group, all food items showed a very similar NQ, with a quite wide range of cost per serving (Fig. 4). The best nutrieconomic choice was represented by milk (pasteurised or ultra-heat-treated), followed by yoghurt.
Milk and dairy products nutrieconomic chart: nutritional quality (NQ) and cost referred to the recommended serving, namely 125 ml for milk and yoghurt (♦), 50 g for aged cheeses (♦) and 100 g for fresh cheeses (◊). UHT, ultra-heat-treated

Dried legumes (beans, chickpeas and lentils) showed almost the same cost (approximately 0·1 €) and NQ (approximately 25) per serving (30 g).
Nutrieconomic model among dietary protein sources
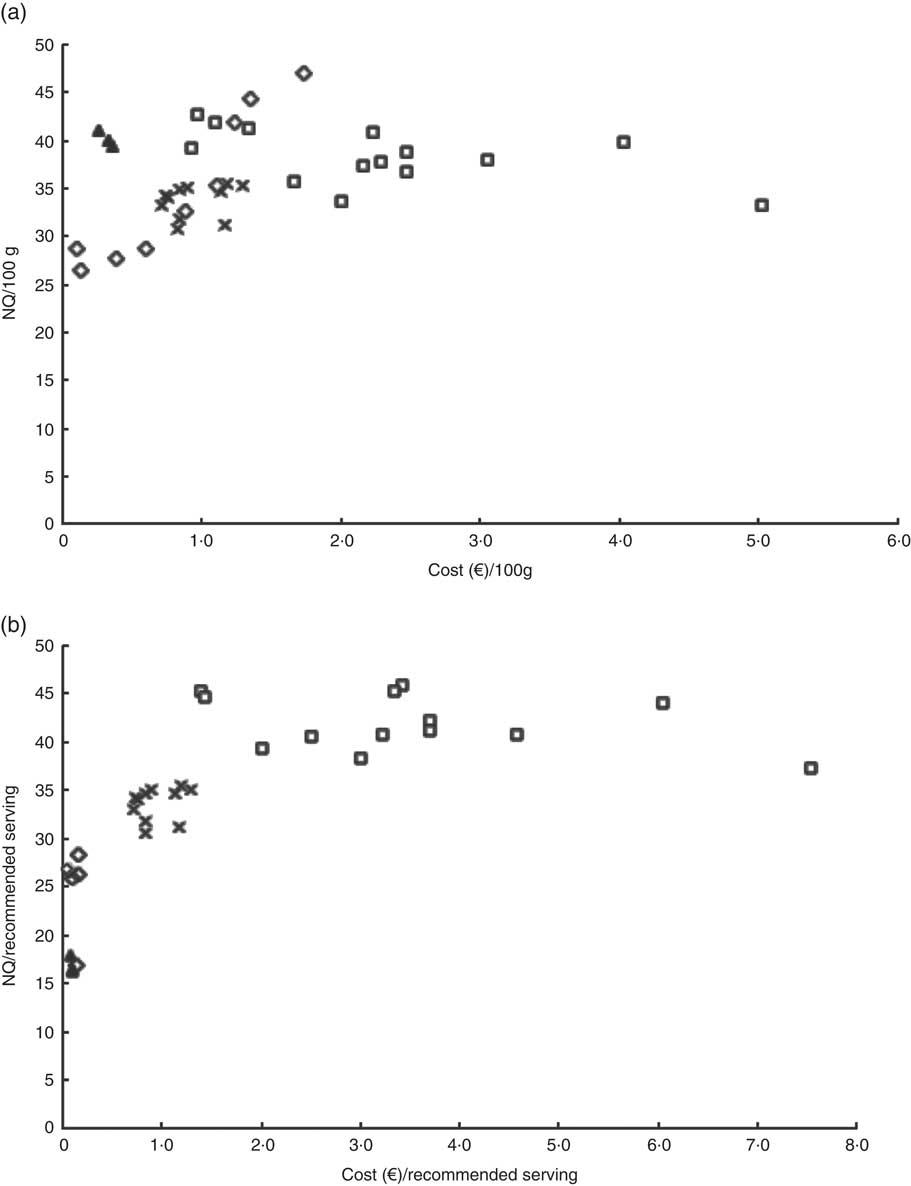
Each food category offers specific nutrients and, therefore, a balanced and varied diet must include the correct intake of all types of food items. Figure 5 presents the NEM results among typical dietary protein sources, namely meat, fish, legumes and dairy products. When this comparison referred to 100 g, almost all dietary protein sources showed a quite similar NQ (Fig. 5(a)). On the contrary, when the recommended serving was considered, NQ differed among each food category (Fig. 5(b)). In particular, this second approach noted the higher NQ of products of animal origin, i.e. fresh meat, fish and dairy products, in comparison to vegetal protein sources, i.e. legumes. The higher NQ for meat and fish could be explained by considering that the recommended serving for meat and fish is approximately 100 and 150 g, while the recommended serving for dried legumes corresponds to approximately 30 g. Considering the single nutrient profiles per serving, animal-origin foods presented a higher total protein content, better satisfying the recommended daily protein intake. Their supply of essential amino acids fulfilled the specific recommended intake, while that of legumes was slightly lower.
Application of the nutrieconomic model among dietary protein sources (×, meat; □, fish; ▲, dried legumes; ◊, dairy products): (a) nutritional quality (NQ) and cost referred to 100 g; (b) NQ and cost referred to recommended serving, i.e. 100 g for meat, 150 g for fish, 30 g for dried legumes, 125 ml for milk and yoghurt, and 100 and 50 g for fresh and aged cheeses, respectively
Simulation of a weekly menu: is a low-cost balanced diet possible?
Based on the results presented above, it is clear that, in some categories, food items showed a very similar NQ while their price per serving varied. This was the case for animal-protein sources including meat, fish and dairy products. In a balanced diet based on the recommended serving of the Italian Food Pyramid (Table 1), meat can be eaten up to five times per week, equally distributed among beef, pork and poultry; fish should be consumed at least two times per week; and recommended consumption of cheese is approximately four times weekly( 19 ).
We therefore formulated two balanced weekly menus, differing only in their content of meat, fish and dairy products, as shown in Table 2. The first menu included the most economical choices, while in the second the more expensive choices were preferred. Just varying these few servings, the high-cost diet accounted for 48 € per person, while the low-cost diet reached only 35 € per person: a saving of almost 30 %, without affecting the nutritional quality of the diet.
Weekly diet simulation of two different menus, differing by food protein sources. Menu 1 includes the best nutrieconomic food choices and menu 2 the more expensive food choices. Equal foods in the two menus are marked with an X

Discussion
The cost of healthy eating has become a growing concern in industrialised countries. Several studies have already demonstrated that the adherence to dietary guidelines for the prevention of cancer, obesity or CVD can be influenced by social, educational and material resources and in particular by food prices and diet costs( Reference Darmon and Drewnoski 10 – Reference Hiza, Casavale and Guenther 13 ). Developing nutrient profile models to help consumers identify affordable nutrient-rich foods across and within food groups has implications for nutrition education, food policy and public health( Reference Drewnowski and Specter 27 – Reference Drewnowski 30 ).
Food comparisons differ according to the method used to calculate cost( Reference Drewnowski, Maillot and Darmon 31 ). While food prices per gram do not reflect differences in the foods’ moisture content and therefore energy density, food prices per kilojoule do not note nutritious differences, such as the content of vitamins and minerals. For example, measuring food prices per gram, rather than per kilojoule, is one way to make healthy foods, like fruit and vegetables, appear less expensive. Therefore, it is of primary importance to find measures assessing the amounts of beneficial nutrients per unit cost, such as the already proposed Nutrient Rich Food Index( Reference Drewnowski 32 , Reference Drewnowski 33 ). Ideally, the proposed system would be science-based and user-friendly, allowing consumers to make more healthful food choices within and across all food groups.
The present study aimed to define the most affordable and nutritional foods in each food group, basing its results on MAR and MER indices and considering several beneficial nutrients. Selected foods belonged to the main groups of the Italian Food Pyramid: in fact, the secondary purpose of the present study was to demonstrate that a healthy balanced diet is not as expensive as consumers generally think and that it is truly sustainable from an economic point of view.
We decided to perform nutrition profiling of foods based on their recommended serving rather than on the 100 g reference. In the European Union, nutrition labelling is provided per 100 g, while in the USA such information is referred to serving size, as defined by the Food and Drug Administration. Each method has its own advantages and disadvantages. Evaluating the nutrient content of foods in relation to energy (per 100 kJ/100 kcal) allows for ready comparisons with nutrient recommendations and guidelines, typically expressed per approximately 8372 kJ (2000 kcal) daily. However, some foods score disproportionately high by virtue of their low energy density, typically fruit and vegetables( Reference Drewnowski 30 ). Moreover, typical serving sizes for different foods can deviate significantly from the standard of 100 g. For example, serving sizes for legumes, baked products or cured cheeses are typically much smaller than 100 g. In contrast, serving sizes for milk or yoghurt, fish, vegetables or fruit are well in excess of 100 g. Thus, expressing nutrient content on a per serving/portion basis is the only approach directly related to the quantity of food typically consumed.
Each food category shows a different nutritional profile, providing characteristic families of nutrients. In this sense, when a unique nutritional index is used, we considered nutritional comparisons among different categories as quite hazardous, preferring comparisons among food items belonging to the same group. We carried out just one inter-category comparison: among dietary protein sources.
Cereals showed the lowest prices per portion, with similar values for NQ. Therefore, consumers can choose what they prefer.
Considering the fruit and vegetables group, we intentionally analysed seasonal products. The NEM highlighted a very peculiar situation: almost all of the foods we considered showed a similar price per serving, while a wide range of NQ was apparent. Considering the high number of portions recommended during a week, the best nutrieconomic choice is to vary fruit and vegetables as much as possible, always favouring local and seasonal products. In this way, consumers can ensure an optimum intake of all nutrients and save money.
All meats presented quite similar values for NQ together with a wide range of prices per serving. This means that consumers can choose, for the same nutritional profile, more affordable foods. Poultry meat, such as chicken and turkey without skin, is the best nutrieconomic choice for this food category. Oily fish, such as anchovy and mackerel, represent the best nutrieconomic choice among fish. This is not surprising, but it is a further confirmation of the exceptional nature of these staple foods of the traditional Mediterranean diet. For dairy products, milk and yoghurt are the most affordable foods.
Considering dietary protein sources, animal products presented higher NQ, as well as a higher price per serving, particularly for the fish group.
The above examples give an idea of how, within the same dietary pattern, differences in spending can be wide according to the food choices of each consumer. Simply by varying the portions related to the protein food sources from the most expensive to the cheapest, we showed savings of 30 % per week without affecting the nutritional quality of the diet.
Therefore, we believe that policies that favour better nutrition must necessarily consider price as a fundamental variable and that significant investments should be directed to food education. Eating healthily does not necessarily imply spending much, but rather being able to make nutritionally optimal choices. In this sense, the NEM is an innovative, useful and practical tool to help both consumers in making correct food choices and nutritionists in increasing the compliance of their patients.
The primary aim of NEM was to investigate the best food choices among healthy foods, demonstrating the sustainability of healthy diets. Further development of NEM will compare typical fast foods or ready-to-eat foods with homemade recipes prepared with healthy ingredients, such as those considered in this first analysis.
Acknowledgements
Financial support: This research received no specific grant from any funding agency in the public, commercial or not-for-profit sectors. Conflict of interest: None. No party with a financial interest of any kind in the study or its outcome was involved in study implementation, data collection, data analysis or interpretation. Authorship: A.C. and E.P. contributed to the design and oversight and critical review of the study; L.P. and G.C. analysed the data and wrote the manuscript. Ethics of human subject participation: Ethical approval was not required.



