


1. Introduction
In-depth understanding of the underlying interaction mechanisms of a rotor wake and a wing is an important topic of fundamental and applied fluid mechanic research. This type of vortex–wing interaction is commonly observed in naval propulsion and concerns the perturbation that the propeller flow exerts to the rudder as well as in the aeronautic field limitedly to the typical tractor propeller–wing configurations. In either field, this type of interaction represents an issue of key importance because of its direct correlation to performance, safety, efficiency, comfort, radiated noise and structural problems (see, e.g., Jameson Reference Jameson1969; Witkowski, Lee & Sullivan Reference Witkowski, Lee and Sullivan1989; Kracht Reference Kracht1992; Shen, Jiang & Remmers Reference Shen, Jiang and Remmers1997a; Shen, Remmers & Jiang Reference Shen, Remmers and Jiang1997b).
From the physical standpoint, the wake generated by a single propeller/rotor blade consists of a system of vortical structures at the root and tip sections and a sheet of trailing vortices that are shed spanwise owing to the non-constant circulation that usually characterises the operating range of a rotor. In a multi-bladed rotor, this vortex pattern combines with those generated by the other blades creating a system of multiple helical vortex sheet surfaces and tip vortices and a strong central straight vortex of opposite sign (see, e.g., Kerwin Reference Kerwin1986; Conlisk Reference Conlisk1997; Vermeer, Sorensen & Crespo Reference Vermeer, Sorensen and Crespo2003). In the typical examples of rotor–wing arrangements of naval and aeronautic propulsion, rotor and wing (or rudder) are in close proximity and their interaction normally occurs where the propeller wake is not yet destabilised. Under these circumstances, propeller perturbation shows a periodic trend at the blade passing frequency with a periodicity that is correlated to the regular passage of its vortical structures. In other, less-frequent, cases, the destabilisation process of the wake is already underway upstream of the wing and the interference of the vortical structures with the wing exhibits a much complex behaviour owing to the complex vortex patterns associated with the instability modes of the propeller vortices. In general, the occurrence of one or the other situations depends on the propeller distance from the wing, on the blade number, on the loading conditions at which propeller operates and on the geometrical characteristics of the propeller. An exhaustive analysis of these aspects is documented in Felli, Guj & Camussi (Reference Felli, Guj and Camussi2008), Felli, Camussi & Di Felice (Reference Felli, Camussi and Di Felice2011) and Felli & Falchi (Reference Felli and Falchi2018).
The complexity of the propeller wake along with the unsteady and markedly three-dimensional flow structures involved in the interference with a downstream body (Okulov & Sørensen Reference Okulov and Sørensen2010; Felli et al. Reference Felli, Camussi and Di Felice2011) make its investigation rather challenging and the understanding of the underlying fluid dynamic mechanisms of its interaction with a wing particularly difficult. An effective and useful insight is given by the simplified models of a vortex–body orthogonal and streamwise interference, which, to some extent, resemble the type of interaction of the propeller blade and hub vortices with a wing, respectively. These simplified vortex–body interactions have received much attention in the literature, in particular for the study of the structural, aeroacoustic, manoeuvring and control effects related to the interaction of helicopter rotor blades with concentrated tip vortices (see, e.g., Brentner & Farassat Reference Brentner and Farassat1993; Filippone & Afgan Reference Filippone and Afgan2008; Glegg & Devenport Reference Glegg and Devenport2017; Saunders & Marshall Reference Saunders and Marshall2017), and have been addressed by a number of empirical and theoretical studies for different vortex orientations and positions with respect to the wing (see, e.g., Rockwell Reference Rockwell1998).
The interaction of a streamwise vortex with a blade was thoroughly investigated by Patel & Hancock (Reference Patel and Hancock1974) and Bodstein, George & Hui (Reference Bodstein, George and Hui1996) who identified three distinguishing physical features of this type of interference and, specifically: (i) the displacement of the vortex trajectory in the spanwise direction which arises from image effects and the associated mutual induction, (ii) the generation of a local separation zone on the blade surface and (iii) the onset of vortex breakdown near the maximum thickness location or, for a direct encounter, at a location upstream of the stagnation point. The same authors showed that the onset of vortex breakdown may be coupled with modifications of the flow along the surface of the blade as, for example, when flow separation occurs. This phenomenon was also documented by McAlister & Tung (Reference Mcalister and Tung1984) who studied the interrelationship between the structure of a streamwise vortex and the onset of large-scale stall, showing the onset of vortex bursting occurring in accord with the stall region. Recently, Garmann & Visbal (Reference Garmann and Visbal2015) utilised a high-fidelity, implicit large-eddy simulation approach to investigate the unsteady interactions resulting from a streamwise-oriented vortex impinging upon a finite plate for outboard, tip-aligned and inboard positions. The study enlightened distinct flow mechanisms depending on the spanwise position at which the streamwise vortex interacts with the wing: (i) when the vortex is positioned outboard of, but in close proximity to, the wing tip, it pairs with the tip vortex and forms a dipole; (ii) when the vortex is aligned with the wing tip, both structures attenuate into the wake due to shear layer instabilities arising from the entrainment of opposite-signed vorticity into either structure; and (iii) when the incident vortex is positioned inboard of the wing tip, it bifurcates in the time-mean sense, splitting and passing over both sides of the wing.
The case of an orthogonal vortex penetration of a wing was tackled by several authors. An exhaustive review, including a series of detailed experimental studies performed at different Reynolds regimes using pressure measurements, flow visualisations and flow measurements (Johnston & Sullivan Reference Johnston and Sullivan1993; Wittmer et al. Reference Wittmer, Devenport, Rife and Glegg1995; Krishnamoorthy & Marshall Reference Krishnamoorthy and Marshall1997, Reference Krishnamoorthy and Marshall1998; Doolan, Coton & Galbraith Reference Doolan, Coton and Galbraith1999, Reference Doolan, Coton and Galbraith2001; Wittmer & Devenport Reference Wittmer and Devenport1999; Wittmer, Devenport & Glegg Reference Wittmer, Devenport and Glegg1999; Green, Doolan & Cannon Reference Green, Doolan and Cannon2000; Early, Green & Coton Reference Early, Green and Coton2002; Wang et al. Reference Wang, Doolan, Coton and Galbraith2002; Green, Coton & Early Reference Green, Coton and Early2006) and computational works (Marshall Reference Marshall1994; Lee et al. Reference Lee, Xiao, Burggraf, Conlisk and Komerath1995; Marshall & Grant Reference Marshall and Grant1996; Sheikh & Hillier Reference Sheikh and Hillier2001; Liu & Marshall Reference Liu and Marshall2004) is given by Coton et al. (Reference Coton, Marshall, Galbraith and Green2004).
Unlike the case of a streamwise vortex, which may involve either direct impingement upon the body or an indirect vortex–body interference without contact, the encounter of a normal vortex implicates an unavoidable collision with the leading edge followed by a rapid distortion of the vortex structure. Starting from early experimental works on orthogonal vortex–blade interaction (Ahmadi Reference Ahmadi1986; Cary Reference Cary1987; Johnston & Sullivan Reference Johnston and Sullivan1993), Marshall (Reference Marshall1994), Marshall & Yalamanchili (Reference Marshall and Yalamanchili1994) and Marshall & Grant (Reference Marshall and Grant1996) highlighted different mechanisms of vortex–body interaction depending on the thickness parameter (i.e. blade thickness to vortex core ratio). In particular, it was found that, for a very thin plate, that is, a plate thickness of about the radius of the vortex, the vortex does not bend significantly and the predominant effect is the occurrence of a vortex shock, involving axial compression of the core combined with an increase of its diameter on the upper side of the blade and the onset of an expansion wave accompanied by a decrease of the vortex size on the lower side of the blade. Increasing the thickness of the body relative to the size of the vortex core, the vortex starts to exhibit severe bending about the leading edge of the blade without cutting. Image effects are manifested in the formation of a kink in the distorted vortex. Evidence of this phenomena was presented experimentally by Krishnamoorthy (Reference Krishnamoorthy1993) and Krishnamoorthy & Marshall (Reference Krishnamoorthy and Marshall1994) and, later, by Weigand & Gharib (Reference Weigand and Gharib1997) and Krishnamoorthy & Marshall (Reference Krishnamoorthy and Marshall1998). Liu & Marshall (Reference Liu and Marshall2004) employed an excellent computational study of the blade penetration into the core of an initially columnar vortex with and without axial core flow. The study showed that the penetration of the blade into the core of a vortex with no axial flow occurs with a process of cross-diffusion between vorticity in the blade boundary layer and that within the vortex which causes vortex lines originating in the columnar vortex to reconnect to those within the blade boundary layer. This reconnection mechanism was investigated thoroughly in a recent paper by Saunders & Marshall (Reference Saunders and Marshall2015). Alternatively, the presence of axial flow within the columnar vortex causes development of asymmetry between the upper and lower blade surfaces and, specifically, the increase of the vortex radius within the upper portion of the vortex (which is compressed by the axial flow) and decrease in the lower portion of the vortex (which is stretched by the axial flow). Similar variations in the vortex core radius were observed in the laser induced fluorescence (LIF) experiments by Marshall & Krishnamoorthy (Reference Marshall and Krishnamoorthy1997), as well as in the particle image velocimetry (PIV) measurements of orthogonal vortex–blade interaction by Green et al. (Reference Green, Doolan and Cannon2000).
The effect of vortex orientation was examined by Filippone & Afgan (Reference Filippone and Afgan2008) who studied the time-dependent blade loading and the fluid dynamics of the vortex in all the encounter phases with the blade for an orthogonal vortex travelling either head-on or at 45° to the leading edge.
Despite shedding light into the fundamental fluid-dynamic mechanisms of vortex–body interaction, challenging problems remain open regarding the understanding of those phenomena in which the much greater complexity of a rotor wake–wing interaction along with its high specificity (i.e. much higher thickness parameters than those typical of a blade–vortex interaction, oblique impingement, non-uniform wing, swirling onset flow, multiple helical vortices, multi-scale vortex structures) may play a relevant role and the use of simpler vortex–body interaction models may not be adequate for their assessment.
Specific studies of the fluid dynamic interaction between a rotor wake and a wing are lacking in the literature and have been mostly limited to global flow features, qualitative descriptions or simplified rotor–wing configurations (see, e.g., Anschau & Mach Reference Anschau and Mach2009; Felli, Camussi & Guj Reference Felli, Camussi and Guj2009; Lucke & Streckwall Reference Lucke and Streckwall2009; Felli & Falchi Reference Felli and Falchi2011; Di Mascio et al. Reference Di Mascio, Dubbioso, Muscari and Felli2015; Muscari, Dubbioso & Di Mascio Reference Muscari, Dubbioso and Di Mascio2017). These studies reported some general phenomena of the interaction between the propeller tip and hub vortices and a downstream wing, such as the sever and reconnection mechanisms of the tip and hub vortices during the collision and penetration phases, the spanwise displacement of the propeller wake portions flowing on the pressure and suction sides of the wing and the evolution of the wake structures in the near field downstream of the wing.
The present paper, which is a follow-up of the previous studies by Felli et al. (Reference Felli, Camussi and Di Felice2011) and Muscari et al. (Reference Muscari, Dubbioso and Di Mascio2017), is aimed at enhancing understanding of the fundamental underlying mechanisms of interaction between the vortical structures of a rotor wake and a downstream wing. To this end, a comprehensive experimental survey, including detailed flow measurements by laser Doppler velocimetry (LDV) and PIV, time-resolved visualisations and detailed wall-pressure measurements, was focused on the dynamics of a multi-bladed rotor helical vortices during the approach, penetration and reconnection phases with a wing, using the same rotor blade and wing geometries as Felli et al. (Reference Felli, Camussi and Di Felice2011) and Muscari et al. (Reference Muscari, Dubbioso and Di Mascio2017).
The paper is organised as follows. Section 2 describes the case study. Section 3 gives an overview of the experimental campaign. The facility is described in § 3.1. Sections 3.2–3.4 present the experimental set-ups of the flow visualisations and of the flow and wall-pressure measurements, respectively. Reference frames and dimensionless groups along with test matrix and conditions are reported in § 4. The results are discussed in § 5, namely the tip vortex–wing interaction in § 5.1, the blade trailing edge wake–wing interaction in § 5.2 and the effect of propeller loading and blade number in § 5.3. Conclusions and final remarks are finally discussed in § 6.
2. Case study
The case study consisted of a four-bladed propeller and an untipped wing. Overall characteristics of the propeller and wing models are summarised in table 1.
Overall features of the propeller and wing models.

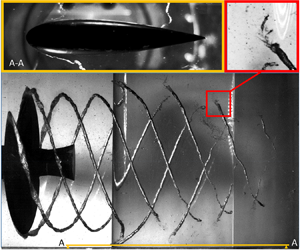
The wing had a rectangular planform and standard symmetrical sections with NACA 0020 profiles (figure 1). Three different models of the wing were manufactured and, specifically: (1) a transparent Perspex model, allowing the simultaneous optical access to both wing sides to be used for side-view flow visualisations and PIV flow measurements; (2) a black painted steel model to be used for bottom-view flow visualisations and LDV flow measurements; (3) an unpainted steel model designed to host flush mounted pressure transducers on both sides to be used for wall-pressure fluctuation measurements. More details are given in § 3.
Sketch of the propeller–wing arrangement (a) top view and (b) transversal view, and (c) picture of the Perspex model of the wing.

The propeller was a reference propeller model, namely the INSEAN E779a propeller (figure 1). This propeller, widely studied by earlier wake surveys (see, e.g., Cenedese, Accardo & Milone Reference Cenedese, Accardo and Milone1985; Felli et al. Reference Felli, Di Felice, Guj and Camussi2006, Reference Felli, Camussi and Guj2009, Reference Felli, Camussi and Di Felice2011; Felli, Grizzi & Falchi Reference Felli, Grizzi and Falchi2014; Muscari et al. Reference Muscari, Dubbioso and Di Mascio2017; Felli & Falchi Reference Felli and Falchi2018), is a four-bladed, fixed-pitch, right-handed propeller characterised by a nominally constant pitch distribution and a very low skew. These characteristics makes the propeller highly loaded at the tip sections and, thus, generate strong tip vortices, which is an important requisite for the subject of the present study. The propeller hub was a diverging truncated cone. The choice for this geometry was to avoid laser light reflections from the otherwise cavitating hub vortex during the PIV measurements.
The wing was fixed to the top and bottom windows of the test section, with the plane of symmetry passing through the prolongation of the propeller axis and the leading edge at one radial distance from the propeller disc plane (figure 1).
3. Experimental set-up
3.1. Facility
The experimental campaign was performed in the Cavitation Tunnel of the Italian Navy. The tunnel is a closed jet type circuit that develops along a vertical plan. The test section is 2.6 m long and has a square cross-section of 0.6 × 0.6 m2. The optical access is enabled by eight Perspex windows on the four walls (two for each side). The nozzle contraction ratio is 5.96 : 1 and the maximum water speed is 12 m s−1. The mean velocity uniformity is within 1 % for the axial component and 3 % for the vertical component and the highest freestream turbulence intensity is less than 2 %.
The propeller and the wing were installed on the J15 dynamometer (i.e. 2450 N maximum thrust, 98 Nm maximum torque and 4000 rpm maximum speed) and on a five-component strain gauge balance (i.e. 6000 N for lift and drag, 500 Nm for torque, 1000 Nm for the moments about the x and the y axes), both by Kempfs & Remmers.
3.2. Flow visualisations
Flow visualisations were conducted making the propeller tip vortices cavitate by varying the pressurisation in the facility.
The set-up consisted of two synchronised time-resolved cameras, arranged to view the propeller–wing system from below and from a side (figure 2). The synchronisation was accomplished by an external impulse that triggered the acquisition of the first (Master) and second camera (slave), at the selected frame rate. Both cameras were positioned with the optical axis perpendicular to the facility window to minimise any optical aberration originating when looking through the air–water interface at an angle. The adopted cameras were two SA.1 models by Photron, capable of 5 kHz frame rate at the full resolution of 1 Mpx. During tests, camera frame rates were changed according to the spatial and temporal resolution requirements up to a maximum of 10 kHz. Both cameras were equipped with a 60 mm, 2.8 f-number lens by Nikkor.
Experimental set-up of the time-resolved flow visualisations.

Two 1800 W high-intensity HMI lamps by ARRI were used as main illumination sources (figure 2). This lamp type features high efficiency and reduced heat production, so it is best suited for applications needing intense lighting through narrow Perspex windows to obtain adequate illumination at high frame-rate recording. A third illumination source, consisting of a 1000 W halogen lamp by DEDOLIGHT, was set-up to light the region in shade and thus to accomplish a homogenous light distribution over the whole field of view.
During the visualisations, the static pressure of the facility was reduced to a minimum 0.5 bar. This assured an optimal trade-off between the needs to identify the propeller vortical structures during the interaction with the wing and to avoid the formation of air bubbles to jeopardise the quality of the visualisations.
3.3. Flow measurements
3.3.1. PIV measurements
A sketch of the PIV experimental set-up is reported in figure 3, which consisted of two CCD cameras (i.e. Imager sCMOS cameras by LaVision, 16 bit, 2560 × 2160 pixels, 6.5 μm pixel size, 50 frames s−1 maximum frame rate), a double-cavity Nd-Yag laser (i.e. BSL Twins by QUANTEL with 220 mJ energy at 12.5 Hz) and optical components (i.e. cylindrical and spherical lenses, 45° mirror) to create a vertically oriented light sheet.
Experimental set-up of the PIV measurements.

The two cameras were arranged one above the other with the optical axes perpendicular to the laser sheet. This solution, already adopted in similar experiments (see, e.g., Felli, Falchi & Pereira Reference Felli, Falchi and Pereira2010; Felli & Falchi Reference Felli and Falchi2018; Wang et al. Reference Wang, Ezequiel Martin, Felli and Carrica2020), allowed simultaneous acquisition of a field of view of 160 × 260 mm2 without jeopardising the spatial resolution of the measurement. Both cameras were fixed at the distance of 500 mm from the side window of the facility and were equipped with a 50 mm lens with 2.8 f-number.
The overall flow field evolution, covering the area of ~420 × 160 mm2, was measured in three steps and reconstructed assembling the phase-locked averaged results of corresponding acquisitions. To this end, the PIV system was mounted on a traverse system, which allowed the precise positioning of the complete PIV set-up (i.e. two cameras, laser, optics) during each step. This operation, executed with an accuracy of 0.1 mm, allowed any misalignment during patch reassembling to be minimised. Furthermore, patches were partially overlapped to correct any minimal camera misalignment during the final reconstruction of the flow field evolution.
Camera acquisition was conditioned upon the passage of the propeller reference blade for a selected angular position. This was achieved by synchronising the two cameras and the laser to a TTL OPR (i.e. once per revolution) signal, supplied by a 3600 pulse s−1 rotary incremental encoder. The synchronisation was managed by a programmable timing unit (i.e. LaVision PTU).
Sequences of 2000 image pairs were recorded for each propeller position in the range from 0° to 85° with 5° steps. This choice gave a statistical uncertainty estimated within 1 % and 5 % for the first- and second-order estimators, respectively.
Water was seeded with hollow glass particles of 10 μm diameter, achieving a uniform concentration of 0.65 particles mm−3.
A high-performance workstation and an acquisition/analysis software (i.e. La Vision Davis 8.4) completed the PIV rig.
Images were pre-processed using a local background subtraction routine with a 4 × 4 pixel kernel. The application of this procedure permitted the removal of any undesired reflection and improved the signal-to-noise ratio. Then, vector calculation was performed by using the advanced iterative multi-pass, multi-grid, image deformation algorithm implemented into the acquisition/analysis software (see Scarano Reference Scarano2002). In addition, taking advantage of the GPU architecture of the workstation and of the PIV algorithm, an accurate and fast evaluation of the images was achieved through the application of the direct cross-correlation at each iteration. Interrogation windows were iteratively reduced to the final size of 32 × 28 pixel and then overlapped by 50 %.
Vector fields were post-processed at each correlation pass applying the universal outlier detection and recursive replacement procedure (Westerweel & Scarano Reference Westerweel and Scarano2005) by the average of direct neighbour vectors over a 3 × 3 range.
A detailed reporting of the uncertainty analysis of the current PIV measurements is omitted for the sake of conciseness. Details of the adopted procedure can be found in the Report of the Detailed Flow Measurement Committee of the 27th International Towing Tank Conference (Aa Reference Aa2014). The overall error is estimated within 4.5 % of the freestream velocity.
3.3.2. LDV measurements
LDV measurements were performed by a two-component system by TSI, which consisted of a 6 W argon laser, a fibre optic probe, a 40 MHz Bragg cell and a digital burst correlator signal processor. The experimental set-up is reported in figure 4.
Experimental set-up of the LDV measurements.

In the current experiment, the probe was arranged to simultaneously measure the velocity components along the axial and vertical directions. The three-dimensional reconstruction of the velocity field was undertaken in two separate steps using the same optical set-up of the LDV probe and rotating the experiment by 90°. More specifically, the U–W and U–V components were acquired with the wing fixed on the top and side windows of the test section, respectively. LDV probe was fixed on a computer-controlled-traverse system which allowed a fully automatic displacement of the measurement volume with an accuracy of 0.1 mm in the three directions.
The tunnel water was seeded with 1 μm titanium dioxide (TiO2) particles. Water was seeded at the start of the tests, seed particle density remained substantially unvaried in the facility throughout the experimental campaign.
Data acquisition was accomplished by using a low-end personal computer, whereas the post-processing analysis, requiring several gigabytes of data storage and computational resources, was performed by a dedicated workstation.
The randomly acquired velocity bursts were referred to the propeller position using a synchronising device by TSI (i.e. TSI Rotating Resolver Machinery) and, then, phase-locked according to the tracking triggering technique (Felli & Di Felice Reference Felli and Di Felice2005). Specifically, velocity samples were distributed over 360 angular intervals of 2° width depending on the corresponding angular position of the propeller at the acquisition time and, then, statistically processed.
Velocity samples were recorded during 60 s at a data rate ranging from 0.8 to 6 kHz. This resulted in a statistical population which ranged from approximately 260 to 2000 samples per slot that gave a statistical uncertainty estimated from 0.18 % to 2.5 % of the freestream velocity. Velocity bias was minimised by applying a transit-time weighting to the statistical analysis. The overall measurement uncertainty is estimated within 3 % of the freestream velocity.
3.4. Pressure measurements
The detailed mapping of the wall-pressure fluctuations over the wing surface was performed designing and manufacturing a special wing such to flush mount a large number of sensors, to allow an adequate spatial resolution and to avoid any possible water penetration into the circuit. The wing consisted of a steel structure and two sets of three covers (i.e. one set per side), which were suitably designed to arrange different grid configurations on both sides of the wing. Each cover was designed to host a maximum of 24 sensors simultaneously in 4 blocks with 6 positions each. The three covers had the same grid design, 0.05D and 0.1D (where D is the propeller diameter) shifted each other in the vertical direction. This allowed a total of 72 positions per side to be mapped and, thus, the spatial resolution of the measurement to be improved, which would be constrained by sensor encumbrance otherwise. Major details are reported by Felli et al. (Reference Felli, Grizzi and Falchi2014).
The wing was instrumented with relative pressure transducers by ENTRAN (i.e. EPN D11). These sensors feature high-sensitivity, acceleration-compensated quartz pressure elements. They can measure very small pressure disturbances in much higher static heads, and are therefore suitable for the intended purpose. The nominal sensitivity is 14 mV psi−1, and the resonant frequency is higher than 15 kHz. They also feature the full range of 25 psi. Pressure signals were conditioned by a home-made device and then acquired by a 20 channel 24 bit acquisition system by PROSIG (i.e. PROSIG P8200). The A/D converter was set to sample pressure fluctuation signals at 40 kHz for 100 s.
Considering the apparatus and the operational procedures, experimental and bias errors in the wall-pressure measurements were estimated to be within 6 %. More specifically, the major contribution was represented by the perturbation induced by wing vibrations, whose amplitude was small enough to give a contribution to the final uncertainty estimated within 5 %. The uncertainty in the statistical analysis, estimated using Student's t distribution with 97.5 % confidence level, ranged from 0.1 % to 0.5 % depending on the local standard deviation of pressure fluctuations. A calibration procedure in which sensors were subjected to a fluctuating acoustic pressure source of known amplitude was applied to measure the actual sensitivity of pressure transducers. Calibration revealed variations in the sensitivity values as small as 0.2 %.
4. Reference frames and dimensionless groups
The interaction between a wing of thickness Tw and a helical vortex of core radius σ 0, and circulation Γ generated by a propeller of diameter D, operating at the rotational speed n and at the flow velocity U∞, is governed by a variety of dimensionless parameters (figure 5).
Sketch of the propeller vortex–wing configuration.

The ratio of the relative vortex–wing velocity Uw (where Uw is the average flow speed at the wing leading edge) and of the average axial velocity in the vortex core w 0 to the maximum swirl velocity within the vortex core defines the impact parameter I = 2 ${\rm \pi}$Uwσ 0/Γ and the axial flow parameter A = 2 ${\rm \pi}$w 0σ 0/Γ, respectively. Additional (relevant) dimensionless numbers are:
(i) the thickness parameter Tw/σ 0, which is the ratio of the wing thickness Tw and the nominal radius of the vortex core σ 0;
(ii) the vortex and wing Reynolds numbers, which are defined as Rev = Γ/υ and Rew = Uwc/υ, where c is the chord length of the wing and ν is the kinematic viscosity;
(iii) the propeller advance ratio J = U∞/(nD), which is the ratio of the freestream fluid speed to the propeller tip speed.
Unless otherwise specified, all variables in the remainder of the paper are made non-dimensional using the wing chord c (i.e. c = 180 mm) as length scale, the ratio T = c/Uw as time scale and the flow density ρ (i.e. ρ = 1000 kg m−3).
The effect of propeller loading (and vortex strength) was studied for four values of the advance ratio, corresponding to heavy (J = 0.5 and 0.65), moderate (J = 0.88) and weak (J = 1) propeller loading. Propeller loading was varied keeping the propeller rotational speed constant at n = 25 rps, changing the flow speed.
The values of dimensionless parameters for the cases considered in the paper are reported in table 1.
The test matrix included:
(i) time-resolved visualisations of the propeller vortices during the interaction with the wing;
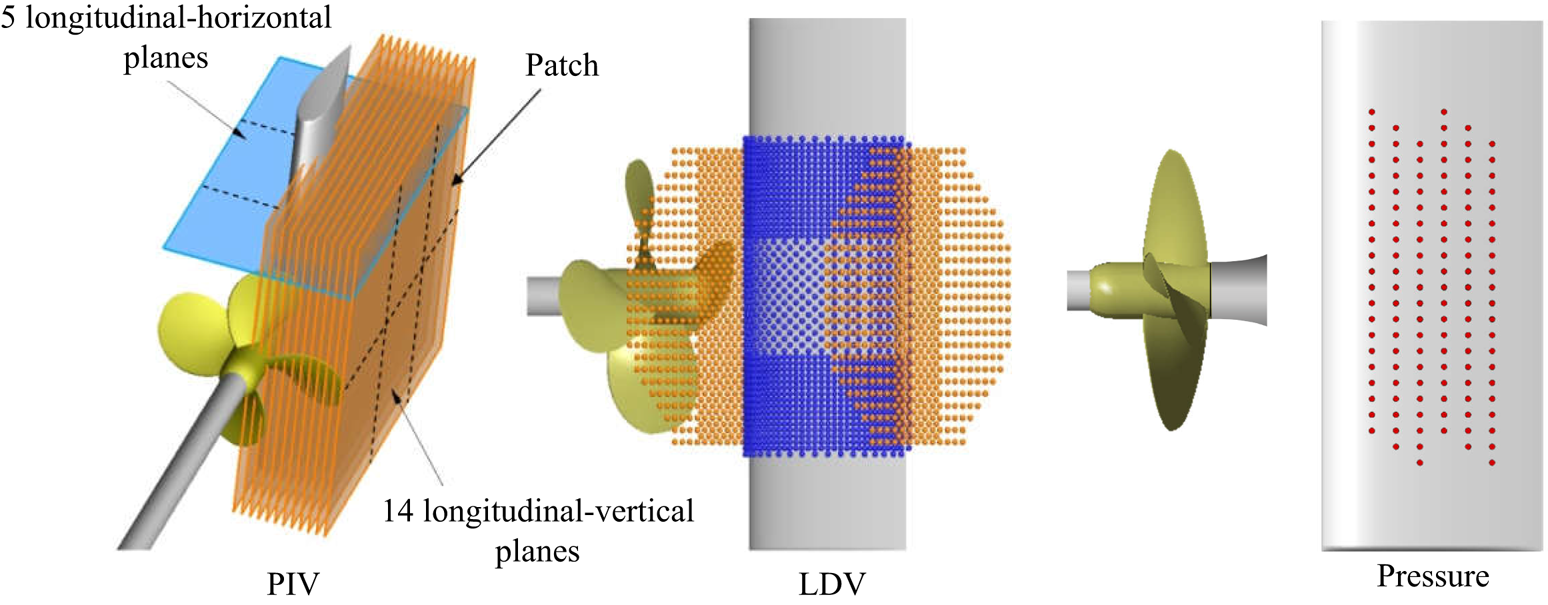
(ii) PIV measurements over 14 evenly spaced vertical-chordwise sections of the wake from y/D = 0 to y/D = 0.5, extended from x = 0 to x = 1.83D;
(iii) LDV measurements along 2 transversal sections of the wake positioned just in front and behind the wing, each consisting of a grid of ~700 points;
(iv) LDV measurements on the wing surface using a grid of 1200 points thickened in the tip vortex region;
(v) wall-pressure measurements on the wing surface using a grid of 144 positions (72 positions per side).
Measurement grids are shown in figure 6. Flow visualisations were performed at J = 0.5, J = 0.65, J = 0.88 and J = 1. Velocity and pressure measurements were performed at J = 0.88. For the sake of conciseness, only the most relevant results are reported in this paper. An exhaustive analysis of the pressure measurement, which is out of the scope of the present paper, was reported by Felli et al. (Reference Felli, Grizzi and Falchi2014).
Measurement grids.
The reference frame used for this work has the origin O at the intersection between the propeller axis and the leading edge of the wing, the x axis downstream-oriented along the propeller axis, the y axis along the horizontal direction toward starboard, the z axis along the upward vertical. A second cylindrical reference frame O′–x′rθ with the origin O′ in the intersection between the propeller disc and the rotation axis, the x′ axis downstream-oriented along the propeller axis, the R axis along the radial outward and the θ axis along the azimuth was used to reference the propeller position.
5. Results
5.1. Tip vortex–wing interaction
Following the classification by Marshall & Yalamanchili (Reference Marshall and Yalamanchili1994), Marshall & Grant (Reference Marshall and Grant1996) and Filippone & Afgan (Reference Filippone and Afgan2008) and according to the dimensionless parameters described in § 4, the tip vortex–wing interaction studied in the present paper can be categorised as a vortex–body oblique interaction at α = 105° impact angle (see figure 7). This interaction, characterised by a thickness parameter Tw/σ 0 greater than order unity (see table 2), involves a considerable bending of the vortex about the wing leading edge.
(a) Sketch of the early interaction between the propeller tip vortex and the wing. (b) Magnified view of the vortex approaching the leading edge of the wing.

Governing parameters.

The underlying evolution mechanisms of the tip–vortex system can be split into three phases (figure 8):
(i) approach phase and leading edge flow, which includes the vortex evolution before the encounter with the wing and the early interaction with the leading edge of the wing;
(ii) vortex–wing interaction phase, which includes the dynamics of the vortex portions on the pressure and suction side of the wing during the penetration (in the present configuration, the suction side is defined by y > 0, z > 0 and y < 0, z < 0 and the pressure side by y < 0, z > 0 and y > 0, z < 0).
(iii) vortex reconnection phase, which includes the rejoining process of the vortex branches from the pressure and suction sides of the wing.
Evolution phases of the interaction between a propeller tip vortex and a wing.

5.1.1. Approaching phase and leading edge flow
An overview of the evolution mechanism of the tip vortices while approaching the wing is reported in figures 9 and 10, which show the magnified side and bottom views of the leading edge region of the wing, respectively.
Magnified side views of the progressive deformation of the incident tip vortex (marked by a red arrow) while approaching the leading edge of the wing. Snapshots refer to the propeller operating at J = 0.88.

Magnified bottom views of the progressive deformation of the incident tip vortex while approaching the leading edge of the wing. Snapshots refer to the propeller operating at J = 0.88.

The approaching phase is characterised by a complex deformation mechanism of the tip vortex, which undergoes a considerable progressive bending while it is advected towards the stagnation point, similarly to what was observed in the interaction of a line vortex with a circular cylinder (see, e.g., Marshall & Yalamanchili Reference Marshall and Yalamanchili1994; Gossler & Marshall Reference Gossler and Marshall2001) or with a wing with equivalent thickness and impact parameters (see, e.g., Johnston & Sullivan Reference Johnston and Sullivan1993; Marshall & Yalamanchili Reference Marshall and Yalamanchili1994).
Tip vortex deformation involves two major contributions.
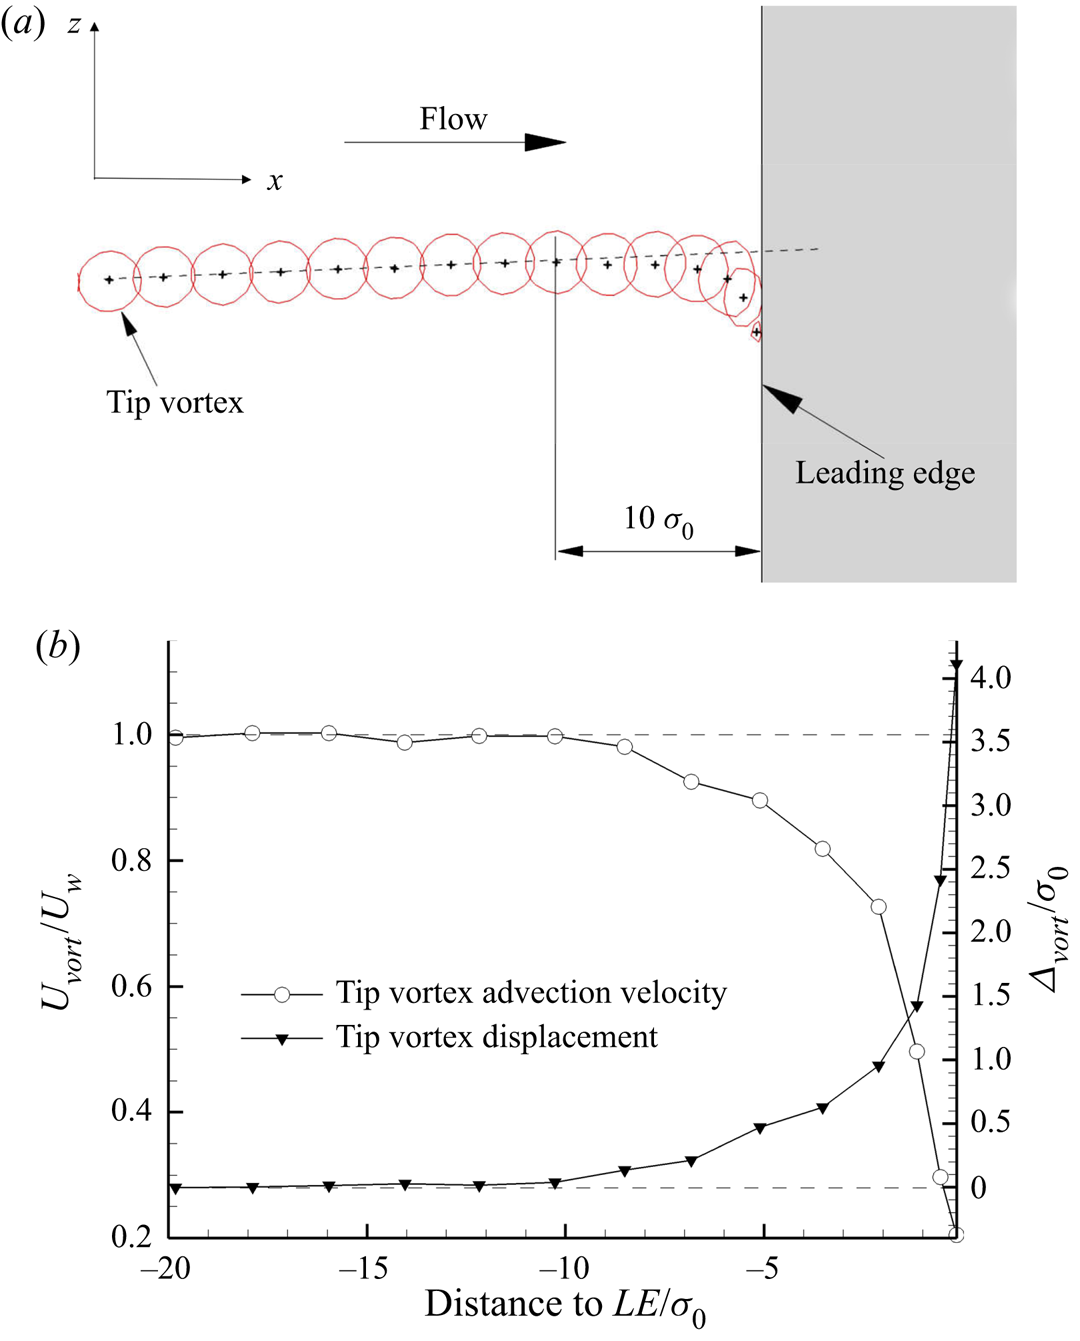
(i) A streamwise bending caused by the progressive increase of the static pressure toward the stagnation point, which implies a localised deformation of the tip vortex portion corresponding to the wing leading edge region and the formation of a kink just above the wing, already before the encounter, as clearly shown in figure 10. Flow visualisations indicate tip vortex deformation to initiate at nearly x = 10σ 0 from the stagnation point, which corresponds to the position from which wing induced flow deceleration starts to be manifested (figure 11). The rate of tip vortex deceleration/deformation increases weakly up to about x = 10σ 0 from the stagnation point and then undergoes a rapid intensification until the encounter, as shown in the bottom of figure 11.
(ii) A spanwise bending, which involves a deformation of the vortex in the direction away from the centre of rotation. A side view of this deformation is reported in figure 9. This bending is attributed to the image vortex effect at the wing leading edge (see, e.g., Johnston & Sullivan Reference Johnston and Sullivan1993; Felli et al. Reference Felli, Camussi and Guj2009), as proved by the occurrence of a vorticity sheet with opposite sign to the incident tip vortex, in the leading edge of the rudder (see figure 12). Figure 11(a) shows a deviation of the tip vortex trace from the unperturbed trajectory occurring approximately 6.8σ 0 before of the encounter and increasing as the vortex–wing distance reduces.
(a) Phase-locked traces (iso-line at ωyT = 15) of the tip vortex during the approach and encounter phases. Phase-locked traces are taken with an angular spacing of Δθ = 10°. (b) Evolution of the advection speed Uvort/UW and of the vertical displacement relative to the undisturbed position (Δvort/σ 0) versus the distance from the leading edge. The figure refers to the propeller operating at J = 0.88.
Instantaneous distributions of the out-of-plane vorticity ωyT during the encounter phase. Values refer to the propeller operating at J = 0.88.

The phase-locked averaged trace of the out-of-plane vorticity (figure 13) provides a good estimation of the wing induced perturbation on the vortex core. More specifically, vortex core undergoes both shape deformation and size reduction as it approaches and encounters the wing leading edge, as also documented by the visualisations of figures 9 and 10. Away from the wing and up to about one vortex core radius distance from the leading edge, the distribution of the vorticity in the vortex exhibits a nearly axisymmetric trend, which is, thus, consistent with a circular-shaped cross-section of the core, as shown in figure 13.
Iso-contours of the phase-locked out-of-plane vorticity at different distances from the leading edge. The distance is indicated in the header of each figure. Values refer to the propeller operating at J = 0.88.

In proximity of the stagnation point, starting from ~1.1σ 0, wing-induced perturbation causes a progressive shape deformation of the vortex core as proved by the increasingly pronounced elongation of the vortex trace in the wing spanwise direction as the vortex–wing distance reduces (figure 13). This behaviour is in agreement with the results from Affes & Conlisk (Reference Affes and Conlisk1993) and Krishnamoorthy, Gossler & Marshall (Reference Krishnamoorthy, Gossler and Marshall1999) for the case of a normal vortex interaction with a cylinder at high values of the impact parameter. Instead, a different trend is observed in the distribution of the iso-vorticity contours in the vortex core, which do not exhibit the C-shaped region of high vorticity magnitude on the vortex side farthest from the body, as shown by Krishnamoorthy et al. (Reference Krishnamoorthy, Gossler and Marshall1999). The present author's conjecture is that the C-shaped region of high vorticity magnitude described by Krishnamoorthy et al. (Reference Krishnamoorthy, Gossler and Marshall1999) might be mostly due to the contribution of its spanwise component, which grows progressively as vortex bends about the leading edge. This vorticity component is not resolved in the current PIV measurements.
The topology of the vorticity field when the vortex has encountered the wing leading edge reveals the appearance of a vorticity sheet, rotating in the opposite direction to the incident vortex, which separates from the wing and wraps around the vortex core (figure 12).
This behaviour is further proved by the contour plots of the out-of-plane vorticity in figure 13 whose distribution, perfectly axisymmetric far from the wing, tends to deviate increasingly as the vortex approaches the leading edge. This phenomenon is analogous to the vortex-induced boundary-layer separation mechanism described by Krishnamoorthy et al. (Reference Krishnamoorthy, Gossler and Marshall1999) and Gossler & Marshall (Reference Gossler and Marshall2001) for the case of a normal vortex interaction with a cylinder at high values of the impact parameter.
The approach phase of the vortex with the wing involves a rapid growth of the turbulence levels when the vortex is close to the wing. More specifically, the turbulence levels in the tip vortex core remain nearly constant for d > 7σ 0 and then start to undergo a gradual growth until increasing considerably for vortex distances less than the core radius (i.e. d ≤ σ 0; see figure 14).
(a) Radial distribution of the turbulent kinetic energy (TKE; i.e.  $TKE = ({u^{^{\prime}2}} + {v^{^{\prime}2}})/U_W^2$) for different vortex distances to the leading edge. (b) Evolution of the maximum TKE in the vortex core versus the distance from the leading edge. The figure refers to the propeller operating at J = 0.88.

5.1.2. Vortex penetration phase
The non-perpendicular encounter between the vortex and the wing causes a non-symmetrical interaction on the pressure and suction sides of the wing, as clearly shown in figures 8 and 15 and as pointed out by Marshall & Yalamanchili (Reference Marshall and Yalamanchili1994).
Magnified side views of the vortex encounter phase (flow moves from left to right). Snapshots at the top right and bottom show the positions of the incident vortex at three even-spaced instants during the encounter with the leading edge. The figure refers to the propeller operating at J = 0.88.

At the early phase of the interaction, the incident vortex undergoes a progressive stretching while it wraps around the leading edge of the wing. This behaviour is well documented in the flow visualisations of figure 15 in which the cavitating trace of the tip vortex appears to progressively reduce and stretch while proceeding over the forward portion of the wing. The significant decay of the cavitating trace of the vortex portion in close contact with the wing surface is consistent with the mechanism of vorticity cross-diffusion, which involves the vortex and the boundary layer, as documented by Krishnamoorthy et al. (Reference Krishnamoorthy, Gossler and Marshall1999) and Liu & Marshall (Reference Liu and Marshall2004) for the case of an orthogonal vortex–blade encounter. In fact, the decay of tip vortex cavitation is effective as long as the vortex lies parallel to the wing surface where the process of vorticity cross-diffusion between the vortex and the boundary layer is underway, and goes back to its original strength as it detaches from the wing.
Image vortex effects lead the incident vortex to move outwards along the wing spanwise direction as it starts to interfere with the body (see figure 15), as already reported in § 5.1.1.
The time history of the spanwise component of the vortex advection speed during the approach and the encounter phases exhibits different trends that are ascribable to the different nature of the underlying mechanisms of vortex–wing interaction before and after the encounter (figure 16). During the approach phase (t < 0 in figure 16), the vortex speed undergoes a progressive increase in the spanwise direction owing to progressively more intense outward deflection induced by the image vortex while the vortex approaches the leading edge. The acceleration of the spanwise component of the vortex advection speed persists as long as the vortex starts to interact with the boundary layer of the wing.
Vertical (spanwise) component of the vortex advection speed Vvort/UW before and during the encounter. Values refer to the propeller operating at J = 0.88.

After the encounter (t > 0 in figure 16), the spanwise component of the vortex advection speed undergoes a gradual reduction while the vortex is advected outwards along the trailing edge of the wing. This effect is ascribable to the aforementioned mechanism of vorticity cross-diffusion that involves the incident vortex and the wing boundary layer implying a weakening mutual induction effect between the incident vortex and its image as the encounter progresses.
Figure 15 shows the effect of the vortex spanwise speed deceleration during the encounter based on the vortex positions relative to three even-time instants during and immediately after the collision.
During vortex penetration, the dynamics of the vortex branches on the suction and pressure sides of the wing is strongly influenced by the propeller rotational flow.
During the early stage of the impingement, the vortex undergoes a progressive stretching with a significant reduction of the core radius while it wraps around the leading edge and initiates a strong interaction with the streamwise vorticity of the boundary layer induced by the propeller rotating flow.
The interaction involves turbulent, momentum-deficient fluid to entrain from the boundary layer into the vortex and causes a decay and an increase of the circulation of the pressure and suction side branches due to the opposite and same vorticity sign relative to the boundary layer flow, respectively (see, e.g., Cutler & Bradshaw Reference Cutler and Bradshaw1993; Muscari et al. Reference Muscari, Dubbioso and Di Mascio2017). As a result of the vortex–boundary layer interaction either the two vortex branches break into two smaller filaments that, in turn, keep wrapping around the leading edge of the wing, whereas detach from the body (suction and pressure side filaments 1 in figure 17) and move downstream with the main flow (suction and pressure side filaments 2 in figure 17).
Magnified bottom views of the incident vortex during the encounter and the early the penetration phase. Snapshots refer to the propeller operating at J = 0.88.

Reconnection between the vortex lines that originate within the core of the penetrating vortex to those within the boundary layer keeps the vortex portions on the suction and pressure sides of the wing connected during vortex penetration into the wing, as shown in figure 18 (see Kida & Takaoka Reference Kida and Takaoka1994; Saunders & Marshall Reference Saunders and Marshall2015).
Connection of the pressure and suction side branches of the incident vortex during the penetration phase. Snapshot refers to the propeller operating at J = 0.88.

Downstream of the leading edge region, the evolution of the two filaments branching out from the vortex portions on the pressure and suction sides of wing is characterised by a substantially different behaviour and shown in figure 19. Specifically, we have the following results.
(i) The two filaments breaching out from the vortex portion on the pressure side of the wing initiate a spiral motion around each other forming a double helix and remain attached to the wall while they move downstream. A similar behaviour is reported in an earlier study by Krishnamoorthy & Marshall (Reference Krishnamoorthy and Marshall1994) for an orthogonal cutting of a vortex with ambient axial flow by a thin flat plate, on the side where the vortex axis is compressed. The magnified views of the vortex in figure 20 provide a clear description of the breakdown mechanism, showing the two filaments of the double helix to branch out of the vortex and to proceed with the main flow. The rotation of the vortex and of the two branching out filaments (counter-clockwise in figure 20) is opposite to the roll-up direction of the two spirals (clockwise in figure 20). The intensities of the two branches of the double helix are substantially comparable. A quantitative description of the vortex breakdown is provided in figure 21, which shows the phase-locked reconstruction of the normalised y-vorticity component (ωy) along the wing surface. The topology of the ωy trace associated with the breakdown of the pressure side branch of the incident vortex appears as a nearly circular region of negative vorticity, related to the filament’ wrapping around the vortex axis, surrounded by a wider region of positive vorticity, related to their circulation. The dimensionless propagation speed of the vortex breakdown, estimated from the visualisations measuring the displacement of the position where the vortex starts to branch out, is found to have a nearly constant value (i.e. 2 ${\rm \pi}$σ 0Wexp/Γ = 0.558 for the condition at J = 0.88). The estimated propagation speed of the vortex breakdown is found to approximate with a reasonable level of accuracy the value predicted by the analytical expression provided by Krishnamoorthy & Marshall (Reference Krishnamoorthy and Marshall1994) (i.e. 2${\rm \pi}$σ 0Wtheory/Γ = 0.704), considering the uncertainty in the experimental estimate of the propagation speed and the non-inclusion of the suction velocity in the analytical prediction (figure 22).
(ii) The two filaments branching out from the suction side portion of the vortex are engaged in deeply different evolution mechanisms in relation to each other. Specifically, the upstream filament undergoes a progressive stretching and thinning that persists during the whole penetration phase of the vortex, as confirmed by the persistence of the tail in the suction side branch of the tip vortex until it reaches the trailing edge of the wing (see figure 23). In contrast, the downstream filament increases in strength and twists around on itself forming a tight helical spiral that propagates upstream along the vortex axis while the vortex moves downstream (see figure 24).


Double helix breakdown mechanisms of the pressure and suction side branches of the tip vortex during the penetration phase. Contour plot describes the out-of-plane vorticity component  $\langle {\omega _y}\rangle T$. The figure refers to the propeller operating at J = 0.88.

Double helix breakdown of the pressure side branch of the incident vortex (flow moves from left to right). Snapshots refer to the propeller operating at J = 0.88.

Double helix breakdown of the pressure side branch of the incident vortex (flow moves from left to right). Distribution of the phase-locked out-of-plane vorticity component  $\langle {\omega _y}\rangle T$ along the wing surface. Cross-section AA is referenced in figure 22. Values refer to the propeller operating at J = 0.88.

Propagation speed Wexp of the double helix breakdown along the vortex axis (left) estimated from the displacement of the position where the vortex start to branch out and to form a double helix. Values refer to the propeller operating at J = 0.88.

Evolution of the double helix breakdown of the suction side branch of the incident vortex (highlighted with the red circles) during the penetration phase. Snapshots refer to the propeller operating at J = 0.88.

Meandering of the suction side branch of the tip vortex during the penetration phase. The red circles indicate the point at which the vortex starts to meander. The figure refers to the propeller operating at J = 0.88.

During the penetration phase, the global evolution of the propeller streamtube portions on the two faces of the wing exhibits opposite displacements, specifically an upward movement for y > 0 and a downward movement for y < 0. This effect is driven by the different rate of spanwise displacement of the suction and pressure side branches of the penetrating vortex which increases more and more chordwise.
The visualisations of the cavitating traces of the propeller vortices through the transparent wing in figure 25 provide an effective description of this phenomenon, showing the tendency of the suction (orange lines) and pressure (red lines) side branches of the incident vortex to converge towards the propeller centreline and to follow a nearly horizontal trajectory, respectively. In the author's opinion, the underlying mechanisms of the progressively increasing spanwise misalignment of the pressure and suction side vortex branches while they travel downstream is due to the combined effect of the image vortex and of the spanwise gradient of the total pressure on the wing. More specifically, the outward (inward) displacement induced by image vortex effect on the pressure (suction) side branch of the vortex (figure 26a) is contrasted (is favoured) by the pressure gradient induced by the propeller flow (figure 26b). As a result, the spanwise outward displacement of the pressure side branch will be smaller than the inward displacement of the suction side branch that increases more and more while the vortex travels downstream.
Trajectories of the pressure (dashed lines in red) and suction (dashed lines in orange) side tip vortex branches during the penetration phase (left). Circumferentially averaged distribution of the out-of-plane vorticity ωxT in a transversal plane 1 mm downstream of the wing trailing edge. Dashed lines in black represent the traces of the pressure and suction side branches of the vortex. The figures refer to the propeller operating at J = 0.88.

Explanation of the underlying mechanism of the different spanwise displacement of the pressure and suction side tip vortex branches during the penetration phase: (a) effect of the image vortex, (b) pressure distribution (i.e.  $p/U_W^2$) along the rudder surface, (c) image vortex (red arrow) and pressure gradient (blue arrow) effects on the streamwise evolution of the pressure and suction side vortex branches. Pressure values and snapshots refer to the propeller operating at J = 0.88.

Moreover, the (favourable) pressure gradient in which the suction side portion of the incident vortex is moved by its image vortex is stronger that the corresponding (adverse) pressure gradient on the pressure side, as documented in figure 26.
The rate of the progressive spanwise misalignment of the pressure and suction side branches of the incident vortex while they travel streamwise, being associated with the strength of the image vortex and with the intensity of the spanwise gradient of the pressure distribution, is expected to change with the propeller loading conditions.
5.1.3. Vortex reconnection phase
Vortex branches travelling on the suction and pressure sides of the wing undergo a complex reconnection mechanism that starts to develop in the trailing edge region and is completed within 0.5 chord lengths downstream of the wing.
A reconstruction of the global evolution of the pressure and suction side branches of the incident vortex is shown in figure 27. The vorticity of the boundary layer that keeps the two vortex portions connected during the penetration phase reorganises in a coherent filament bridging the suction branch in proximity of the trailing edge of the wing and the branch detached from the pressure side further downstream. Flow visualisation snapshots in figure 28 highlight the cavitating trace of the filament bridging the suction and pressure side branches of the vortex immediately downstream of the trailing edge. A three-dimensional reconstruction of the vortex reconnection mechanism after its penetration into the wing is shown in figure 29, which reports the propeller phase-locked iso-surfaces of the vorticity magnitude measured by LDV for J = 0.88.
Evolution of the pressure (red line) and suction (orange line) side vortex branches during the penetration phase. The dashed line in white is the filament reconnecting the two vortex branches downstream of the wing. Snapshots refer to the propeller operating at J = 0.88.

Visualisation of the filament reconnecting the pressure and suction side branches of the tip vortex downstream of the wing: (a) bottom view and (b) and back view. Snapshots refer to the propeller operating at J = 0.88.

Rejoining of the pressure (red line) and suction (orange line) side branches of the tip vortex downstream of the wing. The white line indicates the reconnecting filament. Iso-surfaces describes the phase-locked distribution of the vorticity magnitude |ω|T, with  $|\omega |= \sqrt {\omega _x^2 + \omega _y^2 + \omega _z^2}$ in the rotational upper region of the rotor. Values refer to the propeller operating at J = 0.88.

This result is in agreement with previous works about the crucial role of the boundary layer in the recovery mechanism of the incident vortex after penetration (see, e.g., Liu & Marshall Reference Liu and Marshall2004; Muscari et al. Reference Muscari, Dubbioso and Di Mascio2017).
5.2. Blade trailing edge wake and hub vortex
The motion of the vortex sheet generated at the trailing edge of the blades reveals a substantially similar behaviour to that seen for the tip vortex throughout the whole interaction process with the wing. Specifically, with reference to the iso-surfaces of the vorticity magnitude in figures 30 and 31, we found the following.
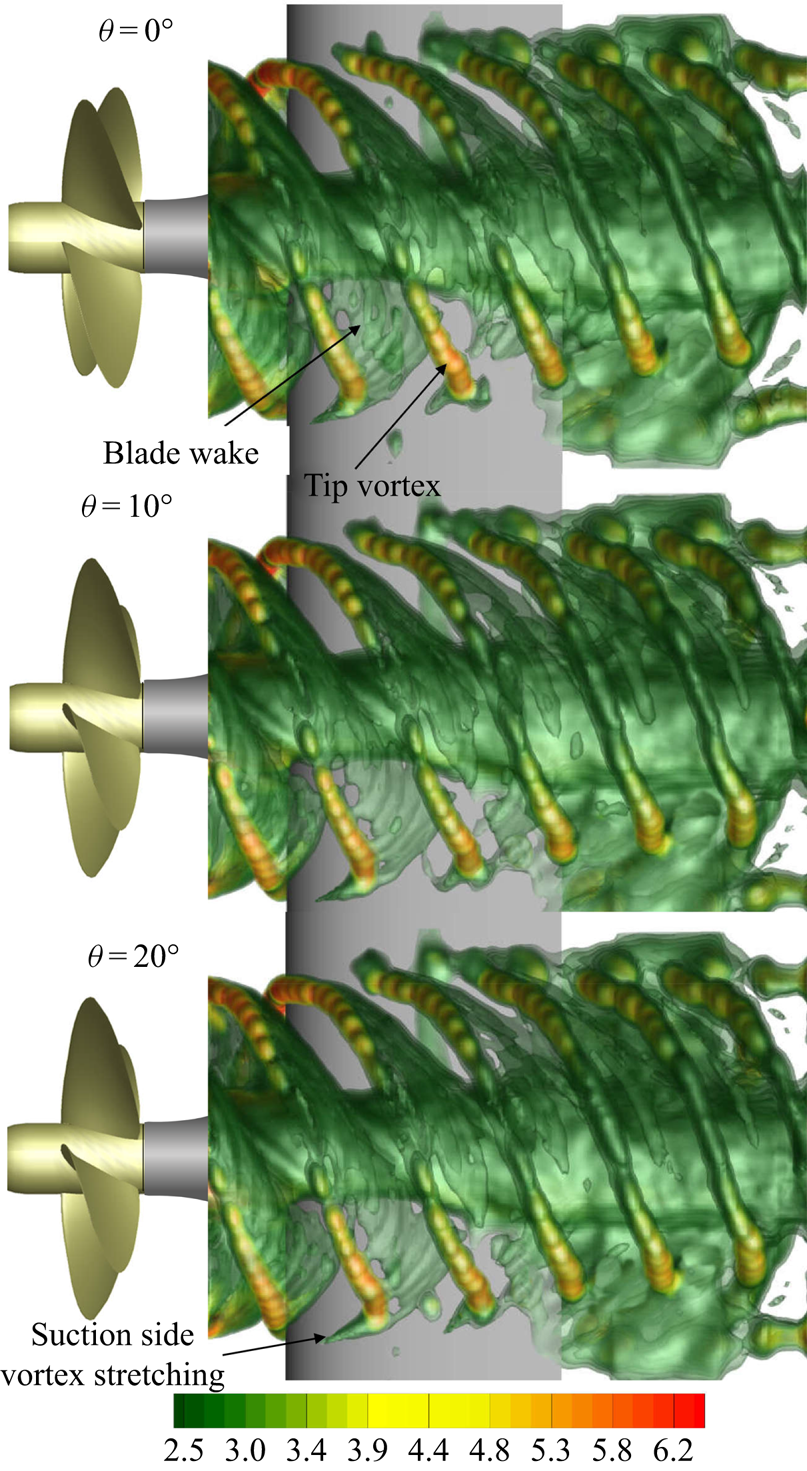
(i) During the encounter phase, the blade wake is gradually severed by the wing. The impact of the vortex filaments of the blade wake involves very high values of the thickness parameter (T = o(100)) and progressively larger collision angles as it penetrates into the wing due to the radially variable hydrodynamic pitch of the blade wake (Kerwin Reference Kerwin1986). For example, with reference to the case at J = 0.88, the variability of the collision angle ranges from nearly α = 140° to α = 105° moving outward along the blade wake from r = 0.1D to the tip vortex region (see figure 32) and the thickness parameter referred to the blade vortices is approximatively one order of magnitude larger than that of the tip vortex (i.e. Tw/σ 0 = 14.85, see table 2). This implies the penetration gradually involves all the vortex filaments from the inward to the outward regions of the blade wake, as shown in figures 30 and 31.
(ii) During the penetration phase, the vortex filaments of the severed blade wake portions on the pressure and suction sides of wing tend to reconnect with the vortex lines within the boundary layer of the wing with a mechanism similar to that described in Saunders & Marshall (Reference Saunders and Marshall2015). Similarly to the tip vortices, this reconnection and vorticity cross-diffusion mechanism is at the basis of the rejoining process of the suction and pressure side portions of the blade wake downstream of the wing.
(iii) Downstream of the body, the severed and spanwise misaligned portions of the blade wake deform and reconnect via the rejoining action of the trailing wake vorticity of the wing. The rejoining process of the blade wake is documented by the contour plots of the vorticity magnitude in figure 33, which reports the phase-locked evolution of the propeller wake in a transversal plane located just downstream of the wing trailing edge.
Phase-locked iso-surfaces of the y-vorticity magnitude |ωy|T for the propeller angular positions θ = 0°, θ = 10° and θ = 20°. Iso-surfaces drawn for 2 ≤ |ωy|T ≤ 4.8. Values refer to the propeller operating at J = 0.88.
Top and bottom views of the phase-locked iso-surfaces of the y-vorticity magnitude |ωy|T. Iso-surfaces drawn for 2 ≤ |ωy|T ≤ 4.8. Values refer to the propeller operating at J = 0.88.

Radial variation of the impact angles of the blade wake filaments. Values refer to the propeller operating at J = 0.88.

Process of blade wake rejoining downstream of the wing. Iso-contours refer to the phase-locked y-vorticity magnitude |ωy|T for the propeller angular positions from θ = 0° to θ = 110° with Δθ = 20°. Values refer to the propeller operating at J = 0.88.

The similarity of iso-contours of the axial vorticity magnitude measured at the same axial distance from the rotor plane in unperturbed condition (figure 34b) and in the presence of the wing (figure 34a) along with the complete recovery of blade wake ‘unperturbed’ trace after crossing the trailing wake of the wing (see figures 33 and 34) sustain the thesis of a substantially ‘neutral’ effect of the latter on the evolution of the blade vortex sheet. Furthermore, the vortical structures of blade wake do not seem to exert any notable effect on the dynamics of the tip vortices throughout the interaction with the wing, as one would expect considering the about one order of magnitude difference between their intensities.
Effect of the wing on the blade wake profiles. Comparison of the y-vorticity magnitude |ωy|T measured at the same section of the wake (a) with and (b) without the wing for θ = 0°, θ = 30° and θ = 60°. Values refer to the propeller operating at J = 0.88.

A more in-depth investigation of the blade trailing edge filament evolution during the interaction with the wing is a very challenging survey problem that implies a spatially resolved large-field-of-view, possibly time-resolved, volumetric approach due to the markedly three-dimensional nature of the involved flow structures and to the need to resolve the vortex structures of the blade wake both at macro- and micro-scales.
The interaction of the hub vortex with the wing, that might apparently resemble that typical of an isolated streamwise vortex with a wing (Rockwell Reference Rockwell1998), is actually more complex due to its highly three-dimensional structure formed by the helically intertwined vortices shed from the blade roots (Felli & Falchi Reference Felli and Falchi2018) and to the interference of the inner part of blade vortex sheet (Muscari et al. Reference Muscari, Dubbioso and Di Mascio2017). A detailed description of the hub vortex flow is reported by Muscari et al. (Reference Muscari, Dubbioso and Di Mascio2017) who highlighted the formation of hairpin structures from the interaction of the hub vortex with the boundary layer of the body. Unfortunately, the markedly three-dimensional and turbulent nature of these vortical structures whose experimental survey would have needed the use of a volumetric time-and space-resolved velocimetry technique (see, e.g., Felli, Falchi & Dubbioso Reference Felli, Falchi and Dubbioso2015) has not allowed further insight to be gained into the underlying mechanisms of the hub vortex interaction with the wing.
5.3. Propeller loading and blade number effect
Figure 35 shows snapshots of the propeller tip vortex interaction with the wing during the penetration phase for different values of the propeller loadings (i.e. J = 0.50, J = 0.65, J = 0.88 and J = 1.0).
Effect of propeller loading on the tip vortex–wing interaction. Snapshots refer to different values of the advance ratio J = U∞/(nD). Cyan, orange and white circles indicate the double helix breakdown of the suction and pressure side branches of the incident vortex in the leading edge region and the vortex branch on the suction side during the final penetration phase. The weaker strength of the propeller vortices for the higher values of the advance ratio do not make vortex trace visible when the low-pressure peak at the vortex core is higher than the vapor pressure.

The comparison does not seem to show any appreciable dependence of the vortex behaviour on the propeller loading conditions throughout the interaction with the wing. Indeed, in all the analysed conditions, the fluid dynamic phenomena underlying vortex approach, penetration and reconnection phases are seen to recur with substantially identical characteristics, thus giving a general validity to the findings of § 5 regardless of the propeller loading conditions (in the propulsive regime).
In the author's opinion, a likely explanation of this behaviour is that the sensitivity to propeller loading variations of the key parameters influencing the interaction between the propeller vortices and the wing (i.e. thickness parameter, impact parameter, axial parameter, propeller wake flow, impact angle, pressure distribution on the wing surface; see table 2) is not sufficiently high to determine a substantial modification of the basic mechanisms characterising tip vortex dynamics during the interference.
The results reported in § 5, obtained for a multi-bladed propeller configuration and thus for a system of Z = 4 tip vortices (Z = blade number), seem to exclude any propeller wake spiral-to-spiral induction effect to play a relevant role in the dynamics of the propeller vortices during the interaction with the wing as emerges comparing the results of the present study (i.e. Z = 4) with those from Muscari et al. (Reference Muscari, Dubbioso and Di Mascio2017) (i.e. Z = 1), relative to the same propeller geometry and loading conditions (figure 36). This statement is clearly valid as long as the interference involves propeller wakes in which the instability process (Felli et al. Reference Felli, Camussi and Di Felice2011) is not yet underway (that applies to all the conditions analysed in the present study). It follows that the simplified model of a single blade propeller–wing configuration (Muscari et al. Reference Muscari, Dubbioso and Di Mascio2017) can be reasonably adopted for further analyses related to the dynamics/effects of propeller tip vortex penetration into a wing/rudder.
Effect of the blade number. Topological comparison between the iso-surfaces of the vorticity magnitude relative to the flow measurements of the propeller wake–wing interaction and the computational fluid dynamics simulations by Muscari et al. (Reference Muscari, Dubbioso and Di Mascio2017) relative to the single-bladed configuration of the same propeller. Results refer to the propeller operating at J = 0.88.

6. Summary and conclusions
The fundamental underlying mechanisms of interaction between the propeller wake and a non-lifting wing for a high thickness parameter have been investigated in the present study.
The study consists of a comprehensive experimental survey of a reference propeller–wing configuration based on detailed flow measurements by LDV and PIV, time-resolved flow visualisations and detailed wall-pressure measurements.
The interaction between the propeller tip vortices and the wing occurs through a three-stage process. In the first stage, namely the approaching phase, tip vortices undergo a progressive deformation while they are advected towards the leading edge of the wing that involves a localised progressive bending in the streamwise and spanwise directions due to the increase of the static pressure toward the stagnation point and to the effect of the image vortex, respectively. Tip vortex bending is accompanied by shape deformation and thinning of the vortex core that starts to manifest about one vortex core radius upstream of the leading edge and, during the early stage of the encounter, by the appearance of a sheet of opposite vorticity that separates from the wing and wraps around the vortex core.
Further downstream, during the early stage of the encounter, vortex interaction with the boundary layer becomes evident through the appearance of a sheet of opposite vorticity that separates from the wing and wraps around the vortex core.
In the second stage, namely the vortex penetration phase, the incident vortex penetrates through the wing. The early phase of the penetration involves a progressive stretching and thinning of the vortex while it wraps around the leading edge of the wing. The vortex branches travelling on the pressure and suction side of the wing undergo a strong interaction with the wall that leads their vortex lines to break and reconnect to those within the boundary layer. This mechanism keeps the pressure and suction side branches of the vortex connected throughout the penetration.
During the penetration, the vortex portions on either side of the wing break in two smaller filaments that roll up around the vortex axis in a double helix. The strengths of the double helix filaments are substantially comparable on the pressure side. Differently, on the suction side, the downstream filament increasingly strengthens while moving downstream inducing the upstream filament to wrap around its axis.
In the third stage, nominally the vortex reconnection phase, the vortex branches travelling on the suction and pressure sides of the wing reconnect restoring the original vortex. The rejoining mechanism is driven by the boundary layer vorticity that reorganises in a coherent vortex filament bridging the suction side branch in correspondence of the wing trailing edge with the already detached branch from the pressure side.
The vortex sheet generated at the trailing edge of the blades exhibits a substantially similar behaviour to that observed for the tip vortices and does not show any remarkable effect on their evolution throughout the whole interaction with the wing.
The fluid dynamic phenomena underlying the approach, penetration and reconnection phases of the interaction recur with substantially identical characteristics regardless of the propeller loading conditions and the blade number as long as propeller wake is not yet destabilised.
In conclusion, the experimental survey has provided new quantitative and qualitative information about the dynamics of the propeller vortices during the interaction with a wing. Nevertheless, some aspects related to the in-depth understanding of the role of the wing boundary layer into the early penetration and the reconnection phases and of the onset mechanisms of vortex breakdown deserve further investigations. Furthermore, the crucial role of the propeller flow in differentiating the behaviour of the pressure and suction side branches of the vortex during the penetration phase enhances the interest on extending the study to lifting wings and destabilised propeller wakes.
Acknowledgements
This work was partially supported by the Italian Ministry of Defence in the framework of the research project ‘PRIAMO’ and by the U.S. Office of Naval Research (ONR) and Office of Naval Research Global (ONRG) under NICOP Grant N62909-19-1-2001, Drs K.-H. Kim and E. McCarthy program officers.
The author is grateful to Dr M. Falchi for his aid during the execution of the PIV measurements and to Mr F. Carta, Mr M. Orrico and Mr S. Principe for their valuable support during the design and preparation of the experimental set-up.
Declaration of interests
The author reports no conflict of interest.


 Open access