


Introduction
At the beginning of the 21st century, wireless services are well established within several technological sectors. Microwave and RF electromagnetic (EM) technology can be found at medical, industry, military, and domestic devices since there is the need of wireless connectivity. The most common use is the support of wireless mobile communications. In the last few years, the mobile phone has become an integral part of everyday life for numerous people. The concern of the safe exposure of humans at RF electromagnetic waves has attracted the scientific community.
The development of mobile phone technology has led to a rich pool of research studies to determine potential hazards caused by its use. It has been found that the rate of energy absorption in head tissues depends on the tissue properties (the dielectric properties, the mass density, and the anatomy of the head) and the characteristics of the RF radiation source (power, frequency, and distance) [Reference Zervos, Alexandridis, Petrovic, Dangakis, Kolundzija, Djordjevic and Soras1–Reference Al-Mously7].
Furthermore, several studies have addressed the relationship between the spatially averaged specific absorption rate (SAR) and the local temperature rise induced by an RF source. Examining the exposure of anatomically based human whole-body models on EM plane waves, Razmadze et al. [Reference Razmadze, Shoshiashvili, Kakulia and Zaridze8] found that the SAR averaged over 10 g of mass (SAR10g) outmatches the SAR over 1 g of mass (SAR1 g) providing the best representations of the related steady-state temperature rise.
The obtained results from Sabbah et al. [Reference Sabbah, Dib and Al-Nimr9, Reference Sabbah, Dib and Al-Nimr10] confirm the importance of performing a thermal analysis along with the electromagnetic dosimetry. Further, the effect of localized SAR should be related to the temperature rise in the head for cellular mobile phones [Reference Sabbah, Dib and Al-Nimr10]. Wessapan et al. [Reference Wessapan and Rattanadecho11, Reference Wessapan, Srisawatdhisukul and Rattanadecho12] found that the temperature distributions in the human head induced by mobile phone radiation are not directly proportional to the SAR distribution. This probably occurs because of the tissue dielectric and thermal properties, the blood perfusion, and the penetration depth of the electromagnetic power. The correlation between peak spatially averaged SAR and peak temperature rise in the human head by cell phone antennas was quantified by Hirata et al. [Reference Hirata and Shiozawa13, Reference Hirata, Fujimoto, Asano, Wang, Fujiwara and Shiozawa14].
An important issue to highlight is that nowadays children tend to obtain a mobile phone even younger than the past years. It is also observed that parents allow preschool children to use a cell phone. Therefore, the attention of the scientists has moved on determining the potential hazards provoked from the use of mobile phones at sensitive population groups such as pregnant women and children.
Applying simplified phantoms of the human head as layered lossy dielectric spheres, Koulouridis et al. [Reference Koulouridis and Nikita15] observed similar levels of absorbed power (Pabs) between adult and children head models. Under specific simulation scenarios, Beard et al. [Reference Beard, Kainz, Onishi, Iyama, Watanabe, Fujiwara, Wang, Bit-Babik, Faraone, Wiart, Christ, Kuster, Lee, Kroeze, Siegbahn, Keshvari, Abrishamkar, Simon, Manteuffel and Nikoloski16] indicated that a larger head model (adult) reached a higher peak SAR than a smaller head (child). Furthermore, Christ et al.l [Reference Christ, Gosselin, Christopoulou, Kuhn and Kuster17] assessed that there are no age-dependent changes of the peak spatial SAR when averaged over the entire head whereas Gosselin et al. [Reference Gosselin, Christ, Murbach, Ryf, Kühn, Christopoulou, Neufeld, Gabriel, Peyman and Kuster18] indicated that a correlation between the maximum SAR10 g and the age of the head model could not be established for similar thicknesses of the pinna. Yet, Fernandez-Rodriguez et al. [Reference Fernandez-Rodriguez, De Salles and Davis19] confirmed that the peak spatial SAR (psSAR) in a child's brain is higher than in the adult's brain.
In [Reference Lu and Ueno20], two-child head models (6 and 11 years old) and one adult head model (34 years old) were utilized, and it was found that the SAR distributions in the human brain are age dependent. Specifically, there is deeper penetration of the absorbed SAR in the child's brain and SAR can be significantly higher in sub-regions [Reference Lu and Ueno20]. It seems that the increase in power absorption from a mobile phone is inversely proportional to the child's age due to differences such as a lower thickness of pinna, skin, and skull of the younger child models. It is indicated that, in general, children are more vulnerable to electromagnetic radiation than adults [Reference Wiart, Hadjem, Wong and Bloch21–Reference Morris, Lloyd Morgan and Davis23].
Moreover, radio frequency radiation from radio terminals upon a pregnant woman and her fetus has drawn the scientific attention due to the increased possibility of placing a mobile phone close to the abdomen. Takei et al. [Reference Takei, Nagaoka, Nishino, Saito, Watanabe and Takahashi24] underlined that the positional relationship between a smartphone, the placenta, and the fetus is of considerable importance. Research studies on radiation from mobile phone [Reference Togashi, Nagaoka, Kikuchi, Saito, Watanabe, Takahashi and Ito25], portable radio terminals [Reference Akimoto, Kikuchi, Nagaoka, Saito, Watanabe, Takahashi and Ito26] and magnetic resonance imaging (MRI) [Reference Hand, Li, Thomas, Rutherford and Hajnal27] coils indicate that the SAR in the fetus depends on the frequency; a factor that impacts the penetration depth. Chiaramello et al. [Reference Chiaramello, Parazzini, Fiocchi, Ravazzani and Wiart28] found that the level of exposure of a fetus at the third trimester of pregnancy was higher than the first. Also, the higher the frequency is, the lower value of SAR is calculated at the fetus.
To address the EM near-field exposure of an Ultra High Frequency – Radio Frequency Identification (UHF – RFID) reader in adults, pregnant women, and children, Fiocchi et al. [Reference Fiocchi, Markakis, Ravazzani and Samaras29] found out that the highest exposure values in terms of the peak spatial SAR10 g were acquired in the pregnant women. Also, Fiocchi et al. [Reference Fiocchi, Parazzini, Liorni, Samaras and Ravazzani30] pointed out that, under several exposure scenarios of pregnant women at RFID readers, the highest increase in temperature for two different pregnant women models was exhibited in the scenario in the front of the pregnant abdomen and in the oblique direction with respect to the abdomen. The exposure of pregnant women at polarized plane waves [Reference Nagaoka, Saito, Takahashi, iIto and Watanabe31, Reference Nagaoka, Saito, Takahashi, Ito and Watanabe32] and at electromagnetic wave radiation from a smartphone [Reference Takei, Nagaoka, Nishino, Saito, Watanabe and Takahashi24] has been investigated indicating that the gestational age of the pregnant-women models affected the fetus averaged SAR.
EM exposure within metallic environments is, also, a topic of great interest because of the multiple wave reflections occurring inside or near them. The averaged SAR values can be increased inside metallic enclosures compared to free space [Reference Leung, Diao, Chan, Siu and Wu33–Reference Ruddle35] and at the presence of metallic walls [Reference Lazarescu, David, Nica and Dafinescu36, Reference Jemima Priyadarshini, Anita Jones Mary, Sugumar and Ravichandran37]. Whole-body exposure assessment might be equally significant with the peak averaged SAR values in the head at fully and partially enclosed metallic elevator cabins [Reference Tang, Chan, Fung and Leung38, Reference Tang, Chan, Fung and Leung39]. The peak SAR averaged over 10 g mass of tissue depends on the position of the passenger and the antenna location against the elevator walls [Reference Simba, Hikage, Watanabe and Nojima40, Reference Karatsi and Koulouridis41]. Further, the dosimetry values depend on the number of people inside metallic enclosures [Reference Ruddle35, Reference Chan, Leung and Siu42]. The structure of the enclosure and its material are important in determining SAR, as well [Reference Simba, Hikage, Watanabe and Nojima40]. Furthermore, as the buildings are getting taller and taller (e.g., department stores and companies), the need of wireless communication inside the elevator cabins has become important. Technology is providing many solutions [Reference Chen, Deng and Yi43] so that a mobile phone can be efficiently used inside the elevators.
This paper examines the electromagnetic exposure and thermal safety of a 5-year-old child and a 7th months pregnant woman, along with the fetus, inside an elevator cabin at a real-life scenario exposure. The cell phone, which is a numerically realistic model device [Reference Pinto, Ghanmi, Hadjem, Conil, Namur, Person and Wiart44], is placed at three different talk positions: parallel, tilt and cheek based on the IEEE/IEC 62209–1528-2020 std and CENELECEN 62209 standards [45, 46]. Two operating mobile phone frequencies at 1000 and 1800 MHz are implemented. The numerical dosimetry simulations were carried out with the commercially available EM software SEMCAD-X [47].
Specific absorption rate (SAR) & limits
Restrictions on human exposure to time-varying electromagnetic fields are well-established based on possible health effects. The physical quantity applied to determine these constraints is the SAR which represents the level of absorption of electromagnetic power by the biological tissue per unit mass of tissue. The SAR values at any point inside the tissue can be calculated as:

where σ (Si/m) is the electrical conductivity, ρ (kg/m3) is the mass density of tissue and E is the effective value of the induced electric field.
The whole-body SAR can be calculated as:

where P abs(W) is the absorbed power and m (kg) is the whole mass of the absorber.
Standards for safety levels, with respect to human exposure to radiofrequency electromagnetic fields, determine that the maximum allowed peak spatial average SAR over 10 g of tissue is 2.0 W/kg and Whole-Body averaged SAR is 0.08 W/kg [48, 49]. The above values are calculated for 6 minutes of exposure.
Bioheat equation
The steady-state temperature distribution using the standard Pennes bioheat equation [Reference Pennes50] is calculated by:

where ρ (kg/m3) is the density of the medium, c (J/kg⋅°C) is the specific heat, T (°C) is the tissue temperature, t (sec) is the time, k (W/m⋅°C) is the thermal conductivity of the tissue, Q (W/kg) is the metabolic heat generation rate, S (W/kg) is the SAR, ω (m3/kg⋅s) is the blood perfusion rate, ρb (kg/m3) is the mass density, cb (J/kg⋅°C) is the specific heat capacity, and Tb (°C) is the temperature of blood [Reference Christ, Guldimann, Buhlmann, Zefferer, Bakker, Van Rhoon and Kuster51].
The boundary conditions for the temperature distribution applied in this study are the following [Reference Fiocchi, Parazzini, Liorni, Samaras and Ravazzani30, Reference Bakker, Paulides, Neufeld, Christ, Kuster and van Rhoon52]:
• Mixed boundary condition:
(4)$$k\displaystyle{{\partial T_{incr}} \over {\partial n}} + hT_{incr} = 0$$

where h is the heat transfer coefficient, Tincr is the increased temperature and n is the unitary vector to the surface of the interface. Mixed boundary conditions were applied at the interfaces of tissues with the air. Between the skin and the outside air h was set as hskin−air = 8 W/(m2⋅K) and between the cornea and the external air h was set as hcornea−air = 20 W/(m2⋅K) [Reference Christ, Guldimann, Buhlmann, Zefferer, Bakker, Van Rhoon and Kuster51].
• Neumann boundary condition:
(5)$$k\displaystyle{{\partial T_{incr}} \over {\partial n}} = 0$$

Neumann boundary condition was applied at the interface between the tissues and the air-filled cavities (internal air, bronchi lumen, esophagus lumen, pharynx, and trachea lumen).
• Dirichlet boundary condition:
(6)$$T_{incr} = 0$$

Dirichlet boundary condition was applied at the interface between blood (artery, veins, and umbilical cord) and every tissue perfused by blood (all the tissues except air tissues, maternal and fetal cerebrospinal fluid (CSF), maternal and fetal humor vitreous, amniotic fluid, teeth, stomach lumen, and small intestine lumen). In addition, the external (to the body) room temperature was set as Texternal = 24°C, and the temperature of the human models was set as Thuman = 37°C.
A nonuniform mesh for the grid was used for both electromagnetic and thermal simulations with a minimum grid resolution of 1 mm at the source and at some tissues of human models. The maximum grid resolution at the environment (free space air) was 30 mm for both frequencies tested. This was accomplished by taking different max steps at 1000 and 1800 MHz due to the different wavelength λ (at 1000 MHz free space λ = 299.79 mm and at 1800 MHz free space λ = 166.67 mm). The total finite-difference time-domain (FDTD) calculation space varied from 46 5456 Mcells to 116 345 Mcells, depending on the simulation scenario and the mobile phone operating frequency.
Models and method
The utilized human models are numerically accurate anatomical models of a 7th months pregnant woman (Pregnant II) and a 5-year-old female child (Roberta) from the virtual population (VP), based on MRI [Reference Gosselin, Neufeld, Moser, Huber, Farcito, Gerber, Jedensjö, Hilber, Di Gennaro, Lloyd, Cherubini, Szczerba, Kainz and Kuster53].
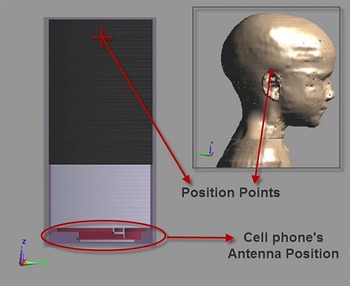
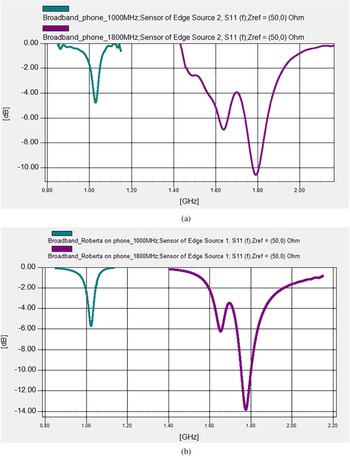
The numerical mobile phone model consists of five different materials including the casing, the screen, the metal, the antenna substrate and air and it was developed by the French ANR project Kidpocket [Reference Pinto, Ghanmi, Hadjem, Conil, Namur, Person and Wiart44]. The antenna is located at the bottom of the mobile phone and operates at 1000 MHz and at 1800 MHz. The positioning point is symmetrically chosen to the horizontal axis of the phone and 5 mm below the top edge of the phone (see Fig. 1). The S11 parameter at free space for both frequencies is shown at Figs 2(a) and 2(b). The mobile antenna is fed with a voltage source of 1 V amplitude, and its resistance is 50 Ohm. The reference power is set to 1 W at both 1000 and 1800 MHz operating frequencies for comparison reasons and for compliance with the international research and bibliography.
Numerical mobile phone model (105 mm × 28.5 mm × 10 mm) and positioning points on phone and child human model (not in real scale).

S11 of the used mobile phone operating at 1000 MHz and at 1800 MHz: (a) in free space, and (b) with Roberta as the phone user at parallel talk position (see Fig. 8).

According to the Greek Regulations for Buildings [54], buildings higher than 9 meters must be equipped with elevators that are able to serve people with disabilities and have a capacity for eight people. The minimum size of the recommended lift is 1.50 m × 1.70 m, and the corresponding dimensions of the cabin platform are 1.10 m × 1.40 m. An elevator cabin of dimensions 1.10 × 1.40 × 2.10 m3 and 10 mm thick walls was designed with an opening of 250 mm × 308 mm at the roof of the metallic enclosure (Fig. 3), based on the regulations for ventilation at elevators [55].
The human models at position 1: inside the elevator metal cabin with a roof opening.

The model of the pregnant woman (Pregnant II) is placed at the center of the metallic cabin and it is rotated around the vertical axis at eight different positions. The 5 years-old child Roberta is placed in the front part of the elevator cabin at a fixed distance, as shown in Fig. 4. The phone is placed on Roberta's right ear (left side at top view) at the side of the pregnant woman's abdomen. Further details on the positioning are provided below. As a result of the rotating Pregnant II model, the mobile phone is located at different positions in relation with the pregnant woman.
Human models of the child and the pregnant woman inside the elevator cabin at position 1 (see Fig. 7); the cell phone is placed at Roberta's right ear.

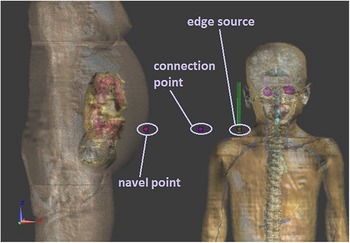
The two models were chosen so that the pregnant woman's abdomen is at the same height as the child's head. Specifically, the connection point between the Pregnant II and Roberta is fixed at the height of the mobile phone edge source, that coincides with the height of the pregnant woman's navel (Fig. 5).
Significant modeling points in the simulation environment at the same height at z axis: Pregnant woman navel, connection point between the human models, and cell phone edge source.

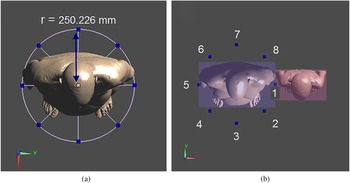
The pregnant woman model is gradually rotated 45⁰ degrees around the z axis in eight different positions. The center of the pregnant woman model and the center of the lateral left side of its bounding box at the navel high define a circle of radius r = 250.226 mm and give the eight different positions as can be shown in Fig. 6. The distance of the two models is set to the minimum distance they can acquire, when the models' bounding boxes at the narrow side are connected (Fig. 6(b))
(a) Pregnant woman position points, and (b) positions between human models with their bounding boxes shown.

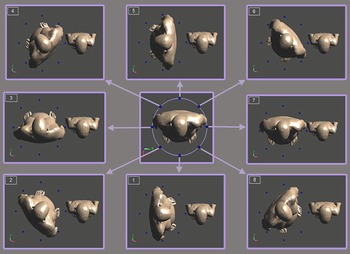
Figure 7 shows the positioning of the two models inside the elevator cabin and at free space, assuming a real case scenario with regular distances. The relevant positions of these models were chosen so that the phone is always located at the side of the pregnant woman, while the child, that is using the phone, is kept at a fixed location inside the cabin.
The eight positions of child human model (Roberta) and pregnant woman model (Pregnant II).

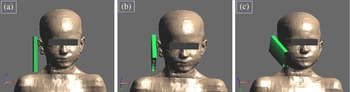
For all different configurations, the cell phone is placed in three different talk positions: (a) parallel (to z-axis), (b) tilt (with inclination to z-axis) and (c) cheek (with inclinations to z-axis and x-axis), according to the IEEE 1528 std and CENELECEN 62209 standards [45, 46] (see Fig. 8).
Positions of mobile phone in relation with Roberta: (a) parallel position, (b) tilt position, and (c) cheek position.

Results and discussion
The obtained results are presented in this section. For the two utilized frequencies, the numerical data are successively given for each model. Averaged SAR over 10 g tissue mass, whole-body SAR and temperature increase are included within all graphic representations at 1000 and 1800 MHz and for the eight different model positions inside the metallic elevator cabin and at free space. First, the simulation results of the child's exposure are presented, then the respective data for the pregnant woman are provided, and, finally, the evaluation of the fetus exposure follows. The input power is set to Pin = 1W for comparison reasons.
Mobile phone frequency at 1000 MHz
The SAR10 g results and the temperature variations at 1000 MHz for the child mobile phone user, Roberta, are graphically presented in Fig. 9, while the whole-body SAR is provided in Fig. 10.
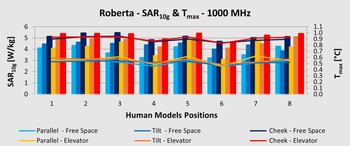
Graphic representation of SAR10 g [W/kg] and Tmax rise [°C] values in child model Roberta at 1000 MHz and for 1 W output power of the mobile phone. Eight human model positions (see Fig. 7) and three mobile phone positioning inside the elevator cabin and at free space are evaluated. SAR values are represented by the line distributions while the bars correspond to the temperature values.

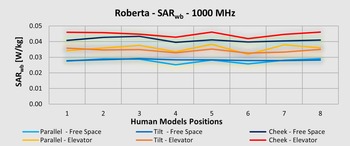
Graphic representation of SAR whole-body (SARwb) [W/kg] in child model Roberta at 1000 MHz and for 1 W output power of the mobile phone. Eight human model positions (see Fig. 7) and three mobile phone positioning inside the elevator cabin and at free space are evaluated.

Based on the numerical data, the highest values of SAR10 g are found at the cheek phone position for both free space and elevator configurations. The same is noticed for the induced temperature rise. The different relevant positions of the models produce small changes on the SAR10 g values as well as on T max values for the child phone user (Roberta). At free space, the maximum SAR10 g value is calculated for human position 3 and is 5.161 W/Kg while inside the elevator cabin maximum SAR10 g is 5.099 W/Kg for human position 2. The minimum SAR10 g values at free space and inside the elevator cabin are found for parallel phone position and are 2.497 W/Kg, at human position 4 and 2.477 W/Kg, at human position 6 respectively.
Even though in our calculation, the local (point) maximum SAR value at free space is at the parallel position, in general, parallel and tilt positions exhibit lower SAR10 g and T max values for both free space and inside the elevator cabin as compared to cheek phone position. Tilt and parallel phone positions have both similar results, with small differences that depend on the different human models' relevant positions. Notably, SAR10 g follows an increase of 5.79% from tilt to parallel phone position and 33.46% from parallel to cheek phone position for Roberta at 1000 MHz. The presence of the elevator seems to cause an increase in almost all the values for both SAR10 g and T max and for the three different phone positions. In general, maximum temperature variations for Roberta are similar to SAR10 g variations.
The whole-body SAR simulations conducted for Roberta present higher values compared to the corresponding ones in free space for the eight model relevant positions. In addition, the maximum SARwb is found at cheek phone position for both free space and elevator cabin cases and it is 0.043 W/Kg at human position 3 and 0.046 W/Kg at human position 8 respectively. The minimum SARwb value is calculated at parallel phone position for both free space and inside the elevator cabin and is 0.025 W/Kg at human position 4 and 0.032 W/Kg at human position 6 respectively. Cheek phone position at free space reveals higher values of SARwb than the tilt and parallel phone positions inside the elevator cabin. Still, free space tilt and parallel phone positions have lower values than the metallic cabin equivalents. Notably, the different relevant positions of human models create small differences at the SARwb values.
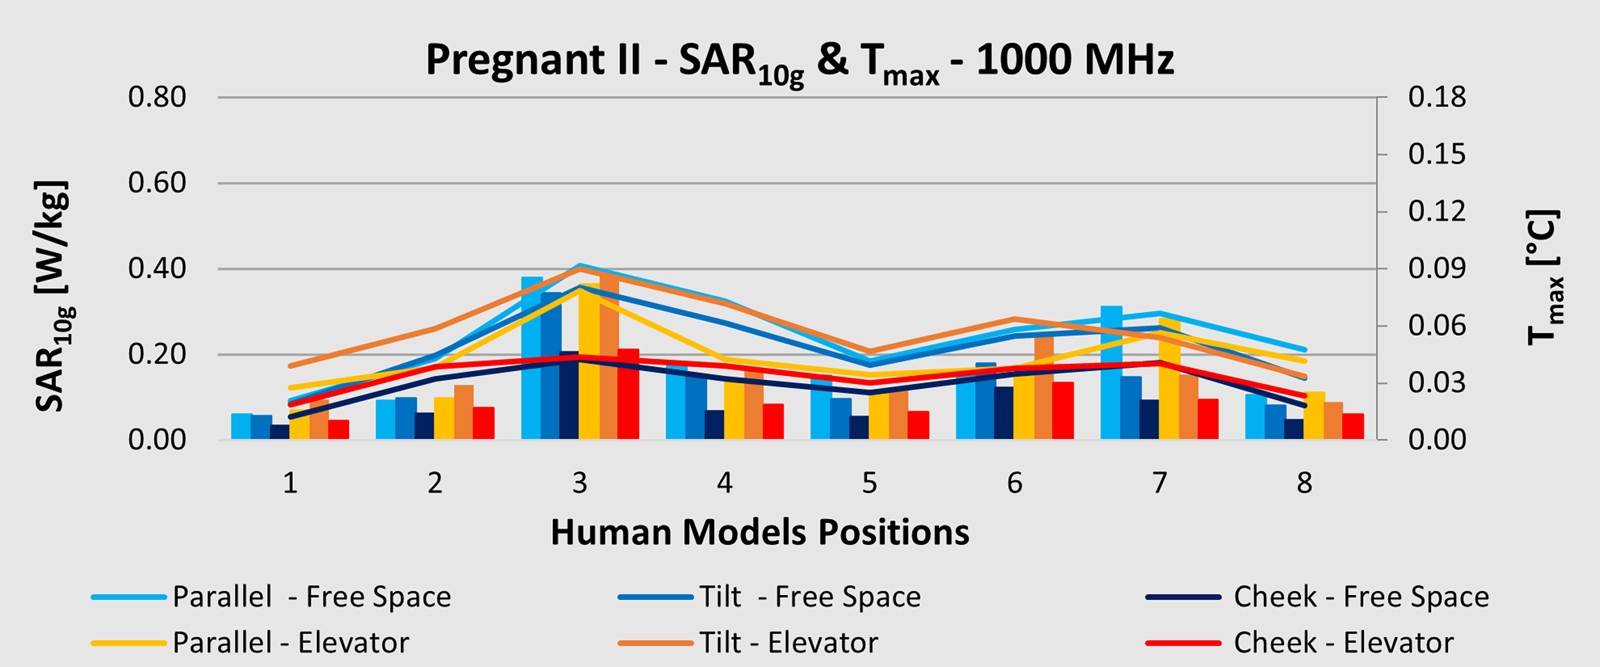
The SAR10 g and the T max of the 7th month pregnant woman (Pregnant II) at the 1000 MHz operating mobile phone frequency are presented in Fig. 11 while in Fig. 12 the whole-body SAR is provided.
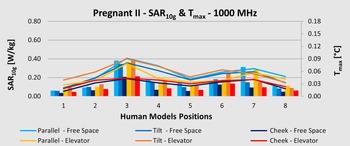
Graphic representation of SAR10 g [W/kg] and Tmax rise [°C] values in 7th month pregnant model (Pregnant II) at 1000 MHz and for 1 W output power of the mobile phone. Eight human model positions (see Fig. 7) and three mobile phone positioning inside the elevator cabin and at free space are evaluated. SAR values are represented by the line distributions while the bars correspond to the temperature values.
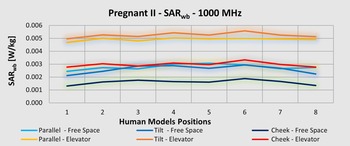
Graphic representation of SAR whole-body (SARwb) [W/kg] in 7th month pregnant model (Pregnant II) at 1000 MHz and for 1 W output power of the mobile phone. Eight human model positions (see Fig. 7) and three mobile phone positioning inside the elevator cabin and at free space are evaluated.

For the pregnant woman model, the SAR10 g as well as the temperature increase are affected both from the mobile phone position and the human models' relevant positions. T max does not seem to be greatly affected by the elevator's presence, in contrast to SAR10 g which seems to be more affected. The maximum values are found at parallel and tilt phone position at the human model position 3 (see Fig. 7). High values of SAR10 g and T max are also calculated for positions 6 and 7. The maximum SAR10 g value is 0.406 W/Kg at parallel phone position at free space and 0.400 W/Kg at tilt phone position inside the elevator cabin. The minimum SAR10 g value at 1000 MHz is 0.054 W/Kg at free space and 0.083 W/Kg inside the elevator cabin at human position 1 and cheek phone position for both cases. Maximum and minimum Tmax measurements are well correlated, and they follow SAR10 g findings.
The SARwb at 1000 MHz for Pregnant II exhibits the minimum and maximum values at the same talk phone positions as SAR10g; the highest value can be found at the tilt phone position in the elevator cabin configuration, while the lowest value can be found at the cheek free space configuration. The maximum SARwb value is 0.00307 W/Kg at human position 5 at parallel phone position at free space and 0.00557 W/Kg at human position 6 at tilt phone position inside the elevator cabin. The minimum SARwb value at 1000 MHz is 0.0131 W/Kg at human position 8 at cheek phone position at free space and 0.0277 W/Kg at human position 8 at cheek phone position inside the elevator cabin. All elevator values are higher than the corresponding ones of free space. It is worth noting that the SARwb values are not affected by the human models' relevant positions while the SAR10 g and Tmax values are greatly affected. SARwb variations are associated with phone talk position and the presence of the metallic cabin.
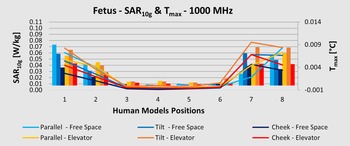
The SAR10 g along with the T max of the 7th month fetus for the operating mobile phone frequency of 1000 MHz are presented in Fig. 13, while in Fig. 14 the whole-fetus SAR is presented. For the fetus, the maximum SAR10 g value at 1000 MHz is 0.0683 W/Kg at human position 8 at parallel phone position at free space and 0.0774 W/Kg at human position 7 at tilt phone position inside the elevator cabin. The next lower SAR10 g value is at tilt position at model position 1 inside the elevator cabin and is decreased by 11.7% from the first one. The minimum SAR10 g value at 1000 MHz is 0.0001 W/Kg at four human positions at free space and 0.0029 W/Kg at human position 5 inside the elevator cabin. Minimum SAR10 g is found at cheek phone positions.
Graphic representation of SAR10 g [W/kg] and Tmax rise [°C] values in 7th month model fetus at 1000 MHz and for 1 W output power of the mobile phone. Eight human model positions (see Fig. 7) and three mobile phone positioning inside the elevator cabin and at free space are evaluated. SAR values are represented by the line distributions while the bars correspond to the temperature values.

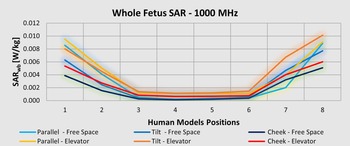
Graphic representation of SAR whole-body (SAR-wb) [W/kg] in 7th month model fetus at 1000 MHz and for 1 W output power of the mobile phone. Eight human model positions (see Fig. 7) and three mobile phone positioning inside the elevator cabin and at free space are evaluated.

The 7th month fetus' SAR10 g and T max distributions are different from those of the Pregnant woman. While the Pregnant model's maximum values are found at position 3 of the human models, the fetus' maximum values are found at positions 1, 7 and 8; while position 3 of the model has very low T max and SAR10 g values for the fetus. At the tilt phone potion inside the elevator cabin the maximum measurements are found for both fetus and Pregnant II.
The whole-fetus SAR at 1000 MHz present almost the same distribution as the SAR10 g and T max for all the relevant configurations of the performed simulations. On the other hand, for the Pregnant II model the distributions of SAR10 g are quite different from those of SARwb. The maximum SARwb value at 1000 MHz is 0.0088 W/Kg at free space and at human position 8, parallel phone position and 0.0101 W/Kg inside the elevator cabin at human position 8, tilt phone position. The minimum SARwb values, found at human position 4, cheek phone position, are 0.0001 W/Kg and 0.0006 W/Kg at free space and inside the elevator cabin respectively. Inside the elevator cabin there is an increase of 14.7% for SARwb maximum values. Inside the elevator, the SARwb values for all configurations are in general higher as compared to the corresponding free space ones.
Mobile phone frequency at 1800 MHz
The SAR10 g results and the temperature variations at 1800 MHz operating mobile frequency for the child phone user, Roberta, are graphically presented in Fig. 15, while in Fig. 16 the whole-body SAR is presented.
Graphic representation of SAR10 g [W/kg] and Tmax rise [°C] values in child model Roberta at 1800 MHz and for 1 W output power of the mobile phone. Eight human model positions (see Fig. 7) and three mobile phone positioning inside the elevator cabin and at free space are evaluated. SAR values are represented by the line distributions while the bars correspond to the temperature values.

Graphic representation of SAR whole-body (SARwb) [W/kg] in child model Roberta at 1800 MHz and for 1 W output power of the mobile phone. Eight human model positions (see Fig. 7) and three mobile phone positioning inside the elevator cabin and at free space are evaluated.

At 1800 MHz, the highest values of SAR10 g and T max for Roberta are found at the cheek and parallel phone positions respectively. Tilt phone position presents the lowest SAR10 g values as well as the lowest temperature rise. The T max values at the parallel position are slightly higher than the cheek phone positions at free space and inside the elevator cabin, as well. Further, SAR10 g values are higher at the cheek position inside the metallic elevator cabin. Almost all calculated results inside the elevator cabin are slightly higher than the corresponding ones in free space, especially the SAR10 g values.
The maximum SAR10 g value at 1800 MHz is 4.523 W/Kg at human position 6 and parallel phone position at free space and 4.529 W/Kg at human position 2 and cheek phone position inside the elevator cabin. The minimum SAR10 g values at 1800 MHz are 1.914 W/Kg at human position 3 and tilt phone position at free space and 1.972 W/Kg at human position 1 and tilt phone position inside the elevator cabin. SAR10 g increases 48.81% from tilt to parallel phone position and 0.71% from parallel to cheek phone position for Roberta at 1800 MHz. In contrary to 1000 MHz, the highest values of T max are found at the parallel phone position. Still, the maximum SAR10 g values are similarly found at the cheek phone position. All SAR10 g maximum values for 1000 MHz are found at ear skin at parallel and tilt position while at 1800 MHz the maximum values for these two phone positions are at ear cartilage. At cheek phone position for both 1000 and at 1800 MHz maximum values have been found at muscle tissue. The relevant positions of human models slightly affect the values of both T max and SAR10 g and for both operating frequencies.
While at 1000 MHz the whole-body SAR exhibits the maximum values at the cheek elevator phone position inside the metallic cabin, at 1800 MHz the SARwb has similar results for the parallel and cheek phone position at all models' relevant positions. The maximum SARwb value at 1800 MHz is 0.029 W/Kg at human position 3 at cheek phone position at free space and 0.030 W/Kg at human position 8 at cheek phone position inside the elevator cabin. The minimum SARwb value at 1800 MHz is 0.015 W/Kg at human position 4, parallel phone position at free space and 0.016 W/Kg at human position 6, parallel phone position inside the elevator cabin. Free space results present slightly lower values than the corresponding ones inside the metallic cabin. Tilt phone position at free space has the lowest SARwb values for Roberta. Generally, the SARwb for the child Roberta is higher at 1800 MHz than at 1000 MHz for all configurations.
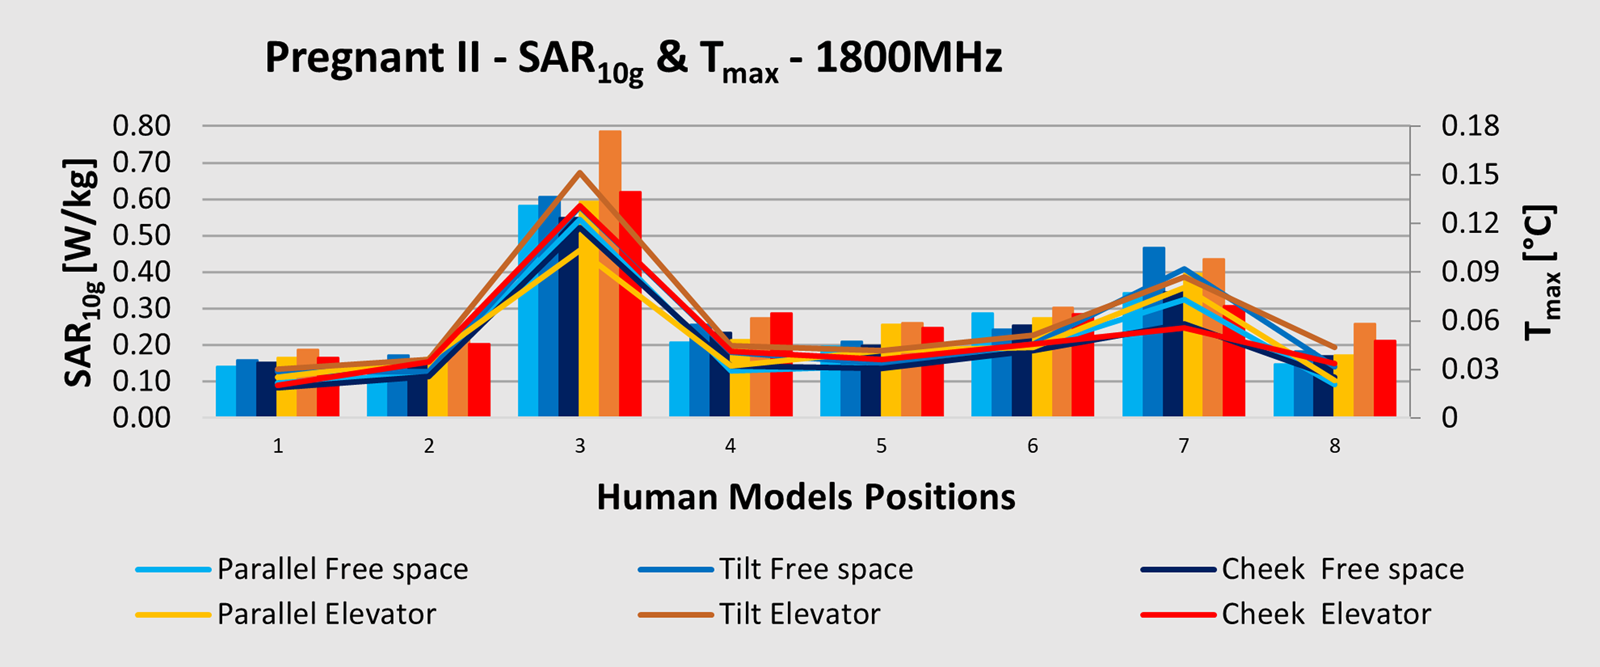
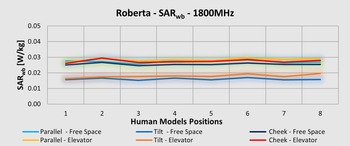
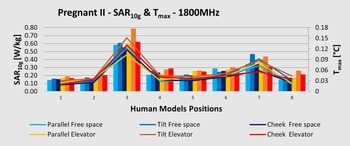
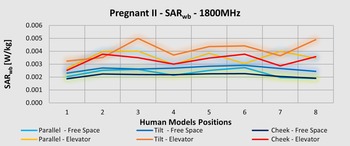
The SAR10 g and the T max of the 7th month pregnant woman (Pregnant II) at the 1800 MHz operating mobile phone frequency are presented in Fig. 17 while in Fig. 18 the whole-body SAR is provided. For the pregnant human model, the maximum SAR10 g and T max values are found, similarly as for 1000 MHz case, at the human models position 3. The maximum SAR10 g value is 0.606 W/Kg at free space and 0.786 W/Kg inside the elevator cabin, both at tilt phone position. At free space, the minimum SAR10 g value is 0.136 W/Kg at human position 2 at parallel phone position while inside the elevator cabin it is 0.165 W/Kg at human position 1 for the same phone position. Tilt phone position for all eight different configurations has higher values than the parallel and cheek positions. The SAR10 g and T max distributions at 1800 MHz inside the elevator cabin are similar to the corresponding ones at 1000 MHz. However, there is a notable increase in all the calculated values. They are almost doubled at 1800 MHz.
Graphic representation of SAR10 g [W/kg] and Tmax rise [°C] values in 7th month pregnant model (Pregnant II) at 1800 MHz and for 1 W output power of the mobile phone. Eight human model positions (see Fig. 7) and three mobile phone positioning inside the elevator cabin and at free space are evaluated. SAR values are represented by the line distributions while the bars correspond to the temperature values.
Graphic representation of SAR whole-body (SARwb) [W/kg] in 7th month pregnant model (Pregnant II) at 1800 MHz and for 1 W output power of the mobile phone. Eight human model positions (see Fig. 7) and three mobile phone positioning inside the elevator cabin and at free space are evaluated.

The graphic representation of the whole-body SAR for Pregnant woman at 1800 MHz is very similar with the one at 1000 MHz. The maximum values can be found at the tilt phone position inside the elevator cabin for all model configurations, while the minimum can be found at the cheek free space scenarios. The maximum SARwb value is 0.0291 W/Kg at free space and 0.0499 W/Kg, both at human position 3. The minimum SARwb value is 0.0186 and 0.00253 W/Kg at human position 1, cheek phone position at free space and inside the elevator cabin respectively.
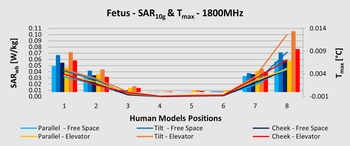
The SAR10 g along with the Tmax for the operating mobile phone frequency of 1800 MHz of the 7th month fetus are presented in Fig. 19, while in Fig. 20 the whole-fetus SAR is presented. Fetus' SAR10 g and T max distributions at 1800 MHz are similar with the ones at 1000 MHz for all the simulating scenarios, but with moderately higher values for both the quantities. The maximum SAR10 g value is 0.0714 and 0.1001 W/Kg at free space and inside the elevator cabin respectively. Both are calculated for human position 8 and tilt phone position. The next lower SAR10 g value is at tilt phone position 1 inside the elevator cabin. It is 28.6% lower. The minimum SAR10 g value is 0.00009 W/Kg at human position 5 at cheek phone position at free space and 0.00029 W/Kg at human position 4 at parallel phone position inside the elevator cabin.
Graphic representation of SAR-10 g [W/kg] and Tmax rise [°C] values in 7th month model fetus at 1800 MHz and for 1 W output power of the mobile phone. Eight human model positions (see Fig. 7) and three mobile phone positioning inside the elevator cabin and at free space are evaluated. SAR values are represented by the line distributions while the bars correspond to the temperature values.

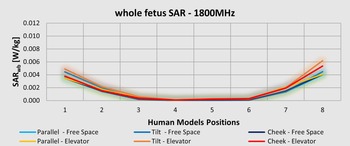
Graphic representation of SAR whole-body (SARwb) [W/kg] in 7th month model fetus at 1800 MHz and for 1 W output power of the mobile phone. Eight human model positions (see Fig. 7) and three mobile phone positioning inside the elevator cabin and at free space are evaluated.

In contrast, the whole-fetus SAR (Fig. 20) has lower values as compared to those at 1000 MHz. The maximum SARwb value at 1800 MHz is found at human position 8 and tilt phone position. It is 0.0045 W/Kg at free space and 0.0068 W/Kg inside the elevator cabin. The minimum SARwb at free space is 0.00001 W/Kg at human position 5 at cheek phone position. It is 0.00006 W/Kg at human position 6 at parallel phone position inside the elevator cabin. Even though the SARwb values are very low, still there is a significant increase of the maximum values by about 51.11% inside the metallic cabin.
Discussion
Based on the obtained numerical results of SAR10g, Roberta seems to be more affected by the mobile phone position than the human models' relevant positions for both frequencies. The phone positioning is the most important factor of variations for SAR10g, SARwb and T max of Roberta, and SARwb of Pregnant woman. The position of the phone is affecting in a smaller scale the values of SAR10g, T max of pregnant woman and fetus, and the whole fetus SAR. The positioning of the models is correlated with SAR10 g and Tmax of pregnant and fetus and whole fetus SAR, while it is not affecting Roberta's SAR values. Lastly, the metallic cabin elevator is generating larger values for all the human models, especially at SARwb levels.
At 1000 MHz, Roberta's SAR10 g results are higher than 1800 MHz at tilt and cheek position, but lower at the parallel phone position. This is probably due to the different affected tissues since electromagnetic waves penetrate deeper at 1000 MHz than at 1800 MHz. More specifically, at 1800 MHz, the maximum values of both SAR10 g and T max were found at the ear skin tissue, at parallel and tilt phone configurations, and at skin tissue at the cheek. At 1000 MHz, the maximum values of both SAR and T max were calculated at the ear cartilage tissue for parallel and tilt phone position, and at the muscle tissue for cheek position. Similarly, SARwb is affected both from the phone position and from the presence of the elevator cabin, especially at the frequency of 1000 MHz. In general, the SARwb of Roberta is higher inside the elevator cabin at 1000 MHz.
The temperature rise at Roberta model follows almost the same distribution as SAR10 g measurements, but it is not directly proportional to the SAR distribution [Reference Sabbah, Dib and Al-Nimr9, Reference Sabbah, Dib and Al-Nimr10]. At 1000 MHz the maximum temperature rise for the child model is at the cheek phone position at the 3rd model position and at free space. T max at 1000 MHz at parallel phone position has an increase of 11.46% inside the elevator cabin, while at tilt phone position the increase is about 9.97% and at cheek phone position the T max increase at the presence of metallic cabin is only 0.81% for Roberta model. Also, at 1800 MHz there is T max increase of 0.21% inside the elevator at the parallel position, 27.58% at tilt position and 22.03% at cheek phone position. The maximum value of T max, at 1800 MHz, is at parallel phone position at the 6th model position and free space, differentiating from SAR10 g maximum value which is found inside the elevator cabin at cheek phone position and at the 2nd relevant position of the human model. For all examined simulations, maximum temperature rise does not exceed 1°C.
For Pregnant woman most of the SAR10 g values are higher at 1800 MHz operating frequency, while for the fetus most of the values are higher at 1000 MHz. This is expected since at the lower frequency the electromagnetic waves penetrate deeper and reach the fetus more easily [Reference Takei, Nagaoka, Nishino, Saito, Watanabe and Takahashi24–Reference Chiaramello, Parazzini, Fiocchi, Ravazzani and Wiart28]. Maximum SAR and T max values on Pregnant II are all found at skin and muscle tissues, depending on both the positions of the models and the cell phone.
T max for Pregnant II model at 1000 MHz inside the metallic cabin has an increase of 3.6% at parallel phone position, 1.3% at tilt and 4.35% at the cheek. At 1800 MHz the T max values inside the elevator have an increase of 15.57% at parallel phone position, 1.53% at tilt and 10.69% at the cheek. SARwb for the pregnant woman even though it is generally low, inside the elevator cabin get a 100% increased at 1000 MHz and 66.67% at 1800 MHz which is a notable increase. In conclusion, the presence of the metallic elevator cabin has higher percentages at the maximum temperature values compared to free space.
Fetus maximum SAR and temperature rise values are found at positions where the mobile phone is in front of the pregnant abdomen and in the oblique direction of it, as in [Reference Fiocchi, Parazzini, Liorni, Samaras and Ravazzani30]. The maximum SAR and temperature rise values for the fetus are found at amniotic fluid due to the large electromagnetic conductivity and thermal capacity of the specific tissue. Tmax values for fetus even though they are small, they have increased values inside the metallic cabin, for both 1000 and 1800 MHz. Tmax values for the fetus at 1000 MHz increase inside the elevator about 28.57% at parallel phone position, 14.29% at tilt and 25% at cheek in comparison to free space. Notably, at 1800 MHz the increase of T max values inside the elevator is approximately 0.95% at parallel phone position, 30.77% at tilt and 22.02% at the cheek. The larger calculated T max is 0.18°C for pregnant and 0.014°C for the fetus. The difference is more profound than in [Reference Takei, Nagaoka, Nishino, Saito, Watanabe and Takahashi24] where Tmax in the fetus is less than half of the equivalent one in the pregnant woman. World Health Organization (WHO) [56], set the value of 1°C as the upper allowable limit. After EM experimentations on animals fetuses (mostly mice) higher temperature rise has been found to be causing health problems [56].
The values of maximum Pabs of the pregnant II are more than double of those of fetus, but the whole-body SAR and the whole fetus SAR are similar. The maximum Pabs for the pregnant woman is 0.335 W at tilt phone position, at the 6th relevant position of models and inside the elevator cabin while for fetus the maximum Pabs value is 0.0142 W at tilt phone position, at the 8th relevant position of the models and inside the metallic cabin. Therefore, it is believed that a dosimetry study of a pregnant woman, even if SAR10 g is low for both pregnant and the fetus, it is equally important to consider the whole-body SAR.
All values of SAR are far below the permitted limits for SAR10 g which is 2.0 W/kg and the temperature increase values are below the threshold temperature of 1°C for the time constant of 6 min (thermal time constant).
Conclusion
A detailed study of electromagnetic exposure and thermal safety, for a 5-year-old child and a 7th months pregnant woman, along with the fetus, inside a metallic elevator cabin is carried out. Numerically accurate anatomical human models and mobile phone model operating at two frequencies of 1000 and 1800 MHz are utilized. Totally 48 different configurations of the models are studied and analytical results of SAR10g, SARwb and T max are presented for all the human models and the fetus.
From the obtained results it appears that for a well-placed study, every quantity should be presented, and various configurations should be analyzed. Furthermore, the investigation in the elevator cabin, under different occupancy conditions and different operating mobile frequencies, should be explored.
 Ioanna Karatsi obtained a master's degree diploma in mechanical engineering from the Department of Mechanical and Aeronautical Engineering, School of Engineering, University of Patras, in 2010. She is a Ph.D. student in the Department of Electrical and Computer Engineering at the University of Patras. She has authored conference papers, participated, and has been a member of the organizing committee and supported international conferences. Her research interests are electromagnetic radiation and protection and ergonomics.
 Sofia Bakogianni obtained a diploma degree in electrical and computer engineering from the National Technical University of Athens, Athens, Greece, in 2007, an M.Sc. in microelectronics-optoelectronics from the University of Crete, Heraklion, Greece, in 2010, and a Ph.D. in electrical and computer science from the University of Patras, Patras, Greece, in 2018. She has authored or coauthored more than 15 journal and conference papers. Her current research interests include bioelectromagnetics, wearable/implantable antennas, and antenna theory. Dr. Bakogianni is a member of the Technical Chamber of Greece. She was a recipient of National Awards and Scholarships. She is a reviewer of the IEEE Transactions on Antennas and Propagation, IEEE Antennas and Wireless Propagation Letters, and of various international conferences.
 Stavros Koulouridis obtained a diploma degree in electrical and computer engineering and a Ph.D. in microwave engineering from National Technical University of Athens, Greece, in 1999 and 2003, respectively. From 2004 to 2008, he worked as a postdoctoral researcher with the Electroscience Laboratory, The Ohio State University, Columbus, OH, USA. He joined the Electrical and Computer Engineering Department, University of Patras, Greece, in March 2009. Since March 2020, he has been an associate professor and from October 2020, he has been the Director of the RF, Microwave and Mobile Communications Laboratory. His research interests include antenna and microwave devices design, development and fabrication of novel materials, microwave applications in medicine, and electromagnetic optimization techniques. He was the general chair of the International Workshop in Antennas Technology (IWAT) 2017. From 2010 he has been serving in the Technical Program Committee for IEEE Antennas and Propagation Society (AP-S) International Symposium. Since 2015, he has been serving in the Technical Program Committee of European Conference of Antennas and Propagation (EUCAP) as a meta-reviewer. He is a topical advisory panel member of Electronics and Editorial Board Member of Telecom, Open Access Journals from MDPI. He is an associate editor of IEEE AWPL and IEEE J-ERM.


 Open access