


In the Latin American region, many populations continue to undergo nutrition transitions, with increasing amounts of obesogenic foods – including ultra-processed foods (UPF) and beverages – observed in recent dietary patterns(Reference Baker, Machado and Santos1,2) . Overwhelming evidence partially attributes growing trends of obesity globally and in Latin American countries, including Ecuador, to increased consumption of UPF(Reference Baker, Machado and Santos1,Reference Freire, Silva-Jaramillo and Ramírez-Luzuriaga3–Reference Eaton5) . During the past decade, the coexistence of child under- and overnutrition has been noted in Ecuador(Reference Freire, Silva-Jaramillo and Ramírez-Luzuriaga3,Reference Hajri, Angamarca-Armijos and Caceres6) . A recent meta-analysis indicated that nearly 23 % of Ecuadorian children under the age of five had stunted growth, with rural and indigenous children bearing a disproportionate burden of this form of chronic undernutrition(Reference Hajri, Angamarca-Armijos and Caceres6). Obesity, on the other hand, was prevalent in 8·1 % of children in the same age category(Reference Hajri, Angamarca-Armijos and Caceres6), marginally exceeding prevalence estimates for child overweight in Latin America (7·5 %) and the world (5·6 %)(7). Recent discourse around the growing double burden of malnutrition continues to acknowledge that many risk factors for obesity and its related outcomes can also be linked to undernutrition outcomes such as stunted growth(Reference Keino, Plasqui and Ettyang8,Reference Guerrant, DeBoer and Moore9) . However, frequent UPF intake – a major risk factor for obesity – is rarely discussed in the framing of stunting and other outcomes on the other end of the malnutrition spectrum.
With an increasingly globalised and industrialised food system, sales and consumption of UPF have continued to rise over the past few decades while contributing immensely to population-level energy supplies worldwide(Reference Baker, Machado and Santos1,Reference Eaton5,Reference Monteiro, Moubarac and Cannon10) . UPF are broadly defined as ready-to-consume, pre-packaged foods that are formulated from a combination of substances extracted from whole foods (e.g. flour, hydrogenated oils and fats, animal derivatives, refined sugars, syrups and starches) and industrial additives or ingredients which are not typically used in culinary preparations within the home environment (e.g. artificial flavours, colours, emulsifiers and preservatives)(Reference Monteiro, Cannon and Levy11,Reference Monteiro, Cannon and Lawrence12) . UPF are often characterised by excesses in added sugars, fats and sodium, as well as low levels of dietary fibre. These classic attributes of UPF, along with the extensive industrial processing they undergo, decrease their healthfulness while enhancing their palatability and consequently driving excessive consumption(Reference Monteiro, Cannon and Levy11). Moreover, compared with unprocessed or minimally processed foods, UPF are often limiting in critical nutrients needed for proper growth and development(Reference Moubarac, Batal and Louzada13). Yet, worldwide, aggressive marketing and the ubiquitous availability of UPF continue to drive exponential growth in the consumption of these products, often to the detriment of the most vulnerable segments of the population, including children(Reference Waters and Freire14).
Dietary patterns that are UPF-dominant have been associated with a myriad of health ramifications across the lifespan(Reference Bujtor, Turner and Torres15,Reference Pagliai, Dinu and Madarena16) . The effects of excessive UPF consumption during childhood and adolescence, specifically, have also been documented widely in the literature. Comprehensive reviews have reported associations between increased UPF consumption and increased levels of inflammatory biomarkers in children and adolescents(Reference Bujtor, Turner and Torres15); increased adiposity in otherwise healthy children(Reference Costa, Del-Ponte and Assunção17); increased risk for obesity(Reference Askari, Heshmati and Shahinfar18) and poor cardiometabolic health(Reference Rocha, Milagres and Longo19). Additionally, evidence links excessive UPF intake with different outcomes that are also associated with stunting, including reduced intake of critical nutrients(Reference Hoffman, Leffa and Sangalli20–Reference Pries, Rehman and Filteau22) and the disruption of gut microbiome and integrity(Reference Agus, Denizot and Thévenot23,Reference Cuevas-Sierra, Milagro and Aranaz24) . These lines of evidence suggest plausible links between frequent UPF intake and stunted growth in children. There is, however, a paucity of research on UPF consumption during early childhood – particularly, prior to the pre-school phase – and its health implications.
Most of the evidence on UPF consumption has centred on its impact on several indicators of overnutrition, including adiposity, overweight and nutrition-related non-communicable diseases. However, emerging evidence highlights the potential ramifications of increased UPF intake for bone health and linear growth. A recent study in infant rodent models suggested that UPF consumption negatively affects bone ossification, and the researchers indicated that these findings may pose implications for stunted growth in children(Reference Zaretsky, Griess-Fishheimer and Carmi25). To our knowledge, this important evidence has not been translated to human populations. Thus, it is imperative that additional research fills this gap to determine whether UPF consumption can qualify as a determinant of growth faltering in young children.
This research has two primary aims and a secondary exploratory aim. First, the study examines the relationship between UPF consumption and child anthropometry (linear growth and weight status). Second, the study examines the relationship between child UPF consumption and bone age, which is a marker of bone maturity and also considered a proxy indicator for and a potential mediator of linear growth(Reference Zaretsky, Griess-Fishheimer and Carmi25,Reference Nicholas, Douglas and Waters26) . The secondary aim characterises the nutrition profiles of UPF available to children in the community. We hypothesised that increased UPF consumption will be associated with reduced linear growth, increased weight status and reduced bone age.
Methods
Design and study participants
The sample in this study comprises children enrolled in Lulun II, a cohort follow-up study to the Lulun project. The Lulun project was a randomised controlled trial testing the efficacy of incorporating an egg daily into child complementary diets on growth and nutrition outcomes. The trial was conducted in 2015 in the Cotopaxi Province of Ecuador. The cohort was drawn from mixed-indigenous, rural Andean communities dwelling in the following parishes in Cotopaxi: Guaytacama, Mulalo, Pastocalle, Tanicuchi and Toacaso. Details of the Lulun project are described elsewhere(Reference Cuevas-Sierra, Milagro and Aranaz24). In summary, children aged 6–9 months were randomised equally into a control or intervention group, where the family would receive a weekly ration of eggs and provide the index child with an egg daily for a 6-month intervention period. In addition to meeting the age requirement, eligible children had to be in good health with no evidence of egg allergies, fever, a congenital health condition, severe disability nor malnourishment. Children who were multi-birth infants (twins, triplets, etc.) were ineligible to participate in the study. Prior to study enrolment, mothers or primary caregivers went through an informed consent process and provided written consent agreeing to have their child participate in the study. At baseline, caregivers completed surveys on socio-demographic characteristics along with child diet, which was also reported at endline (6 months post-enrolment). Additionally, measures of child anthropometry and blood biomarkers of nutrition were obtained at baseline and endline.
Lulun II was a longitudinal follow-up to assess whether the egg intervention effect on child growth remained after 2 years(Reference Iannotti, Chapnick and Nicholas27). Mothers and caregivers were contacted and invited to participate in the study. The follow-up study enrolled 135 children out of the 163 children who were originally enrolled in the Lulun project, representing an 83 % retention from the baseline. The sample size for the original randomised controlled trial was based on power calculations estimating an effect size of 0·35 (difference between egg intervention and control groups) after a 6-month intervention period (α = 0·05 and 1 − β = 0·90)(Reference Iannotti, Lutter and Stewart28). Although this study was secondary to the original objective to examine whether the growth effect remained 2 years after the egg intervention, we assumed the same effect size and were therefore powered to detect an association at this level. For this analysis, we include children with complete data for all exposure, outcome and covariate variables.
Data collection for Lulun II was conducted 2 years after the end of the original randomised controlled trial, from June to August 2017. Further details on the protocols followed for the Lulun II study can be found elsewhere(Reference Iannotti, Lutter and Stewart28). This study was conducted according to the guidelines laid down in the Declaration of Helsinki, and all study procedures were approved by the ethics committees at Universidad San Francisco de Quito and Washington University in St. Louis. The Lulun and Lulun II projects are registered at https://clinicaltrials.gov under the respective identification numbers: NCT02446873 and NCT03902145.
Measures
Exposures
The primary exposure for this analysis is the frequency of UPF consumption during a 24-hour period. This variable was obtained from responses on child dietary intake from a validated 24-hour Food Frequency Questionnaire (FFQ), which is based on a comprehensive list of foods with their standardised serving/portion sizes identified from extensive formative research(Reference Gallegos Riofrío and Waters29), our previous studies in young children living in the Cotopaxi region using FFQ(Reference Cuevas-Sierra, Milagro and Aranaz24) and national studies examining child diets using 24-hour recalls in Ecuador(Reference Freire, Ramírez-Luzuriaga and Belmont30). Intake frequency was based on different food categories meeting the NOVA classification of UPF specifically adapted for Ecuador’s context(Reference Gallegos-Riofrío, Waters and Carrasco31,Reference Freire, Guerrón and Jiménez32) . The NOVA classification establishes four categories: unprocessed or minimally processed; culinary ingredients; processed and ultra-processed(Reference Monteiro, Cannon and Lawrence12). For this study, the FFQ included the following UPF categories: juices with added sugars; sodas; sugary drinks; sugary foods (including pre-packaged snacks such as chocolates, sweets, candies, pastries, cakes or biscuits) and salty snacks (pre-packaged savoury snacks). Intake frequencies for these categories were summed to obtain the total frequency of UPF consumed within a 24-hour period for each child. The newly computed variable was subsequently divided into tertile ranks based on the number of times that UPF were consumed during the past day. Tertiles were selected instead of quartiles and quintiles in view of the small sample size and need for sufficient number of cases in each category to run analyses. Tertile ranks were created using the n-tile function in R software (where n 3), which equally distributes cases in the sample according to the spread/range in frequency of UPF intake within the cohort (0–12 times). Although specific portion sizes are not captured here, ranking intake of specific food groups using FFQ is a recommended practice for dietary assessments(33). In fact, others have applied FFQ rankings of UPF intake, without specific portions captured, to estimate the risk of mortality in a large representative sample(Reference Kim, Hu and Rebholz34).
To explore potential differential effects from different categories of UPF on the outcomes of interest, we created three binary categorical variables capturing any consumption in the previous 24 hours: salty snacks; sugary foods and sugar-sweetened beverages (SSB) (encompassing juices with added sugars, sodas and sugary drinks).
Outcomes
For our primary aims, the outcomes examined were child anthropometry (height-for-age z-score (HAZ), weight-for-height z-score (WHZ)) and bone maturity (bone age z-score (BAZ)). For the anthropometric outcomes, measurements were conducted following the WHO’s guidelines on assessing child growth(35). Child heights were measured by two enumerators using a stadiometer (Seca GmbH & Co KG). Heights were measured twice, and if a difference of 5 mm was observed between the first and second measures, a third height measure was obtained. Weights were measured twice using a Seca Model 874 Electronic Digital Scale (Seca GmbH & Co KG), and a third measure was obtained if there was a difference of 0·05 kg between the first two measures.
Heights and weights were converted to HAZ and WHZ scores, respectively, according to the WHO Growth Standards(35). The WHZ is used instead of the weight-for-age z-score (WAZ) for this analysis because WHZ is the measure used to indicate overweight in children under the age of five(36). HAZ scores were also used to create a binary categorical variable indicating stunting status (HAZ < –2).
Bone age was measured using tablet-based ultrasound methods capturing images of the hand and wrist. Bone age represents bone maturation or advancement and is defined by the degree of ossification of the carpal bones and epiphyses of the metacarpals and phalanges of the fingers (online Supplementary Fig. 1)(Reference Nicholas, Douglas and Waters26,Reference Cavallo, Mohn and Chiarelli37,Reference Gaskin, Kahn and Bertozzi38) . During early childhood, ossification centres in the hand and wrist are used to evaluate skeletal maturity(Reference Cavallo, Mohn and Chiarelli37).The methodology for evaluating bone age in this study is detailed elsewhere(Reference Nicholas, Douglas and Waters26). In brief, a Lumify L12–4 broadband linear array transducer (Philips Healthcare) was connected to a Samsung S2 Galaxy tablet (Samsung Electronics) and used to obtain targeted images of different ossification centres located in the hand and wrist. Specific bones captured are detailed in online Supplementary Table 1. This table also details bones which are measured with adjustments made for child sex and age, according to the standards of Greulich and Pyle(Reference Greulich and Pyle39). These standards recognise sex-mediated differences in the maturation rate of these specific bones. Bone ages were evaluated twice at two distinct periods by a board-certified radiologist who was an investigator on the Lulun project, and intra-rater reliability was assessed. Bone ages were subsequently converted to z-scores (BAZ)(Reference Nicholas, Douglas and Waters26). For additional analyses, we computed a binary variable to indicate low bone age (BAZ < –2); this definition and cut-off have been applied previously in other paediatric studies using the standards of Greulich and Pyle to assess bone age(Reference Nicholas, Douglas and Waters26,Reference Gupta, Lustig and Kohn40,Reference Leonard, Thomson and Glasson41) .
Covariates
The first set of covariates included in the analyses were child characteristics – child age as a continuous variable and child sex as a binary categorical variable. Additional covariates selected for this analysis were identified as confounders which influence both the exposure and outcome. These include proxies of household/caregiver socio-economic status: caregiver employment status, involvement in food production and livestock ownership. All three socio-economic variables are binary categorical variables. We also account for the child’s group assignment from the original Lulun trial (egg intervention v. control) to control for any potential intervention effects that may have resulted from the trial. Nevertheless, in this cohort, we found that the intervention effects on growth that were observed at the end of the randomised controlled trial were no longer present 2 years later(Reference Iannotti, Lutter and Stewart28). Adjusting for energy intake is a common practice in nutritional epidemiology. For this analysis, we use dietary diversity as a proxy indicator, given evidence shows that it can adequately substitute measurements for predicted energy intake ratios among different populations(Reference Rose, Chotard and Oliveira42). Here, the variable describes whether or not the child met the recommended minimum dietary diversity (MDD), which is determined by the consumption of foods from at least four out of a possible seven food groups embedded in the WHO’s MDD indicator(43).
Statistical analysis
Descriptive statistics
First, descriptive statistics were used to profile the study population according to child demographic characteristics, morbidities, anthropometry and nutrition. Additionally, household socio-economic status is detailed at this stage of analysis. Analyses with the one-way ANOVA tested differences for continuous variables, and the Pearson’s χ 2 test assessed statistical differences for categorical variables. When contingency tables for categorical variables had cells with fewer than five cases, the Fisher’s exact test was used to evaluate those factors.
The second phase of the descriptive statistics involved analyses determining differences in any consumption of different food categories during the past 24 h, according to the tertile ranks of UPF consumption. Foods within these categories are within the NOVA classification of whole unprocessed or minimally processed foods, within Ecuador’s context(Reference Gallegos-Riofrío, Waters and Carrasco31,Reference Freire, Guerrón and Jiménez32) . Distinct food categories selected from the 24-h FFQ for these analyses were fish and other seafood; eggs; dairy products; legumes; cereals and grains; and fruits and vegetables. Assessments of the MDD score as well as the three specific groups of UPF are also included in this phase. The Kruskal–Wallis test assessed differences in MDD scores across the ranks of UPF consumption.
Regression modelling
Linear regression models estimated the respective relationships between the frequency of UPF consumption and the continuous outcomes of interest: HAZ, WHZ and BAZ. For all three continuous outcomes, covariates were introduced into the models drawing on the evidence base for their potential role as confounding factors. For example, socio-economic factors may influence both UPF consumption patterns and growth and bone maturation parameters. For HAZ, the model includes BAZ in addition to the covariates, given previous evidence within this same cohort that showed significant correlations between BAZ and HAZ(Reference Nicholas, Douglas and Waters26). The inclusion of this variable also recognises bone age as a potential mediator in the pathway for the hypothesised relationship between UPF consumption and linear growth(Reference Zaretsky, Griess-Fishheimer and Carmi25). Influential cases were identified in models after computing their Cook’s distances and visualising them on a Cook’s distance plot. New models were created without those influential cases. Subsequently, we compared effect sizes for the two models to determine whether the influential points affected the estimates. After modelling, we assessed the quality of each model using evaluations of multicollinearity represented by variation inflation factors, linearity between predicted values and residuals, homogeneity of variance and normality of residuals.
Logistic regression models were used for further analyses to estimate the odds of child stunting and low bone age in relation to UPF intake. We considered developing logistic regression models for a weight-related outcome (overweight – WHZ > 2); however, there were no children in the sample who met the overweight criteria. Logistic regression models were similar to those described for the linear models, with BAZ incorporated into the model for stunting status. The impact of influential cases on models was assessed using Cook’s distance values. Box–Tidwell transformations assessed the linearity assumption for continuous independent variables. Multicollinearity was also examined via variation inflation factor values.
Mediation analysis
Using the R package medflex (Reference Steen, Loeys and Moerkerke44), we tested BAZ as a mediating factor in the relationships between UPF consumption and the respective indicators for linear growth: HAZ and stunting status. We also control for confounders used in the regression modelling between UPF consumption and HAZ/stunting during this analysis. This analysis was warranted in recognition of emerging evidence on the relationship between UPF consumption and parameters of bone quality(Reference Zaretsky, Griess-Fishheimer and Carmi25) as well as previous findings from this study cohort correlating bone age with linear growth(Reference Nicholas, Douglas and Waters26). Using natural effects models, the analysis estimates the natural direct and indirect effects for each tertile of UPF intake, along with 95 % CI generated via robust bootstrapping procedures. Wald χ 2 tests through analysis of deviance was subsequently used for an overall assessment of the mediation model to determine whether the natural indirect effects for the individual tertiles of UPF consumption differ. Figure 1 provides a detailed visual of the hypothesised mediation analysis model.
Mediation model: total effect: effect of UPF consumption (tertile 2 (c 1) and tertile 3 (c 2)) on HAZ or stunting. Direct effect: effect of UPF consumption (tertile 2 (c' 1) and tertile 3 (c' 2)) on HAZ or stunting, after controlling for BAZ. Indirect effect: effect of UPF consumption (tertile 2 (a 1 × b) and tertile 3 (a 2 × b) on HAZ or stunting, mediated by BAZ. tertile 1: consumption of UPF 0–1 times per day (reference group, not shown in model); tertile 2: consumption of UPF 2–3 times per day; tertile 3: consumption of UPF 4–12 times per day. UPF, ultra-processed food; HAZ, height-for-age z-score; BAZ, bone age z-scores.

All analyses were conducted in R software (version 3.6.2).
Nutritional profiling of ultra-processed foods
Nutritional profiling methods are used to assess the degree of healthfulness of foods and can be used to draw conclusions on a food environment of interest. For this secondary aim, we obtained UPF products and wrappers specifically in and around a primary school located in the parish of Pastocalle, located in the Cotopaxi Province in the central Ecuadorian highlands. Although the items sampled were collected in a school setting, they may be representative of the kinds of UPF available to young children in the community of interest. We obtained a convenience sample of snack and candy wrappers littered on the ground and purchased candy and packaged snacks sold in the school cafeteria and immediately outside the school gate. Prior to analysis, we examined the sample of wrappers and packages to ensure that they met the criteria for UPF according to the NOVA classification. We approach the profiling of the sampled food items using two widely used models: respective Nutrient Profiling Models (NPM) established by the UK’s Department of Health(45) and the Pan American Health Organization (PAHO)(46). Henceforth, we refer to the respective models as UK NPM and PAHO NPM.
The PAHO NPM sets criteria for the concentration of sodium; energy intake from free sugars, saturated fat, trans fat; and the presence of artificial sweeteners in order to assess the content of UPF by identifying those containing excessive amounts of these components. For this analysis, we concentrated on the established limits for sodium, free sugars and saturated fats in order to be consistent with the specific nutrients or dietary indicators used in the UK NPM assessments. For each product, free sugars were determined by the value provided for one of the following: declared added sugars, declared total sugars when there are little to no ingredients with naturally occurring sugars or 50 % of declared total sugars for dairy products (e.g. sweetened milk or yogurt)(46). Excessive amounts of sodium, saturated fats and free sugars are defined by thresholds detailed in Table 1 (2).
Criteria for identifying ultra-processed foods containing excessive sodium, saturated fats, and free sugars, according to the Pan American Health Organization(2)

There has been some debate in the nutrition research community regarding approaches to evaluating UPF, where energy density, nutrition facts and levels of processing are often the only factors considered without accounting for other potential dimensions of nutritional value – for example, nutrient fortification and the inclusion of whole grains(Reference Derbyshire47–Reference Drewnowski, McKeown and Kissock49). The UK NPM allows consumers and researchers to view food items more holistically by evaluating UPF beyond specific nutrients, while accounting for ingredients and factors such as whole fruits, nuts, vegetables, fibre and protein content which could contribute to the healthfulness of UPF. Although it was originally designed for the British context, the model has been used for UPF and food environment evaluations in other places in the world(Reference Elliott and Truman50), including Latin America(Reference Chacon, Letona and Barnoya51,Reference Soo, Letona and Chacon52) .
Full details on the methodology can be found elsewhere(45). Briefly, the UK NPM scores foods or drinks in three stages. The first stage scores the food item accounting for total energy in kJ, saturated fats in g, sugar in g and Na in mg per 100 g of each food item. The second stage results in a separate score based on the percentage of whole fruits, nuts and vegetables (as a single category); fibre in g and protein in g per 100 g of each food item. In this second stage, protein can only be accounted for if a food item that scores less than 11 points at the first stage or has 5 or more points for the percentage of fruit, vegetables and nuts. In the third stage, scores from the second stage are subtracted from the first to obtain a final UK NPM score. Beverages scoring 1 point or more are categorised as less healthy, whereas foods are less healthy if they have a score of 4 or greater.
For the present study, a survey with formulas built into a branching logic was developed within the Research Electronic Data Capture (REDCap) software(Reference Harris, Taylor and Minor53) to calculate the UK NPM scores for each food item. Using the labels on each package or wrapper, for each food item in our sample, we recorded the data per 100 g for all the nutrition information required for both NPM as previously described. In cases where nutrition information was not available, we searched the USDA Food Composition Database for information on items either produced by the same company or generics. For instance, for a marshmallow snack with incomplete nutrition information, we source the data for a generic marshmallow product in the USDA Food Composition Database. For the PAHO NPM, we calculated the energy obtained from free sugars and saturated fats following PAHO criteria described in Table 1. These calculations, along with data on sodium content, were used to determine whether each food item contained excessive free sugars, saturated fats or sodium according to the energy-related criteria set by PAHO (Table 1).
Results
Sample characteristics
For the study’s primary aims, the analysis accounts for a sample of 125 children from Lulun II with complete data. The median frequency of UPF consumption was three times per day (interquartile range: 1–5 times per day), and 92·8 % of the children (n 116) consumed some form of UPF the previous day. Univariate analyses detected a statistically non-significant relationship between stunting and frequency of UPF consumption, although the prevalence of stunted growth for children in the highest tertile of UPF consumption was comparatively higher (61·0 %) than among children in the lowest tertile (47·6 %) (P = 0·17). Differences in mean HAZ scores were also statistically non-significant. Univariate analyses showed a non-significant association between weight parameters and frequency of UPF consumption (P = 0·79). However, WHZ scores were lowest for children in the highest tertile of UPF consumption (0·45 [sd 0·73]). Mean BAZ scores were significantly different across the tertiles of UPF consumption, with children in the highest tertile having higher BAZ scores on average (–0·94 [sd 1·27]) compared with children in the other tertiles (P = 0·02).
Statistically non-significant differences were observed across the tertiles of UPF consumption for all other sample characteristics explored in the univariate analyses, as detailed in Table 2. Generally, the occurrence of co-morbidities – fever and diarrhoea – from 2-week morbidity recalls, as reported by caregivers, was highest for children in the highest tertile of UPF consumption.
Child characteristics by frequency of UPF consumption (times per day) n 125
(Mean values and standard deviations)

UPF, ultra-processed food; HAZ, height-for-age z-score; WHZ, weight-for-height z-score; BAZ, bone age z-score.
*P values indicate statistical significance (P < 0·05).
† One-way ANOVA.
‡ Pearson’s χ 2 test.
§ Fisher’s exact test.
Consumption patterns
Table 3 details the consumption patterns in the cohort. Besides the consumption of cereals and grains, differences in the consumption patterns for whole or minimally processed food groups were not statistically significant across the tertile ranks. Nearly all the children sampled consumed cereals and grains during the previous day (96·8 %), and all children in the second and third tertiles consumed cereals and grains (100 %). In addition, nearly all the children in the sample consumed some fruit and vegetable, regardless of the tertile rank of UPF consumption. Assessments of the MDD scores showed high dietary diversity across each tertile of UPF consumption, with most children meeting the MDD requirement of consuming foods from four or more groups.
Consumption patterns by frequency of UPF consumption (times per day) n 125
(Mean values and standard deviations)

UPF, ultra-processed food; MDD, minimum dietary diversity.
*P values indicate statistical significance (P < 0·05).
† Kruskal–Wallis test.
‡ Pearson’s χ 2 test.
§ Fisher’s exact test.
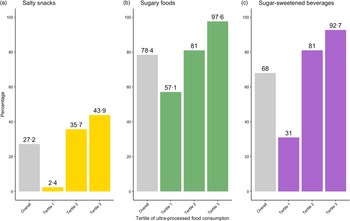
Analyses of differences for the three categories of UPF consumption showed statistical significance across all tertiles of UPF intake (P < 0·001), with more than 90 % of children in the highest tertile consuming some form of SSB or sugary food/snack the previous day. Figure 2 shows consumption frequencies observed for the overall sample and for each tertile within each category of UPF. SSB were consumed by 92·7 % of children in the highest tertile, compared with 31·0 % of children in the lowest tertile. Sugary food/snack consumption was observed in almost all children in the highest tertile (97·6 %), compared with more than half of children in the lowest tertile (57·6 %). The salty snack category was the least consumed among all the three UPF groups.
Consumption prevalence for ultra-processed food groups: bars in grey on the farthest left of each ultra-processed food category (a) salty snacks; (b) sugary foods; (c) sugar-sweetened beverages represent the proportion of children within the cohort studied (Overall) (n 125) who consumed food from a given group the day prior. The three additional bars represent the proportion of children within each tertile (Tertile 1 (n 42); Tertile 2 (n 42), Tertile 3 (n 41)) who consumed food from a given group the day prior.

Associations between ultra-processed food consumption and growth parameters
Linear growth and stunting
After controlling for confounding variables, dietary diversity as a proxy for energy intake and child bone age, the regression model for HAZ showed a statistically significant negative magnitude of association between the frequency of UPF consumption and HAZ for the highest tertile of UPF consumption: on average, children in the highest tertile of UPF consumption had HAZ scores that were 0·43 units lower compared with children in the lowest tertile (β = –0·43 [se 0·18]; P = 0·02) (Table 4). Statistically non-significant associations were detected for the relationship between any consumption within the individual UPF groups and HAZ; however, all the associations were negative (Table 5).
Association between the frequency of UPF consumption and growth indicators – HAZ, WHZ and BAZ
(β-coefficients and standard errors)

UPF, ultra-processed food; HAZ, height-for-age z-score; WHZ, weight-for-height z-score; BAZ, bone age z-score.
* P values indicate statistical significance for β-coefficients (P < 0·05).
† Model is adjusted for child BAZ, child sex; child age; parental/caregiver socio-economic characteristics: employment status, involvement in food production, livestock ownership; meeting minimum dietary diversity and group assignment from the Lulun project.
‡ Model is adjusted for child sex; child age; parental/caregiver socio-economic characteristics: employment status, involvement in food production, livestock ownership; meeting minimum dietary diversity and group assignment from the Lulun project.
Association between consumption of specific UPF groups and growth indicators – HAZ, WHZ and BAZ
(β-coefficients and standard errors)
UPF, ultra-processed food; HAZ, height-for-age z-score; WHZ, weight-for-height z-score; BAZ, bone age z-score.
* P values indicate statistical significance for β-coefficients (P < 0·05).
† Model is adjusted for child BAZ, child sex; child age; parental/caregiver socio-economic characteristics: employment status, involvement in food production, livestock ownership; meeting minimum dietary diversity and group assignment from the Lulun project.
‡ Model is adjusted for child sex; child age; parental/caregiver socio-economic characteristics: employment status, involvement in food production, livestock ownership; meeting minimum dietary diversity and group assignment from the Lulun project.
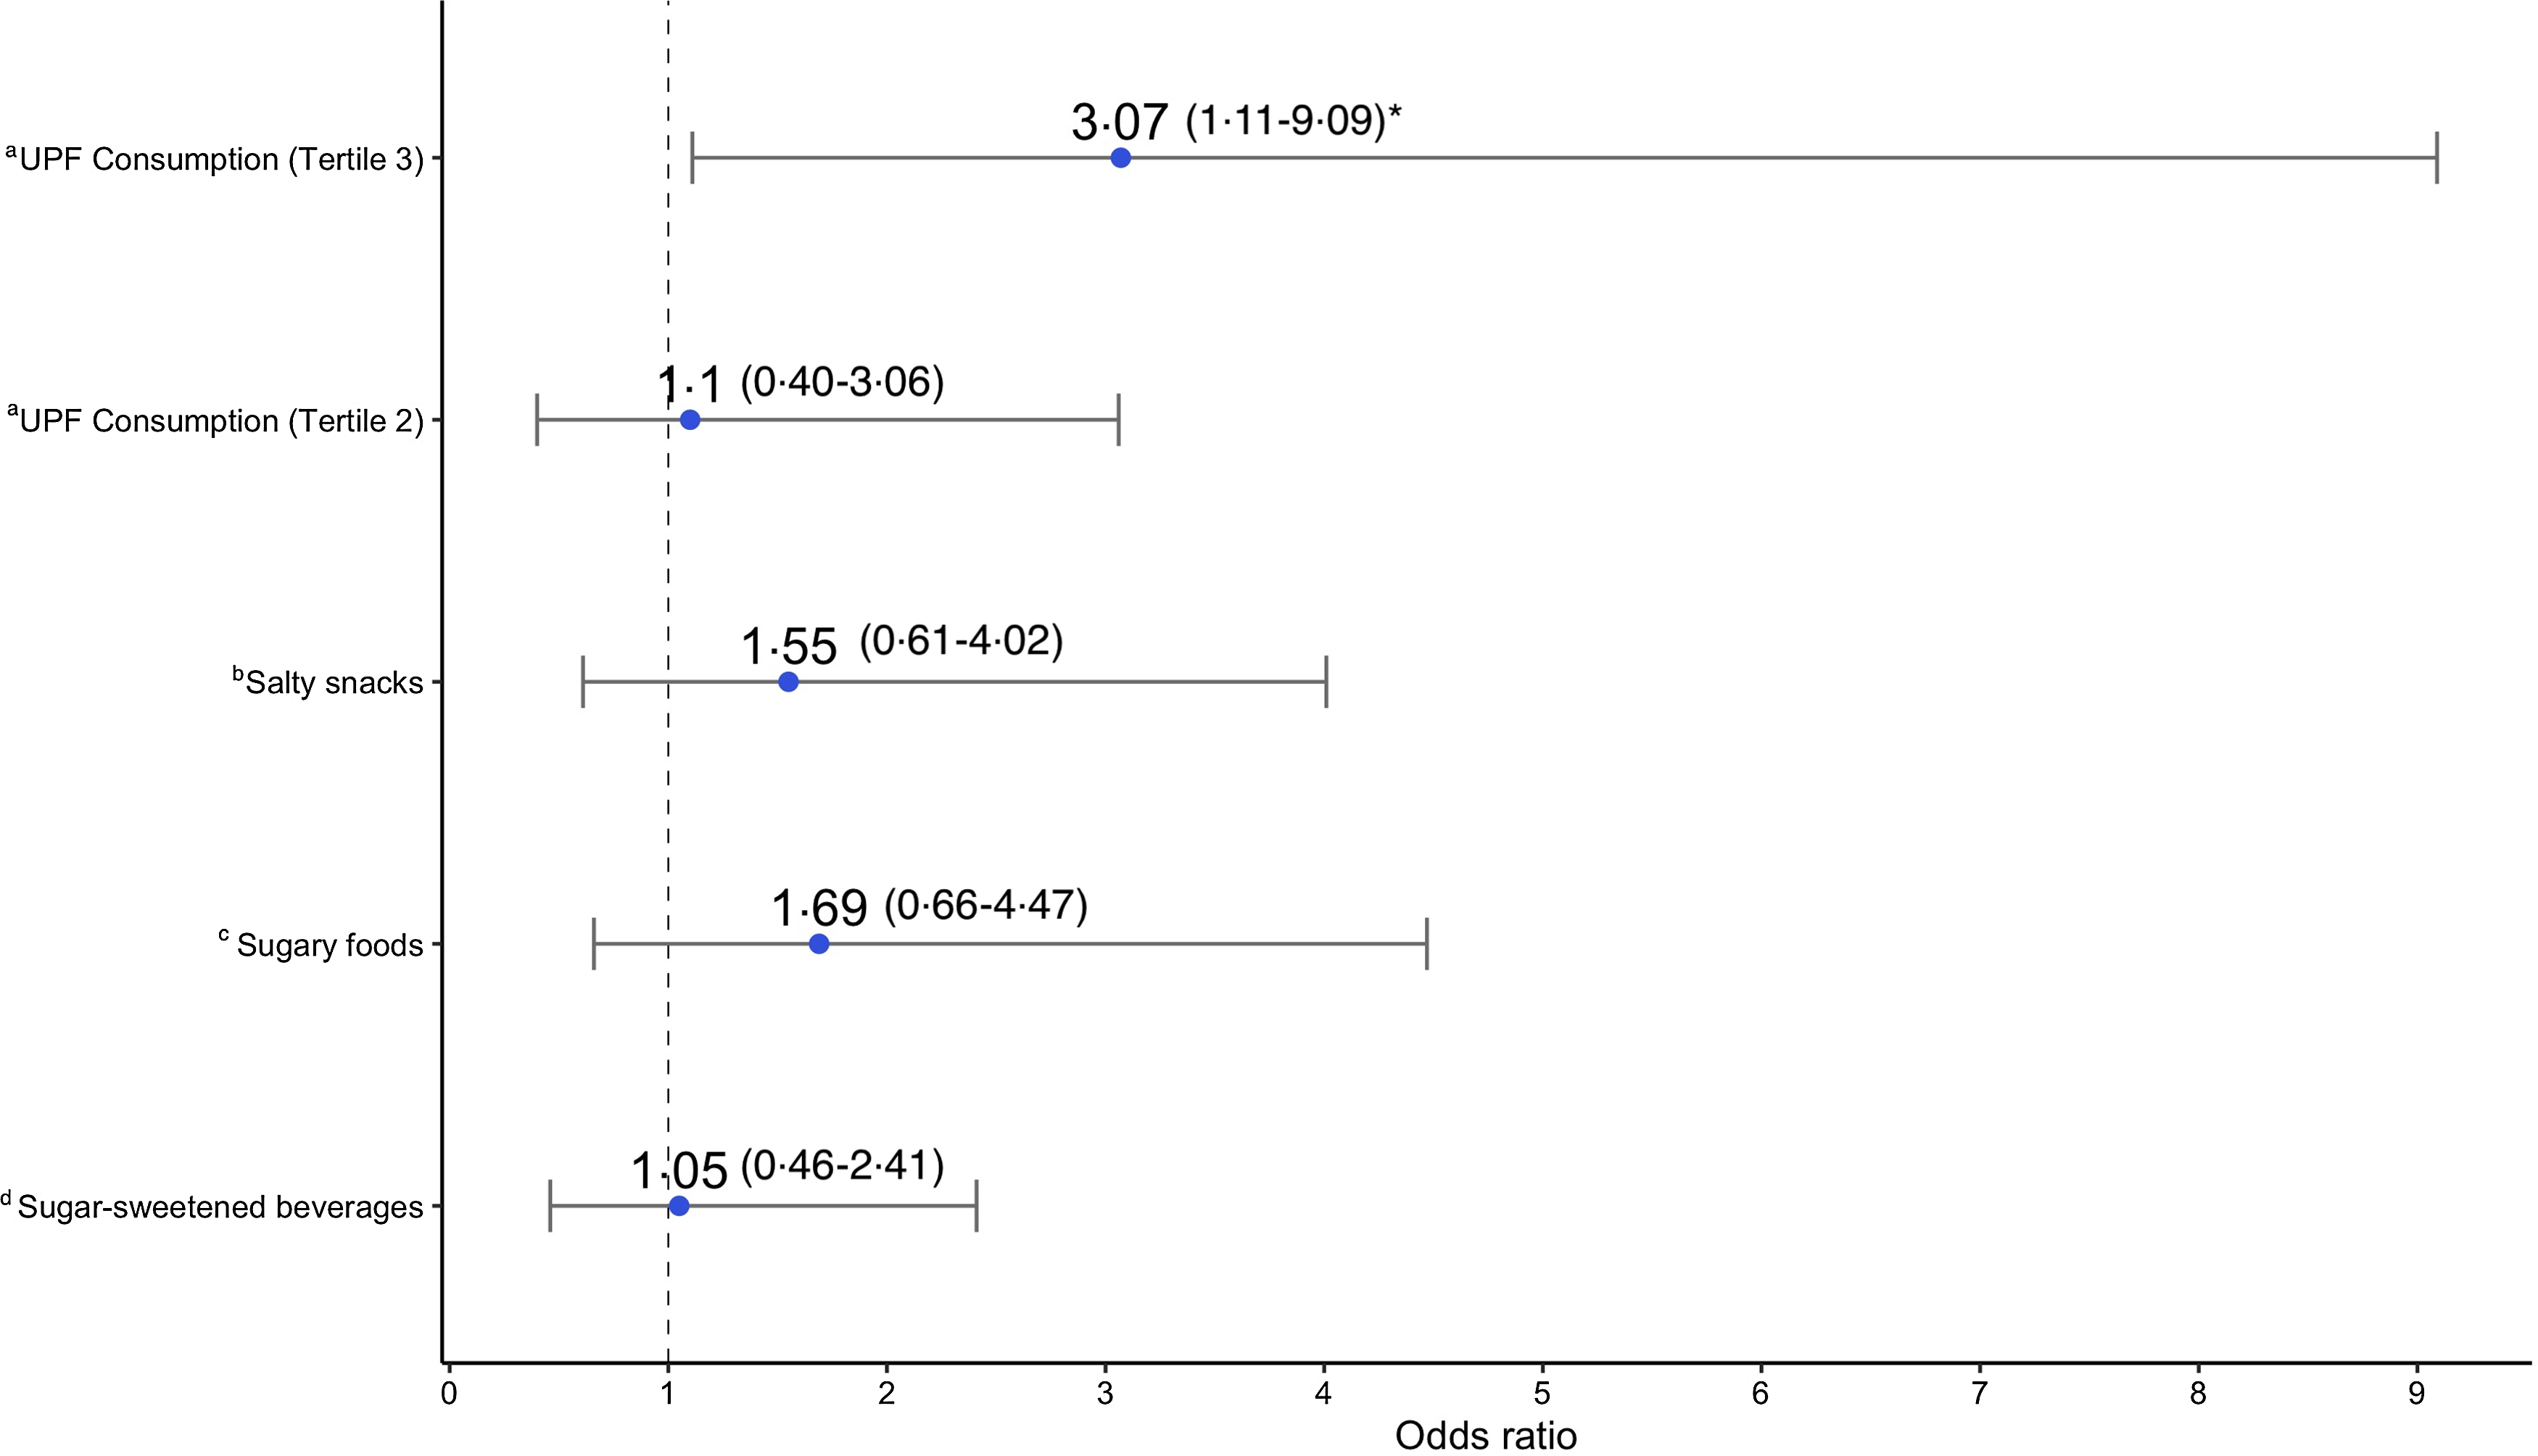
Adjusted logistic regression models for stunting detected a significant relationship with UPF consumption frequency for the highest tertile (Fig. 3). Here, children in the highest tertile had nearly three times higher odds of stunting compared with children in the lowest tertile (OR: 3·07, 95 % CI 1·11, 9·09). Respective models for the three individual categories of UPF showed non-significant relationships with stunting, although stunting odds were generally higher for children who had consumed any SSB, sugary snacks or savoury snack – ranging from 5 % to 69 % higher odds (Fig. 3).
Association between ultra-processed food consumption and stunting (HAZ < –2): adjusted OR and 95 % CI showing the association between different UPF exposures and stunting (HAZ < –2), determined by logistic regression models. Each model was adjusted for child BAZ, child sex; child age; parental/caregiver socio-economic characteristics: employment status, involvement in food production, livestock ownership; meeting minimum dietary diversity, and group assignment from the Lulun project. aModel where frequency of UPF consumption according to tertiles is the primary exposure; reference group – tertile 1(consumption 0–1 time a day). bModel where any salty snack consumption is the primary exposure; reference group – no salty snack consumption. cModel where any sugary food consumption is the primary exposure; reference group – no sugary food consumption. dModel where any sugar-sweetened beverage consumption is the primary exposure; reference group – no sugar-sweetened beverage consumption. *indicates statistical significance (P < 0·05). HAZ, height-for-age z-score; UPF, ultra-processed food; BAZ, bone age z-score.
Weight status
Apart from salty snacks, all other UPF exposures showed statistically non-significant relationships with the weight outcome (WHZ). Consumption of salty snacks correlated negatively with child WHZ (β = –0·30 [se 0·14]; P = 0·04). Negative, but non-significant, magnitudes of association were detected for the highest tertile of UPF consumption (β = –0·09 [se 0·16]; P = 0·56) and sugary snacks/foods (β = –0·26 [se 0·16]; P = 0·10) (Tables 4 and 5).
Bone age
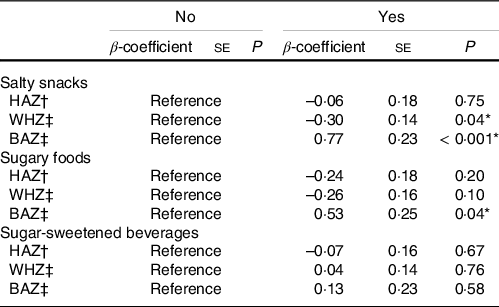
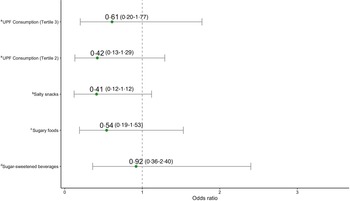
The adjusted model for BAZ showed a statistically significant and positive association between frequency of UPF consumption and BAZ for children in the highest tertile (Table 4). Children in the highest tertile of UPF consumption had BAZ scores that were 0·58 units higher on average, relative to children in the lowest tertile (β = 0·58 [se 0·25]; P = 0·03). Respective models for the three categories of UPF were all positively associated with BAZ. Statistical significance was however detected only for consumption of salty snacks (β = 0·77 [se 0·23]; P < 0·001) and sugary foods/snacks (β = 0·53 [se 0·25]; P = 0·04) (Table 5). Adjusted regression models estimating the odds of low bone age were all statistically non-significant but showed negative magnitudes of association (Fig. 4).
Association between ultra-processed food consumption and low bone age (BAZ < –2): adjusted OR and 95 % CI showing the association between different UPF exposures and low bone age (BAZ < –2), determined by logistic regression models. Each model was adjusted for child sex; child age; parental/caregiver socio-economic characteristics: employment status, involvement in food production, livestock ownership; meeting minimum dietary diversity, and group assignment from the Lulun project. aModel where frequency of UPF consumption according to tertiles is the primary exposure; reference group – tertile 1(consumption 0–1 time a day). bModel where any salty snack consumption is the primary exposure; reference group – no salty snack consumption. cModel where any sugary food consumption is the primary exposure; reference group – no sugary food consumption. dModel where any sugar-sweetened beverage consumption is the primary exposure; reference group – no sugar-sweetened beverage consumption. BAZ, bone age z-score; UPF, ultra-processed food.

Bone age-mediated relationships between ultra-processed food consumption and indicators of linear growth
Indirect effects were not statistically significant for both HAZ scores and stunting, demonstrating limited evidence for bone age as a mediator (online Supplementary Table 2). However, a statistically significant relative direct effect was observed between the highest tertile of UPF consumption and stunting (effect size = 1·07, bootstrap 95 % CI 0·06, 2·07) (online Supplementary Table 2). This significant direct effect parallels findings reported for the adjusted odds of stunting for the highest UPF consumption tertile.
Nutrition profiling
For the study’s secondary aim, we assessed twenty-eight items with adequate data for nutrition profiling analyses. There were no SSB in the sample, while 78·6 % (n 22) of the sample consisted of sugary snacks, and the remaining were salty/savoury snacks. The mean UK NPM score for the sample was 14·89 (sd 7·58), indicating that UPF found in the school environment were unhealthy; scores of 4 and greater are considered ‘less healthy’(45). The mean UK NPM score for the salty snacks was 16·59 (sd 7·50), whereas sugary snacks scored 14·45 (sd 7·72) on average. Only one food item was considered ‘healthy’ according to the NPM scoring. However, this item was entirely composed of industrially formulated ingredients (product ID 12 in Table 6).
List of UPF sampled and summary of individual nutrition profiles*

UPF, ultra-processed food, NPM, Nutrient Profiling Models.
* All quantities are per 100 g of product sample.
† Indicates sugary/sweetened snack.
Following criteria described for the PAHO NPM in Table 1, we found that 71·4 % of the UPF sampled had excessive free sugars, 21·4 % had excessive Na and 35·7 % had excessive saturated fats. Table 6 lists the food items sampled along with their individual UK NPM scores as well as their characteristics according to the PAHO NPM criteria. More detailed nutrition data used in the profiling assessment can be found in online Supplementary Table 3.
Discussion
This study assessed UPF consumption in relation to child anthropometry and bone maturation in children who participated in the Lulun II study. We also assessed the nutrition profiles of UPF found in and around a primary school, thereby allowing us to characterise specific UPF in the community that may influence the child outcomes studied. Although the Lulun project demonstrated significant effects of an egg intervention on preventing stunted growth(Reference Cuevas-Sierra, Milagro and Aranaz24), findings from the Lulun II follow-up indicated that this intervention effect was no longer present 2 years later(Reference Iannotti, Lutter and Stewart28). Further research was therefore needed to understand determinants of growth faltering – among the myriad of factors associated with stunting – in this cohort. Here, we assessed UPF consumption as one potential driving factor for stunted growth. Findings from this study suggest that increased consumption of UPF may be associated with increased bone maturation, while increasing the risk of stunted growth or chronic malnutrition in young children. The latter outcome is particularly compelling, because stunted infants or young children generally cannot recover and may bear the risks of long-term ramifications on health and productivity throughout the life course(Reference Stewart, Iannotti and Dewey54). Our findings also showed limited evidence for UPF impacts on weight status and for bone maturation as a mediator in the relationship between UPF intake and the indicators of linear growth. Nutrition profiling analyses provided evidence for a potentially unhealthy food environment in a school setting, based on the kinds of products consumed by primary schoolchildren.
Our findings suggest that frequent UPF intake is negatively associated with linear growth. There is limited evidence directly associating UPF consumption with stunted growth. One study by Pries and colleagues(Reference Pries, Rehman and Filteau22) with a cohort from Nepal found a significant relationship between higher total energy intake from complementary ultra-processed snack foods and lower length-for-age z-scores. The researchers also found associations with increased UPF intake and dietary inadequacy, which also partially mediated the relationship between high UPF intake and low length-for-age z-scores(Reference Pries, Rehman and Filteau22). Emerging literature supports the evidence from Nepal suggesting nutrient inadequacy as a potential pathway explaining the relationship between UPF intake and decreased linear growth.
First, diets characterised by high UPF consumption may signify that UPF are displacing nutrient-dense unprocessed or minimally processed foods in the traditional Ecuadorian diet(Reference Freire, Silva-Jaramillo and Ramírez-Luzuriaga3,Reference Melby, Orozco and Averett55,Reference Melby, Orozco and Ochoa56) . A population-based survey of Canadians aged 2 years and above found that UPF consumed by the population, compared with unprocessed or minimally processed foods in the diet, had lower mean nutrient concentrations for proteins, fibre, minerals (Zn, Fe, Mg, Ca, P and K) and vitamins (A, C, D, B12 and other critical B vitamins)(Reference Moubarac, Batal and Louzada13). Similarly, in a representative longitudinal analysis of US adults, individuals in the highest quartile of UPF consumption had significantly lower scores for the Nutrient-Rich Foods Index and the Healthy Eating Index(Reference Kim, Hu and Rebholz34), two indicators for nutritional quality in one’s diet. During early childhood, poor dietary quality is associated with sub-optimal growth outcomes(Reference Krasevec, An and Kumapley57).
Displacement of nutrient-dense foods in the diet may affect the intake of nutrients for which deficiencies are linked to stunting pathogenesis. In a representative sample of Chilean pre-schoolers, researchers found that children with UPF-dominant diets had significantly reduced intake of proteins, polyunsaturated fatty acids (PUFA), Zinc, folate, fibre and vitamin A(Reference Araya, Corvalán and Cediel21). Similarly, a study of pre-school children in Brazil found negative associations between high UPF consumption and intake of key nutrients, including proteins and fibre, as well as consumption of unprocessed or minimally processed foods(Reference Hoffman, Leffa and Sangalli20). Zinc and folate are micronutrients that are essential for biological processes that support linear growth, including cellular metabolism and growth as well as protein synthesis(Reference Hambidge58,Reference Matoth, Zehavi and Topper59) . Inadequacies in vitamin A are also known to correlate with impaired growth, given that deficiencies may limit cellular proliferation(Reference Zile, Bunge and DeLuca60). Furthermore, studies have shown that children with lower HAZ scores tend to have lower levels of PUFA and amino acids(Reference Semba, Trehan and Li61), critical macronutrients that can be implicated by increased UPF consumption. Recognising the importance of these key nutrients for linear growth, the consistent findings of reduced intake among young children in Latin America could be extrapolated to our findings. The results in Table 3 do not suggest displacement of unprocessed food groups by UPF. Moreover, MDD scores for children in the highest tertile of UPF consumption were high enough to suggest adequate intakes of trace minerals or other nutrients required in small quantities(Reference Arimond, Wiesmann and Becquey62). However, these results, as well as the MDD scores, may not necessarily and adequately reflect dietary quality(Reference Jayawardena, Byrne and Soares63,Reference de Oliveira Otto, Anderson and Dearborn64) nor the consumption of other nutrients in sufficient amounts to support optimal linear growth.
Additional pathways that may shed some perspective on the observations for linear growth pertain to the impacts of UPF as a pro-inflammatory food class that can disrupt gut microbiota and intestinal integrity. During a child’s early years, a healthy gut microbiome is key for the prevention of local and systemic intestinal inflammation(Reference Robertson, Manges and Finlay65). Intestinal inflammation impairs the absorption of critical nutrients that support linear growth. Moreover, poor diets that do not support microbiota diversity and microbial succession can increase the risk of enteropathy and diarrhoea, which significantly impair a child’s nutrient utilisation(Reference Robertson, Manges and Finlay65).
A wealth of evidence has demonstrated negative effects of increased UPF intake on gut health. A study centred on a Spanish adult population found that gut microbiota richness and diversity were negatively correlated with increased UPF consumption in males(Reference Cuevas-Sierra, Milagro and Aranaz24). The study also found an association between increased UPF consumption and the Enterobacterales bacterial order, which includes E. coli. Another study in mice found that a high-fat and high-sugar diet altered the gut microbiota and enhanced an inflammatory gastrointestinal environment with increased levels of mucosa that favoured E. coli colonisation in the gut(Reference Agus, Denizot and Thévenot23). E. coli and associated enteropathogenic outcomes during early childhood are consistently linked to diarrhoea, gastrointestinal inflammation and growth faltering(Reference Lee, Paredes Olortegui and Peñataro Yori66,Reference Khalil, Troeger and Blacker67) . Emulsifiers, an industrial ingredient found in many UPF(Reference Monteiro, Cannon and Lawrence12), have also been associated with negative impacts on gut microbiota composition and consequent colon and intestinal inflammation in mice(Reference Chassaing, Van de Wiele and Bodt68,Reference Chassaing, Koren and Goodrich69) .
Although results from the univariate analysis assessing the relationship between caregiver-reported diarrhoea and UPF consumption were statistically non-significant, the prevalence of diarrhoeal morbidity within the highest tertile of UPF consumption was comparatively higher (26·8 %) than the prevalence for the lowest tertile of UPF consumption (16·7 %). It is therefore possible that the increased odds of stunting in the highest tertile may be mediated by UPF-triggered gut inflammation and related diarrhoeal outcomes.
Our study presented limited evidence for relationships between UPF consumption and increased WHZ, contrary to our hypothesis for weight status. Adjusted magnitudes of association generally trended in the negative direction, with savoury snacks being the only factor significantly associated with decreased WHZ. These findings did not parallel the general consensus around UPF consumption and its links to increased risk of overweight and obesity in children(Reference Costa, Del-Ponte and Assunção17,Reference Askari, Heshmati and Shahinfar18) . However, similar findings were reported in Pries and colleagues’(Reference Pries, Rehman and Filteau22) study from Nepal, with non-significant and negative associations reported for associations between total energy intake from complementary ultra-processed snack foods and weight-for-length z-scores. Given the young ages of the children in the Lulun II cohort, it is likely that the cumulative effect of UPF on overweight outcomes is not yet present and may manifest later in life(Reference Sirkka, Fleischmann and Abrahamse-Berkeveld70).
WHZ is used to indicate overweight as well as wasting (WHZ < –2), an acute presentation of child undernutrition characterised by rapid weight loss in a child or their inability to gain weight(71). Although there were no children with wasting nor overweight in the sample, the negative trends found across the models – particularly for the statistically significant salty snack category – may signal the potential for increased risk of acute weight loss. Here, the potential mechanism may, again, be related to the poor nutritional quality of UPF or the negative effects that excessive UPF intake induces on the gut microbiota. In children with acute undernutrition, having undernourished or immature gut microbiota is known to induce weight loss mainly due to disruptions in amino acid metabolism, which consequently leave the body in a catabolic state and hinder the building of lean mass(Reference Robertson, Manges and Finlay65). It is imperative that future observational studies attempt to better understand potential mechanisms for this downward weight trend. This is particularly important for low- and middle-income settings where child wasting is prevalent, but UPF consumption continues to grow rampant.
Our findings on bone maturation did not support our established hypothesis nor the emerging evidence directly assessing UPF impacts on bone health parameters. Furthermore, given the significant positive association that has previously been found between BAZ and HAZ in this cohort(Reference Nicholas, Douglas and Waters26), we anticipated that the directions for the respective associations between UPF consumption and indicators of linear growth and bone maturation would be similar. One potential explanation for our findings on bone maturation pertains to the likely intake of Calcium, a mineral that supports bone ossification, from UPF. Despite evidence generally associating UPF consumption with reduced intake of several critical nutrients, some representative epidemiological studies have specifically observed increased intake of Calcium in relation to increased UPF intake(Reference Kim, Hu and Rebholz34,Reference Bielemann, Motta and Minten72,Reference Martínez Steele, Raubenheimer and Simpson73) . It is however important to recognise that dietary patterns and nutrient interactions within a diet matrix – rather than a single nutrient – are better predictors for nutrition-related outcomes(Reference Ambrosini74,Reference Iannotti, Gyimah and Reid75) . Emerging experimental evidence mostly points to the negative impacts of increased UPF intake on bone health. In one study, increased consumption of UPF was found to damage the growth plate zones in the bones of infant rats, suggesting increased risk for stunting(Reference Zaretsky, Griess-Fishheimer and Carmi25). Moreover, UPF intake had a negative impact on the genetic material that is involved in promoting bone quality and elongation(Reference Zaretsky, Griess-Fishheimer and Carmi25). In Travinsky-Shmul and colleagues’ study with rodent models(Reference Travinsky-Shmul, Beresh and Zaretsky76), a UPF-based diet was found to negatively impact several bone growth and quality parameters, with minimal improvements resulting from supplementation with Calcium or a multivitamin–mineral complex. The same study also found that a UPF-based diet increased bone marrow adiposity(Reference Travinsky-Shmul, Beresh and Zaretsky76). In the present study, the higher BAZ scores for children in the highest tertile may have been confounded by increases in bone marrow adiposity, possibly a result of UPF consumption patterns.
An additional mechanism through which UPF-induced bone advancement may occur is through inflammation. UPF consumption has been linked to an array of inflammatory biomarkers(Reference Bujtor, Turner and Torres15), including IL-1β and IL-6(Reference Olmo, Butler and Barrientos77). In adults, the inflammatory cytokine IL-1β has been found to modulate endochondral ossification via the bone marrow(Reference Mumme, Scotti and Papadimitropoulos78). On the other hand, inflammation may be associated with decreased bone age but through the pathway of impaired height velocity. In a study comparing young children with HIV according to the degree of height velocity impairment, the release of IL-6 was negatively correlated with bone age(Reference de Martino, Galli and Chiarelli79). Western dietary patterns, characterised by significant UPF consumption, have been linked to increases in IL-6(Reference Bujtor, Turner and Torres15). UPF-induced inflammation via IL-6 may therefore explain the significant findings observed for linear growth outcomes after controlling for child bone age (i.e. direct effect).
The significant and positive association found between UPF consumption and bone age in our study may suggest early bone maturation, which may not necessarily reflect the potential for sustained linear growth(Reference Sopher, Jean and Zwany80,Reference Diaz, Bhandari and Sison81) . Bone age assessments in studies of older children, also following the standards of Greulich and Pyle(Reference Greulich and Pyle39), have shown positive correlations between bone age and height during childhood(Reference Sopher, Jean and Zwany80,Reference Pinhas-Hamiel, Benary and Mazor-Aronovich82) . While these associations parallel results previously reported for the cohort in this present study(Reference Nicholas, Douglas and Waters26), this observed association may present implications for the children’s growth later in life. Evidence suggests that young children with advanced bone ages reach their adult heights at a faster rate and would likely have sub-optimal heights as adults(Reference Sopher, Jean and Zwany80,Reference Diaz, Bhandari and Sison81) . Studies citing this relationship between bone age and height have often also found positive associations between bone age and other outcomes that are typically associated with increased UPF intake including obesity, adiposity, hyperinsulinaemia and hyperthyroidism(Reference Cavallo, Mohn and Chiarelli37,Reference Sopher, Jean and Zwany80,Reference Diaz, Bhandari and Sison81) . Given the absence of overweight in this sample, obesity is not a likely mediator of the significant relationship between UPF and bone age. On the other hand, body fat could have mediated this relationship. Body composition was not assessed in Lulun II. However, it is possible that some of the children with high BAZ scores may have had slightly higher body fat. Studies of children in Brazil have associated stunting with increased fat mass and central adiposity(Reference Martins, Hoffman and Fernandes83,Reference Hoffman, Martins and Roberts84) . Given the high prevalence of stunting in the highest tertile of UPF consumption (61 %), we can infer that increased body fat may have been a key factor in our findings for bone maturation of children in the highest tertile of UPF intake. The significant relationship found between UPF intake and BAZ may also be through the pathway of other cardiometabolic biomarkers or outcomes which were generally beyond the scope of the larger Lulun study. These findings merit further research to identify mediating inflammatory and cardiometabolic biomarkers, particularly those that are equally implicated in UPF consumption and the outcomes of bone quality and stunted growth.
It is important to recognise that univariate analyses generally resulted in trending but non-significant associations between the frequency of UPF intake and the outcomes of interest. Thus, the findings presented here, particularly for linear growth, should be viewed in the context of covariate factors that were included in the analyses. Our findings suggest that UPF consumption influences the outcomes studied only after accounting for these factors. The literature generally suggests that the confounding exposures bear some influence on both UPF consumption and nutrition status. In emerging economies, higher-income households are more likely than poorer household to purchase UPF, whereas the opposite is observed for poorer households in high-income countries(Reference Baker, Machado and Santos1). On the other hand, stunted growth is known to be more prevalent among poorer households in low- and middle-income countries(Reference Black, Victora and Walker85,Reference Black, Walker and Fernald86) . Consumption of UPF also contributes to energy intake which also influences nutritional status. Dietary diversity, as a proxy for energy intake(Reference Rose, Chotard and Oliveira42) as well as food access and security(Reference Swindale and Bilinksy87), may also be related to choices around UPF consumption. In some populations, food insecurity has been associated with increased intake of UPF(Reference Leung, Fulay and Parnarouskis88). Future research may consider studying socio-economic factors and measures of diet quality and access as effect modifiers in the relationship between UPF intake and health outcomes.
Analyses of a random convenience sample of UPF found in a primary school environment demonstrated the availability of unhealthy food items, as reflected in elevated contents of saturated fats, added sugars and sodium, along with low amounts of protein and fibre. The nutrition profiling presented here only represents a small sample of UPF available to children in the community. The results are, however, consistent with qualitative findings of a recent Ecuadorian study demonstrating child preferences for unhealthy UPF which are often obtained within the school environment(Reference Freire, Waters and Rivas-Mariño89). The school food environment acts as a proxy for understanding potential UPF consumption trends among the younger children sampled, recognising the importance of likely food sharing with older siblings(Reference Barragan, Brooks and Meltzoff90). Studies from Latin America suggest that children are increasingly exposed to UPF through easy access within their homes and neighbourhoods(Reference Leite, de Carvalho Cremm and de Abreu91) as well as their school environments(Reference Noll, Noll and de Abreu92–Reference Morshed, Becker and Delnatus94). Further research directly linking child growth outcomes with UPF nutrition profiles and availability in children’s environments is needed.
This study bears limitations which should be considered when interpreting the findings reported here. Being a cross-sectional analysis, the temporal sequence between UPF consumption and each outcome studied is not clear. Thus, the results should be viewed merely as associations, rather than causal relationships, between the exposures and outcomes. Additionally, being based on a relatively small and rural population sample, the children sampled here may not be representative of different populations worldwide or in Ecuador. The operationalisation of UPF exposure also presents some limitations. Although the 24-hour FFQ is a widely used and validated technique for conducting dietary assessments, a single 24-hour FFQ does not adequately capture usual intake of UPF; it is, however, useful in describing average dietary intake in a population(Reference Thompson and Subar95). Additionally, given that we did not collect detailed dietary data to capture standard portion sizes and energetic intake, we were limited in our ability to determine the proportion of energy intake attributed to UPF consumption, which may influence the outcomes studied. Social desirability bias is also somewhat likely with food intake reporting using the FFQ. However, the questionnaire asked for consumption frequencies of different foods that have been found to be a part of the Ecuadorian diet(Reference Gallegos Riofrío and Waters29) and not necessarily for ‘UPF’. Despite these limitations, this study may be the first, to our knowledge, to assess the potential effects of different UPF on child growth, while attempting to elucidate the role that skeletal maturity plays in this hypothesised aetiology. Otherwise, prior evidence on our primary hypotheses has been based on experiments with rodent models.
Conclusion
In Ecuador and elsewhere in Latin America, national dietary guidelines emphasise the importance of limiting UPF consumption(Reference Monteiro, Cannon and Levy11,Reference Freire, Waters and Rivas-Mariño89) . These guidelines, as reflected in package labelling, often focus on consumer information highlighting overweight, obesity and other nutrition-related non-communicable diseases, while there is less emphasis on potential impacts on child undernutrition. However, through our study of a rural population in Ecuador (where stunting disproportionately affects rural and Indigenous populations(Reference Hajri, Angamarca-Armijos and Caceres6)), we found that increased UPF consumption was associated with stunted growth. Considering the existing double burden of malnutrition globally and in Ecuador, where risk profiles for overweight and obesity may parallel those for undernutrition, this study provides key insights into UPF consumption as a potentially underreported risk factor for growth faltering. The findings presented here demonstrate the importance of understanding outcomes of undernutrition in research and discourse around UPF consumption. Policy considerations and dietary guidelines on UPF availability, access and consumption may highlight complex pathways from increased UPF intake to growth faltering as part of key strategies to holistically address poor nutrition across the malnutrition spectrum.
Acknowledgements
The authors express their gratitude to all families and enumerators who participated in the Lulun project. The Lulun study was funded by The Bill and Melinda Gates Foundation and The Mathile Institute for the Advancement of Human Nutrition.
The funders had no role in the study design, data analysis or writing of this article.
The authors’ roles were as follows: E. A. G. conceptualised the research questions for this study, analysed and interpreted the data, wrote the manuscript, and bore primary responsibility for the manuscript’s content; L. L. I. conceptualised the original Lulun study and the research questions for this current study, interpreted the findings, supported initial drafts and critically reviewed the manuscript; J. L. N. and K. E. D. conducted and interpreted ultrasound assessments, interpreted the data and critically reviewed the manuscript; C. A. G.-R. conducted the Lulun study and critically reviewed the manuscript; W. F. W. conducted the Lulun study and critically reviewed the manuscript; I. B. collected and supported data analysis for nutrition profiling and critically reviewed the manuscript; M. C. conducted the Lulun study, collected and supported data analysis for nutrition profiling, interpreted the findings and critically reviewed the manuscript.
The authors have no conflicts of interest to report.
Supplementary material
For supplementary material referred to in this article, please visit https://doi.org/10.1017/S0007114523000624


 Open access