


Public health research has demonstrated growing attention to the commercial determinants of health, a body of work which explores the systems, practices and pathways through which commercial actors drive health and equity outcomes(Reference Gilmore, Fabbri and Baum1). Within this framework, food industry interests are recognised as exerting considerable influence over global food systems, fundamentally affecting both dietary patterns and population health outcomes(Reference Swinburn, Kraak and Allender2). Trade and investment agreements (TIA) are a critical commercial determinant of health that steer global food markets and supply chain integration as well as governments’ policy space to regulate food and agricultural products through legally binding provisions and enforcement mechanisms regarding the policymaking process(Reference Schram, Ruckert and VanDuzer3,Reference Garton, Thow and Swinburn4) .
TIA aim to increase the flow of goods, services and capital across borders and have irreversibly altered the design of food systems, including the degree of global integration and corporate concentration(Reference Clapp5). The current research draws on a range of publications that have elaborated the mechanisms in TIA that shape food environments(Reference Schram, Ruckert and VanDuzer3,Reference Friel, Hattersley and Snowdon6,Reference Friel, Schram and Townsend7) . Briefly, TIA include a series of mechanisms that shape domestic food environments, such as reducing the taxes on food imports, opening new areas of the food environment (e.g. food manufacturing, retail sales and restaurants) to foreign investment or increasing the amount of foreign ownership allowed, and harmonising food standards, rules and policy procedures. TIA also embed enforcement procedures and financial penalties for non-compliance(Reference Schram, Ruckert and VanDuzer3). Transnational food corporations actively seek to shape TIA to facilitate global market expansion for their products through privileged access to trade negotiations, strategic lobbying efforts and significant influence over governments’ negotiating positions(Reference Schram and Townsend8,Reference Townsend, Schram and Labonté9) . This corporate influence steers content towards protecting intellectual property rights, reducing tariffs on processed foods and enhancing barriers to progressive domestic regulation, such as interpretive food labelling schemes or restrictive marketing requirements(Reference Labonté, Schram and Ruckert10–Reference Garton, Swinburn and Thow12).
The relationship between trade and investment policy and nutrition outcomes is complex and multifaceted. Research has demonstrated that a country’s openness to trade has been linked to increased fruit and vegetable supply(Reference Cowling, Stuart and Neff13), greater dietary diversity and an increase in total calories available in national food supplies(Reference Dithmer and Abdulai14). Trade in food commodities has also been shown to significantly reduce price volatility compared to no-trade scenarios(Reference Ivanic, Martin and Mattoo15), helping to stabilise food markets, though these effects vary(Reference Barlow, Loopstra and Tarasuk16). At the same time, research has also consistently found that the presence of trade agreements and foreign direct investment (FDI) is associated with an increased prevalence and consumption of ultra-processed foods (UPF) and sugar-sweetened beverages(Reference Schram, Labonte and Baker17–Reference Clark, Hawkes and Murphy22). This relationship between presence of TIA and FDI has been particularly pronounced in the food processing sector, where transnational food companies have established comprehensive control over food supply chains through both horizontal and vertical integration(Reference Hawkes23,Reference Bolling and Somwaru24) . This supply chain control, enabled in part through TIA, has produced a concentration of corporate power that has fundamentally altered food environments, giving these companies greater influence over dietary options, pricing and marketing strategies, with a particular emphasis on UPF due to their high profit margins and marketing potential(Reference Stuckler, McKee and Ebrahim25,Reference Friel, Gleeson and Thow26) .
UPF, as defined by the NOVA system, typically feature factory-made compositions predominantly derived from chemically altered food components, supplemented with additives aimed at improving flavour, consistency, visual appeal and shelf life, frequently lacking substantial amounts of whole, unprocessed foods(Reference Monteiro, Cannon and Lawrence27,Reference Monteiro, Cannon and Levy28) . UPF cover a broad spectrum of convenience products, including packaged snacks, soft drinks and frozen entrees, among others. Consumption of UPF has been associated with various detrimental effects on health, including an increased risk of heart disease, cancer, type 2 diabetes, adverse mental health outcomes and premature mortality in multiple studies(Reference Lane, Gamage and Du29), although some evidence may suggest that this does not apply to all UPF subgroups(Reference Chen, Khandpur and Desjardins30).
The International Network for Food and Obesity/Non-communicable Diseases Research, Monitoring and Action Support (INFORMAS) was established to monitor and benchmark food environments, both nationally and globally, including the government policies and private sector actions that shape those environments(Reference Swinburn, Sacks and Vandevijvere31). Figure 1 provides an overview of the structure of the INFORMAS modules(Reference Swinburn, Sacks and Vandevijvere31). One component of INFORMAS focuses on international TIA and has developed a proposed approach for monitoring the impact of these agreements on food environments(Reference Friel, Hattersley and Snowdon6). To date, the implementation of this monitoring protocol has been limited to a few Pacific Island countries(Reference Ravuvu, Friel and Thow32–Reference Ravuvu, Friel and Thow34). The following paper presents the outcomes of implementing the monitoring protocol in Canada, as a component of a broader initiative aimed at executing the complete suite of INFORMAS monitoring activities(Reference Swinburn, Sacks and Vandevijvere31).
INFORMAS framework. INFORMAS, International Network for Food and Obesity/Non-communicable Diseases Research, Monitoring and Action Support.

Methods
Protocol
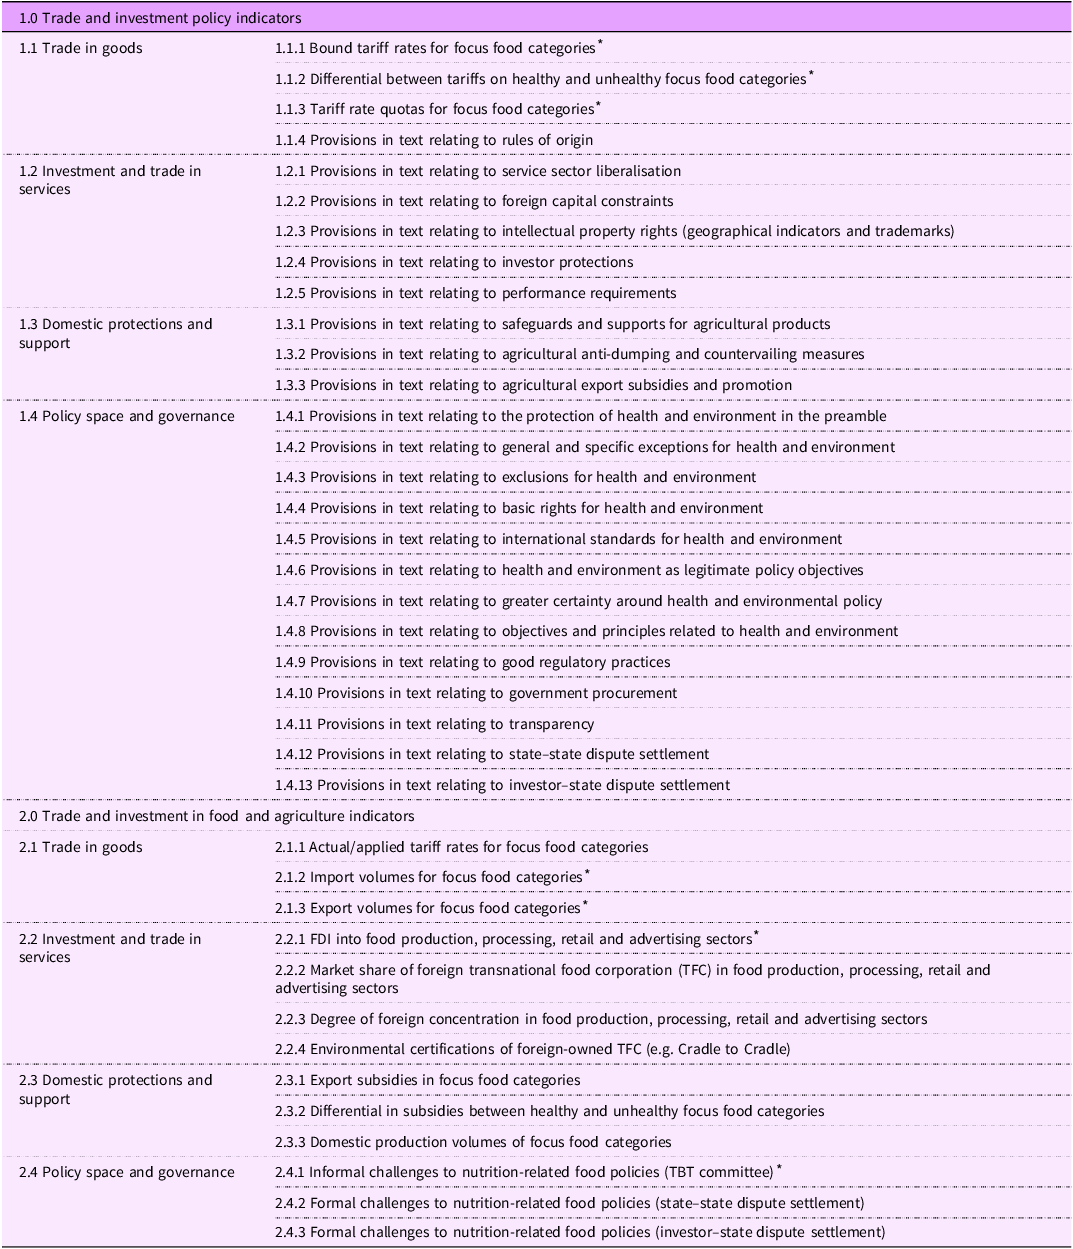
As part of a larger initiative to redevelop the trade and investment module for the global INFORMAS project, we implemented a revised version of the original monitoring protocol meant to streamline the indicators and support feasibility of implementation. For this analysis, we selected a subset of indicators with publicly accessible databases. Table 1 provides an overview of twenty-five policy indicators (and the three selected for this study) and thirteen food and agricultural indicators (and the four selected for this study). The monitoring of some identified indicators (e.g. 2·2·2 and 2·2·3 in Table 1) have been published elsewhere(Reference Gaucher-Holm, Wood and Sacks35) due to the overlap of certain indicators between the INFORMAS modules.
Streamlined INFORMAS trade and investment monitoring protocol

INFORMAS, International Network for Food and Obesity/Non-communicable Diseases Research, Monitoring and Action Support; FDI, foreign direct investment; TBT, Technical Barriers to Trade; TFC, transnational food corporations.
* Included in the current analysis.
Participants
The current monitoring initiative focuses exclusively on Canada. Canada was among the original signatories, along with twenty-two other nations, to the General Agreement on Tariffs and Trade (GATT), which took effect on 1 January 1948. Furthermore, Canada was one of the founding members of the World Trade Organization (WTO) in 1995. The WTO, in addition to administering the GATT, oversees approximately sixty agreements and annexes that delineate the regulations governing global trade in goods, services, intellectual property, dispute resolution and various administrative activities among 165 nations. Agreements outside the purview of the WTO typically expand upon the framework established by these foundational agreements. They aim to secure more extensive commitments to liberalisation and further harmonisation of regulations to facilitate the seamless movement of goods, services and capital across borders. As of March 2024, Canada had fifteen TIA in force with fifty-one different countries (Figure 2).
Timeline of Canada’s major free trade agreements and parties involved, 1990–2024. Regional and bilateral TIA are shown in black text, of which there are fifteen currently in force. The original WTO agreements are shown in blue text. This timeline does not include Canada’s Foreign Investment Promotion and Protection Agreements, of which there are thirty-seven in force, and three signed but not in force as of 2024. NAFTA, North American Free Trade Agreement; GATT, General Agreement on Tariffs and Trade; GATS, General Agreement on Trade in Services; TRIPS, Agreement on Trade-Related Aspects of Intellectual Property Rights; TRIMS, Agreement on Trade-Related Investment Measures; AoA, Agreement on Agriculture; CETA, EU-Canada Comprehensive Economic and Trade Agreement; CPTPP, Comprehensive and Progressive Agreement on Trans-Pacific Partnership; CUSMA, Canada-United States-Mexico Agreement; TIA, trade and investment agreements; WTO, World Trade Organization.

Single-country case studies provide a feasible and robust approach to implementing INFORMAS modules due to the resource-intensive nature of in-depth data collection and cleaning(Reference Ravuvu, Lui and Bani33,Reference Ravuvu, Friel and Thow34,Reference Vandevijvere, Seck and Pedroni36,Reference Elorriaga, Moyano and López37) . Canada offers a compelling case study for understanding the complex relationships between TIA and food environments due to its position as a highly trade-dependent economy with complex agricultural policies and significant international trade relationships. Other high-income, trade-oriented countries with complex agricultural sectors and multi-level governance systems, such as Australia, New Zealand and to some extent the Nordic countries like Sweden and Denmark, could extract valuable policy insights from comprehensive analysis of Canadian trade and investment policy and food environments. Countries with limited potential to gain policy insights from the current data may nevertheless benefit from a demonstration of the implementation of this module. Moreover, as part of a larger research endeavour to implement all of the INFORMAS modules in Canada, this study is supporting a robust and novel monitoring initiative that will allow for a holistic analysis of food environment transformations in Canada, enabling policymakers and researchers to develop nuanced insights into how TIA shape food systems, nutrition and public health. Finally, this analysis, though restricted to Canada, is contributing to the rather limited body of research that monitors how trade and investment shape food environments across the processing spectrum, rather than analysing specific food products.
Selection of focus foods
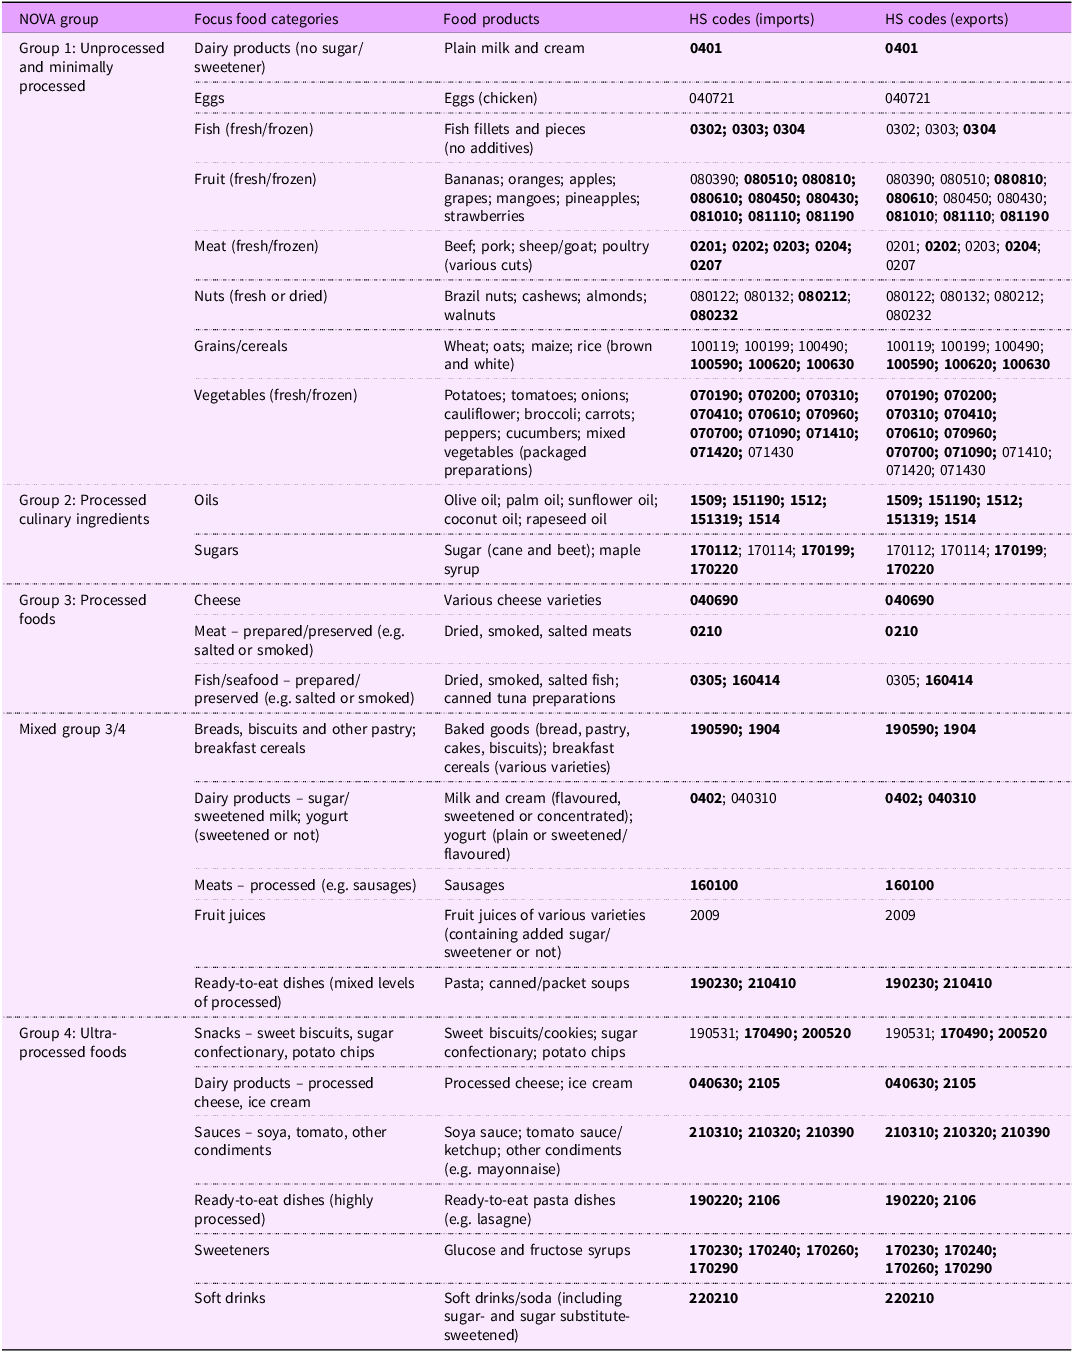
We elected to adopt the ‘minimal’ version of the original monitoring protocol, which involves selecting a set of focus foods for monitoring rather than all potential food categories, as significant resources are required to collect and clean the data. The set of focus food categories for monitoring the Canadian food environment were developed by the larger research team and were determined to be reflective of the range of foods in the average Canadian diet (see Table 2). We then identified a set of seventy-six Harmonised System (HS) food product codes that aligned with the focus food categories. HS codes to the six-digit level were included, as six-digit level is the most detailed product code level that is internationally standardised. When six-digit codes were not available, less detailed four-digit codes were used.
Focus food categories and food products included in these categories, by NOVA classification

Codes in bold were retained in the analysis, and non-bolded codes were excluded on the grounds of missing data.
We categorised all food products in accordance with the NOVA classification system(Reference Monteiro, Cannon and Lawrence27,Reference Monteiro, Cannon and Levy28) , which is highly applicable for research related to food trade and investment, to enable an assessment of the variation in the relationships between trade and investment and different levels of food processing. NOVA classifies foods into four groups based on the nature, extent, purpose and effects of processing on nutritional composition, including: Group 1 (unprocessed and minimally processed foods), Group 2 (processed culinary ingredients), Group 3 (processed foods) and Group 4 (UPF). NOVA is by far the most applied food classification system in scientific literature examining links between highly processed food consumption, diet quality and health outcomes(Reference Chen, Zhang and Yang38,Reference Lawrence and Baker39) . We assigned food products a NOVA classification by reviewing their HS code descriptions, which provide information on the specific foods covered by the code. Based on this information, if the majority of foods covered by the HS code were of the same level of processing (i.e. Group 1, 2, 3 or 4), we classified the food product at the corresponding level. If, however, the majority of foods were of different levels of processing, then we categorised the food product as a mix of these respective levels (i.e. mixed – Groups 3 and 4). This generally occurred when an HS code covered foods that vary significantly in their level of processing, for example, breakfast cereals.
Data collection
Tariff rate data
We collected data on tariff rates for six time points (1994, 1995, 2005, 2010, 2015 and 2020). Tariff rates for the years 1994 and 1995 were drawn from the WTO Canada Tariff schedule, which we requested from the Canada Border Services Agency; for all subsequent time points, the Canada Customs Tariff Schedule ‘consolidated report’ was utilised which is publicly available online. When a nominated HS code had multiple subcodes (this applied to most four and several six-digit HS codes), we went to the first respective subcode that reported a tariff rate and used this as an ‘indicator’ rate for the HS code. If a rate was in the form of a tariff rate quota, we took the over access commitment rate (imports made outside the established quota for goods in a category) as the tariff. This was on the basis that recording where tariffs are still in place gives insight into where scope remains to modify (or maintain) tariffs to improve the quality of healthiness of the domestic food supply. We limited data collection to ad valorem tariffs (% of the value of the product, e.g. a 10 % ad valorem tariff on apples would amount to $10 in tariffs for every $100 of apples imported), which was the form most tariffs were expressed in. For compound tariffs (i.e. a specific tariff amount such as a dollar amount per kilogram imported plus an added % value), we imputed the % component only (which provides an approximation only and will underestimate the tariff in various amounts) so that these data could be included in the analysis.
Canadian tariff schedules also identify a range of countries and country groupings that have preferential trading arrangements. We identified all countries belonging to bilateral or multilateral preferential trading arrangements that trade freely (0 % tariff) for each HS code and then reduced that list to the number of unique countries that trade freely for each HS code, updating multilateral memberships for each time point (e.g. which countries qualify for a least developed country tariff vary over time)(40).
Import and export data
Food import and export volume data were downloaded from the UN Comtrade database(40), operationalised as net weight in kilograms. We collected data for import and export trade flows between Canada and ‘the World’ as a trade partner (an all-countries aggregate trade partner), for all time points in the study period (1990–2021). To simplify reporting on an expansive set of data, we aggregated the data into seven time periods: 1990–1994, 1995–1999, 2000–2004, 2005–2009, 2010–2014, 2015–2019 and 2020–2021. Complete data (import and export volumes for all years) were not available for all selected HS codes in the Comtrade database. If a selected HS code was missing data for one or more time points for a trade flow, we removed it from the dataset for that trade flow to avoid artificial increases or decreases in trade volume over time. Out of a total of seventy-six HS codes identified as relevant to our food categories, we had a full dataset for sixty-four HS codes for imports (n 12 removed) and fifty-one HS codes for exports (n 25 removed). To analyse the change in import and export volumes of focus food categories over time, we used the Excel pivot table function to calculate the average volume of trade (net weight in kg) for each category for each time period, filtered by trade flow. We then calculated the percentage change in trade volume for the food categories between consecutive time periods (e.g. 1990–1994 to 1995–1999).
Foreign direct investment data
Data on FDI into food manufacturing in Canada and Canadian FDI abroad were retrieved from the Statistics Canada database (StatCan). StatCan reports data on international investment under the North American Industry Classification System (NAICS), which uses a six-digit hierarchical coding system to classify all economic activity into twenty industry sectors, which are further divided into subsectors and industries. However, data are often reported in StatCan only at the NAICS sector level, which limits the granularity at which the target of FDI can be examined. We collected data on FDI in Canada and Canadian direct investment abroad (annual amount in $CAD) for four NAICS sectors pertaining to food production, processing and retail: (1) agriculture, forestry and fishing; (2) food manufacturing; (3) beverage and tobacco product manufacturing and (4) accommodation and food services. Data were collected annually between 2000 (the earliest year point for which data were available) and 2022. To simplify reporting on an expansive set of data, we aggregated the data into five time periods: 2000–2004, 2005–2009, 2010–2014, 2015–2019 and 2020–2022. To analyse the change in foreign investment into food manufacturing over time, we used the Excel pivot table function to calculate the average investment amount for each of the four sectors for each time period by investment flow (FDI into Canada and Canadian direct investment abroad).
Policy space data
We collected data relating to policy space and food environment governance using the WTO’s Dispute Settlement database and ePing database of specific trade concerns (STC) raised in discussions in the Technical Barriers to Trade (TBT) and Sanitary and Phytosanitary (SPS) committees. For formal disputes, we selected Canada as either the complainant or the respondent member and scanned all results. For informal concerns raised, after selecting Canada as the member either raising or responding to challenges, we included the search term ‘food’, as ‘beverages’ retrieved mostly alcohol policies but ‘food’ generated food and non-alcoholic beverage policy actions under discussion. For both formal and informal challenges, we limited inclusion to healthy food environment policies (e.g. nutrition labelling, marketing restrictions, nutrient limits, food provision (including school food) and fiscal policies). These we identified by scanning the titles and reviewing the keywords and objectives on associated dispute or STC details webpages. We excluded any remaining policies relating to alcohol (e.g. health labelling) or tobacco and excluded any policies pertaining to issues not directly related to the healthiness of the food environment (e.g. genetically modified organisms (GMO), country of origin, food safety, allergens, halal, animal welfare and zoonotic disease prevention).
Once identified, we reviewed the details of the food environment policies incurring a formal dispute or informal concerns raised, to collect information on the policy in question, the reasons provided for challenging the policy, the parties involved and the outcome.
Results
Tariff rate findings
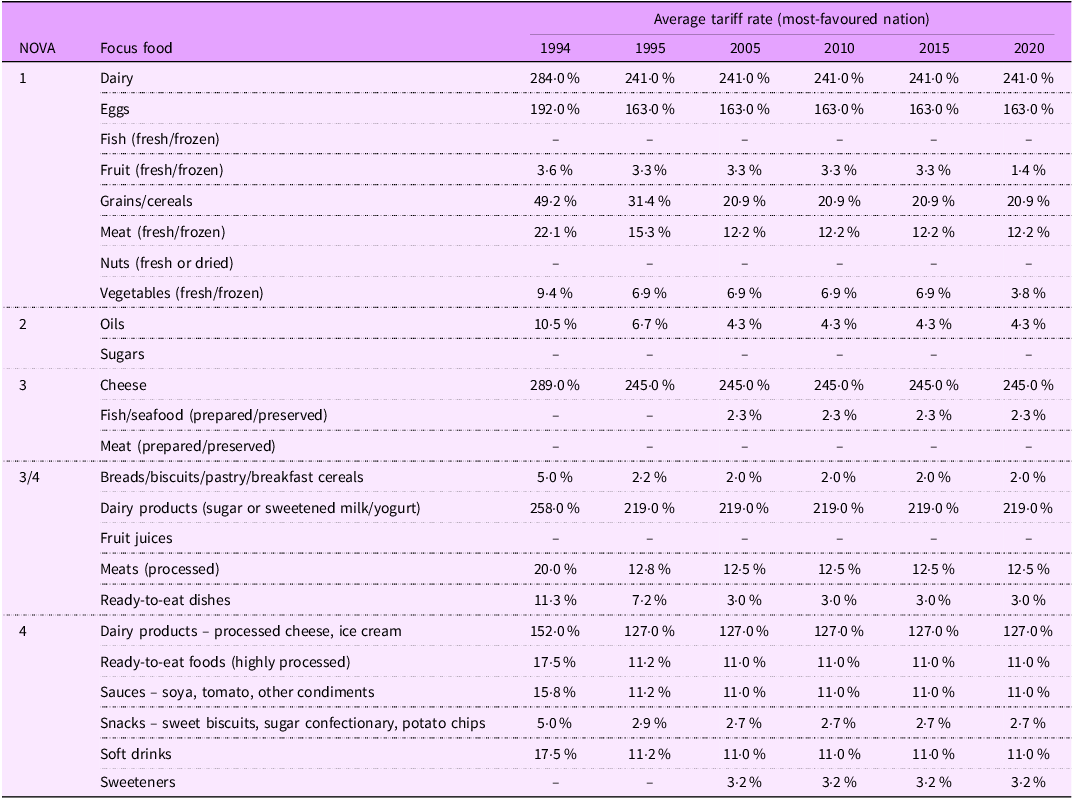
Table 3 presents the tariff rates on selected focus foods as applied in Canada. Between 1994 and 2020, the most extensive tariff rate reductions to our focus foods, across all levels of processing, occurred in 1995. This coincides with the establishment of the WTO and the updated GATT. Tariff rate reductions on our focus foods, across all levels of processing, have generally been minimal or non-existent since that time. Tariff rates on these focus foods, across all levels of processing, remain highest on eggs and dairy products, consistent with their status as supply managed agricultural sectors in Canada. Excluding eggs and dairy products, for our focus foods, across all levels of processing, there are only minimal tariff rates remaining. Tariff rates on selected NOVA Group 4 focus foods were generally the highest among the different levels of processing.
Average Canadian tariff rates for focus food categories by NOVA classification (1994–2020)

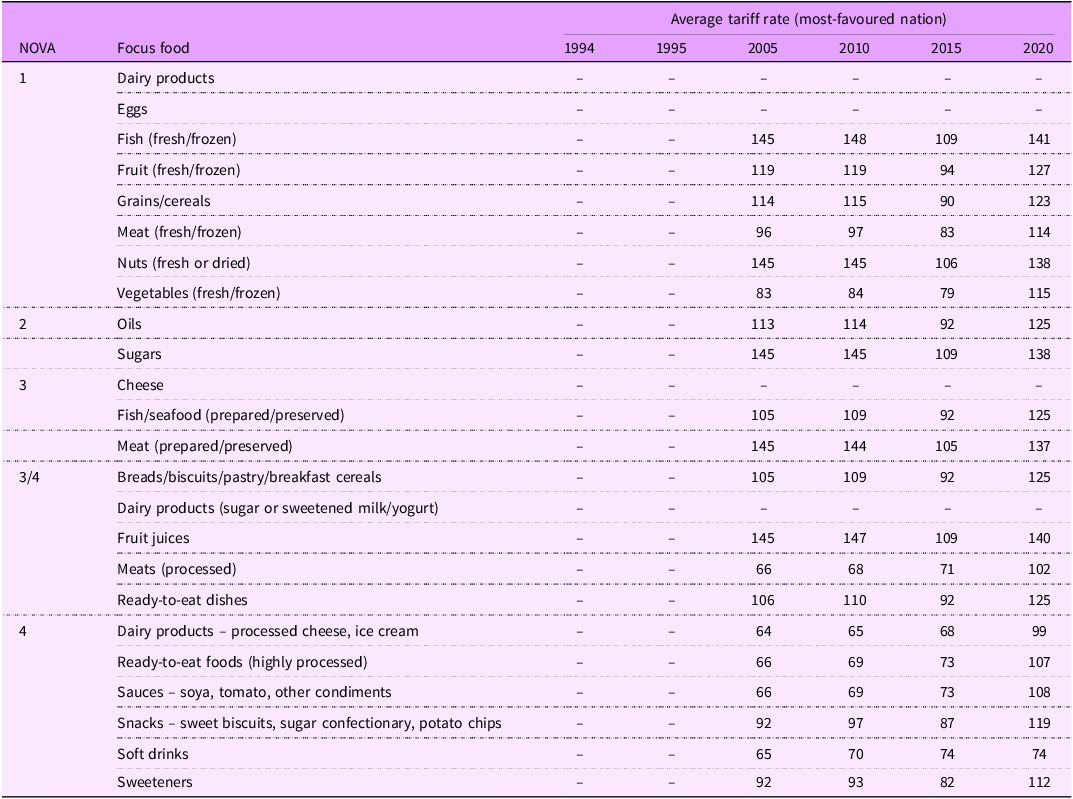
The number of countries trading freely with Canada on selected focus foods is presented in Table 4. Between 2005 and 2020, the number of countries trading freely with Canada on our focus foods, across all levels of processing, generally increased. The most consistent increase in the number of countries trading freely occurred within selected Group 3/4 and Group 4 foods. However, these selected Group 3/4 and Group 4 focus foods had the least number of countries trading freely in 2005 and continued to have the least number of countries trading freely in 2020 relative to the different levels of processing. That is, while they appeared to experience the most growth, the absolute number of countries trading freely on these products has remained the lowest over our period of study.
Average number of countries trading food products freely with Canada by NOVA classification (2005–2020)

Import and export findings
Figure 3 displays the observed changes in import volumes for our focus foods. In the period following Canada joining the WTO, there were large surges in the import of dairy products across varying levels of processing (with or without sugars or sweeteners), meats (prepared and preserved) and soft drinks into Canada, which coincided with tariff rate reductions. Notably, during the periods 2000–2004 and 2005–2009, the import of sugars into Canada experienced a substantial period of growth. Growth in import volumes for focus foods, across all levels of processing, has generally been positive, and growth rates are not dramatically different across the levels of processing. Periods of substantial growth in imports in the focus foods have not been followed by periods of substantial decline (with the exception of Group 3/4 and Group 4 dairy products) which indicates that increased absolute volumes of imports have been maintained.
% change in import volume for focus food categories by NOVA classification (1990–2021).

Figure 4 displays the observed changes in focus food export volumes. The export of Group 1 focus foods experienced a period of notable growth around Canada joining the WTO as well as across the period of study (in contrast to imports). There have been prominent surges in the export of grains and cereals, dairy products (with and without sugars or sweeteners), sugars, cheese, processed meats, ready-to-eat meals and sauces. Surges in the growth of exported dairy products (ultra-processed/Group 4) and sauces (ultra-processed/Group 4) were of a considerably higher magnitude relative to the other focus foods. Growth in export volumes for focus foods, across all levels of processing, has generally been positive, and growth rates are not dramatically different across the levels of processing. Similar to imports, periods of substantial growth in exports in the focus foods have not been followed by periods of substantial decline (with the exception of Group 3 cheese and prepared/preserved fish and seafood).
% change in export volume for focus food categories by NOVA classification (1990–2021).

Foreign direct investment findings
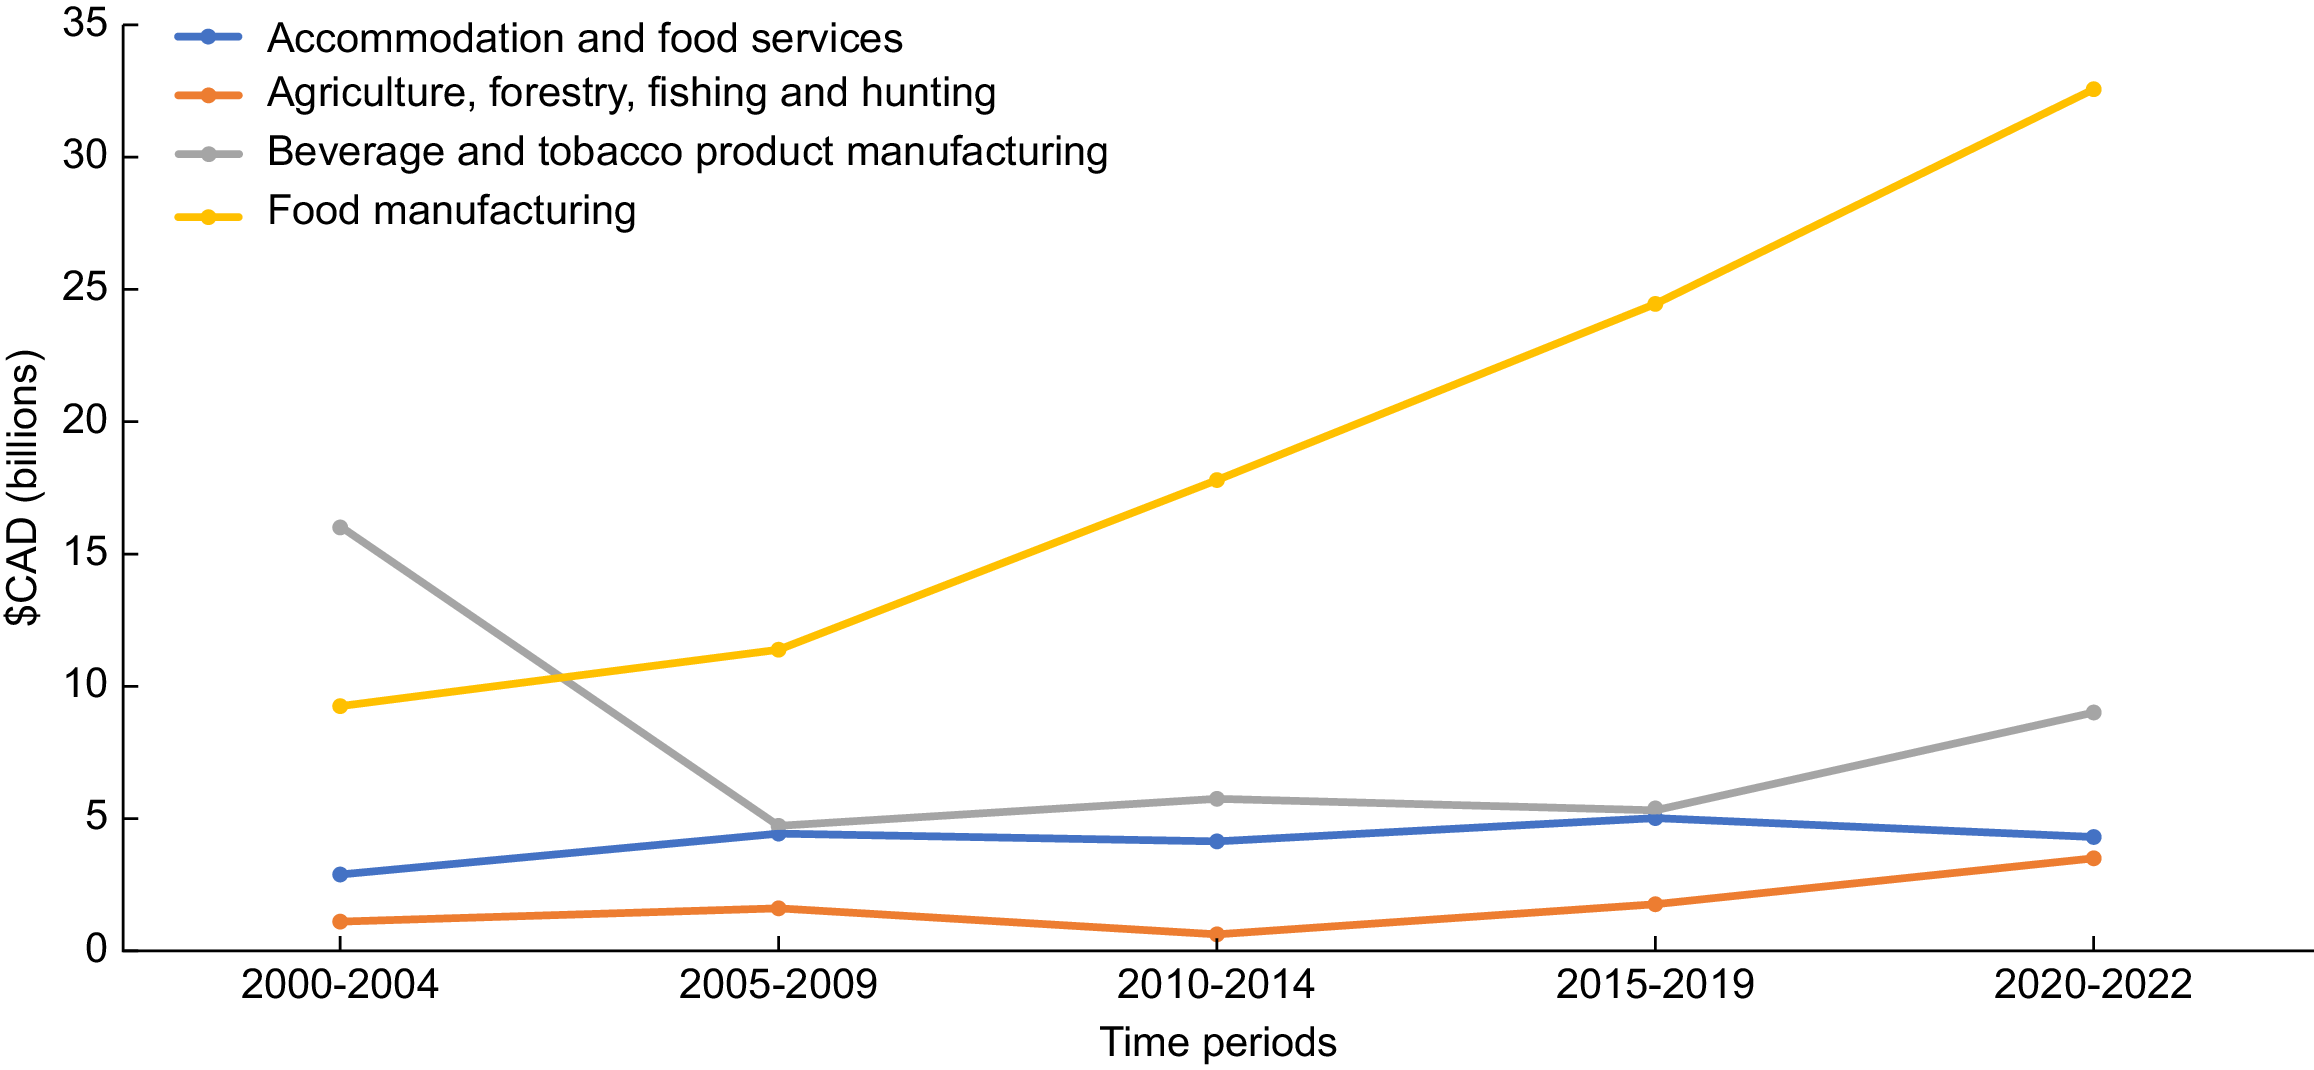
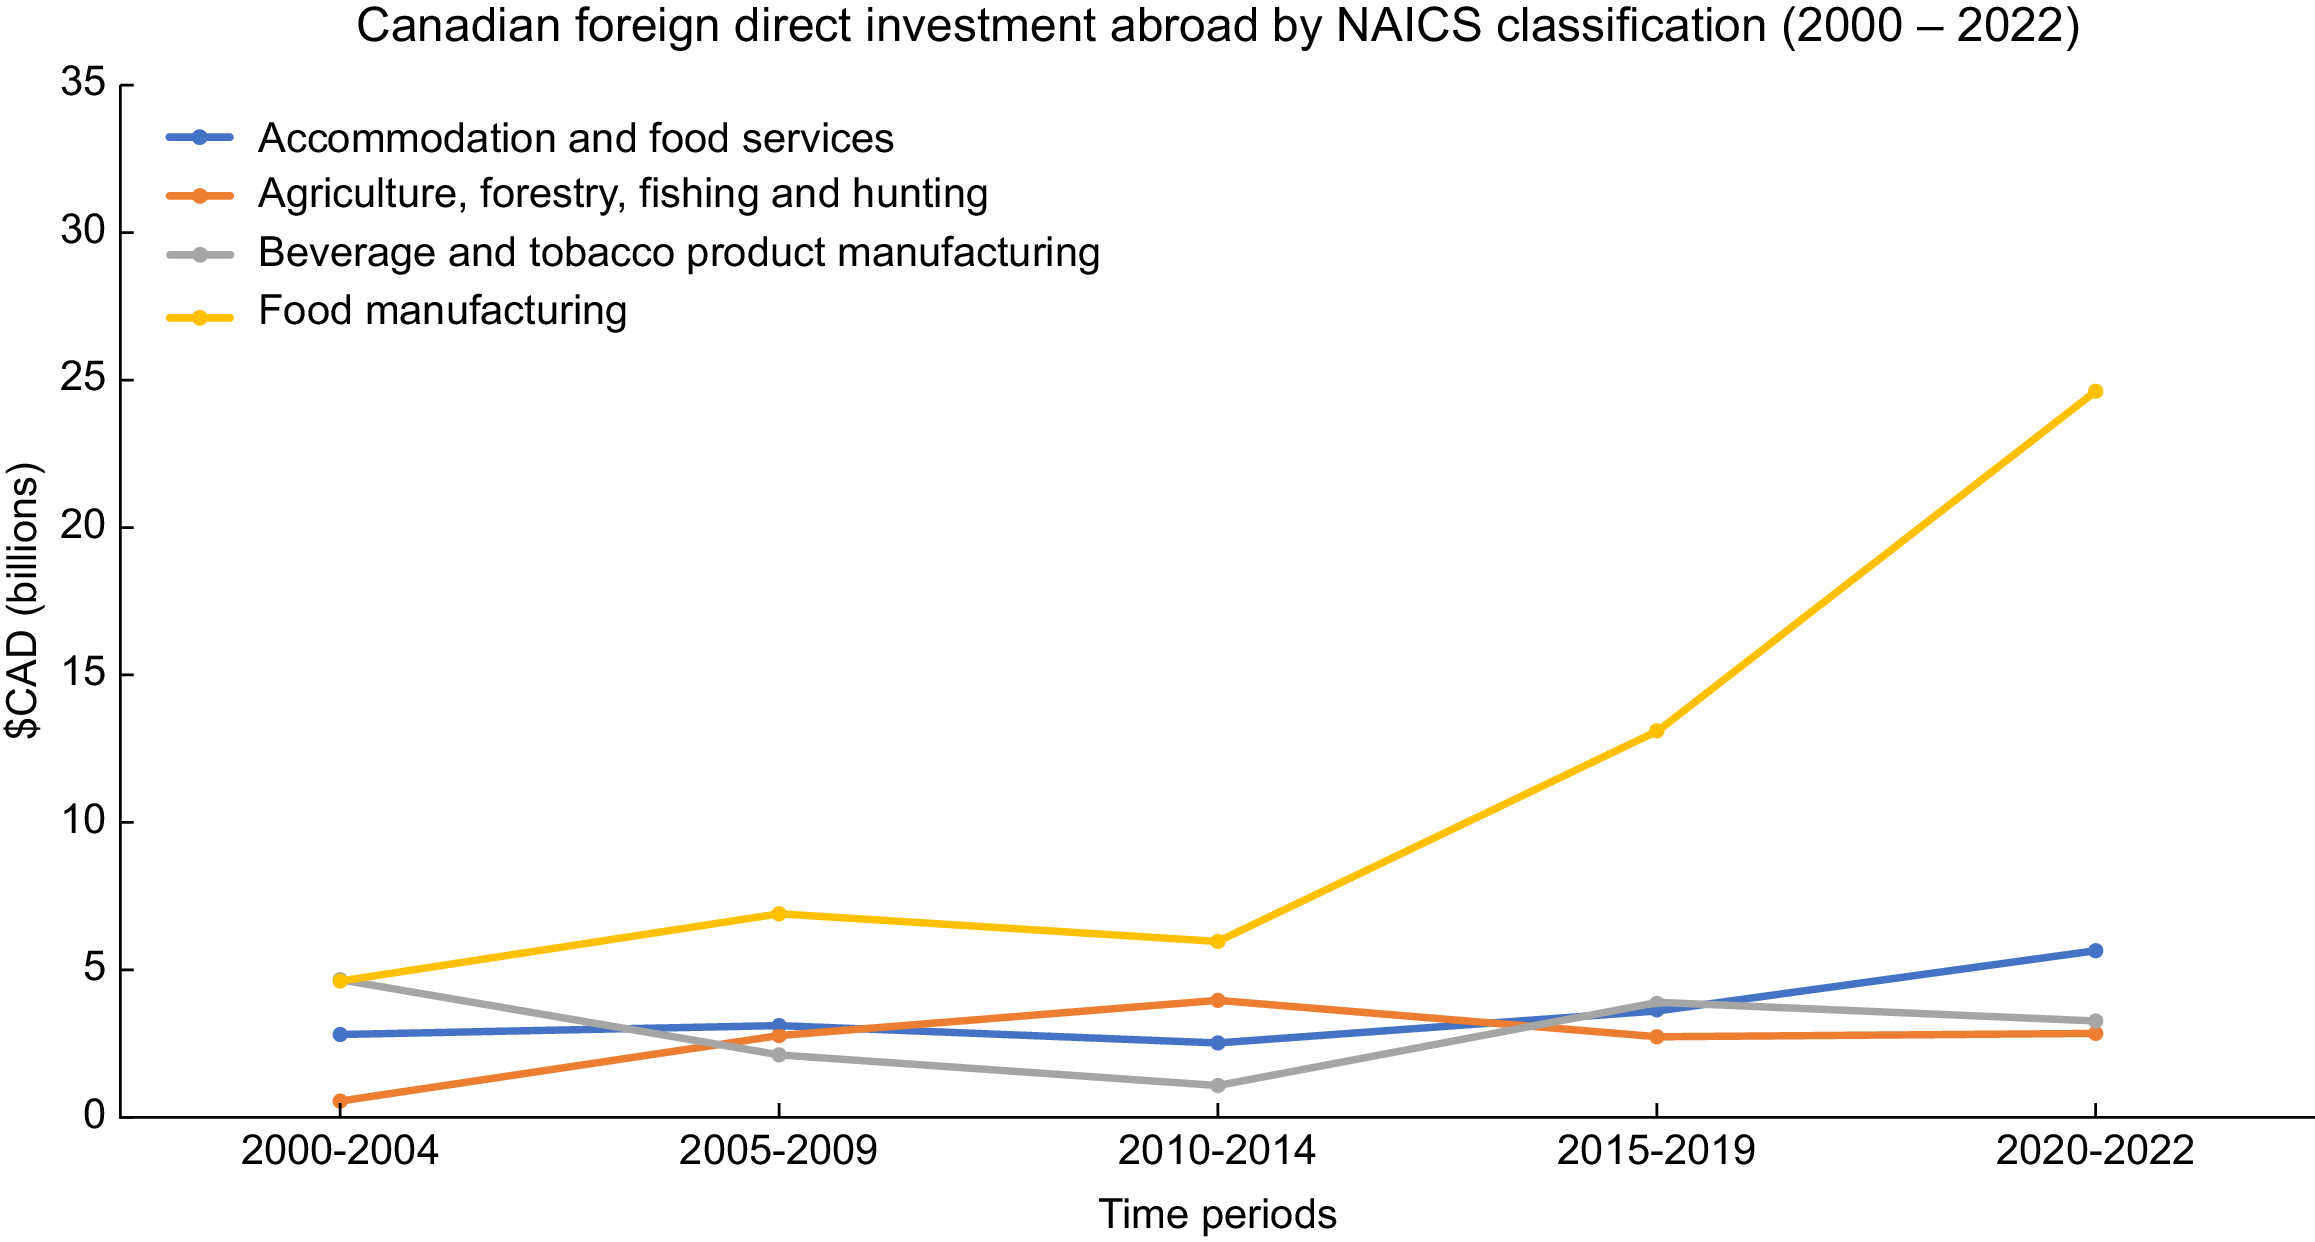
The value of food environment-related FDI into Canada (Figure 5) has generally been higher than the value of food environment-related Canadian FDI abroad (Figure 6). FDI in the food manufacturing subsector has notably outpaced all other food environment-related FDI categories. FDI into Canada and Canadian FDI abroad across (1) accommodation and food services; (2) agriculture, forestry, fishing and hunting; and (3) beverage and tobacco product manufacturing, between 2000 and 2022, has generally been between CAD 1 and 5 billion. FDI into Canada in food manufacturing has been consistently increasing since 2005, and in the period 2020–2022 was valued at CAD 32·6 billion dollars. Canadian FDI abroad into food manufacturing has been consistently increasing since 2010, and in the period 2020–2022 was valued at CAD 24·6 billion dollars.
Foreign direct investment in Canada by NAICS classification (2000–2022). NAICS, North American Industry Classification System.

Canadian foreign direct investment abroad by NAICS classification (2000–2022). NAICS, North American Industry Classification System.

Policy space findings
Between 1995 and 2024, Canada neither raised nor was the respondent to any formal trade or investment disputes of healthy food environment-related policies, nor was it a respondent to any STC (i.e. informal challenges) regarding healthy food environment-related policies through the TBT or SPS committees.
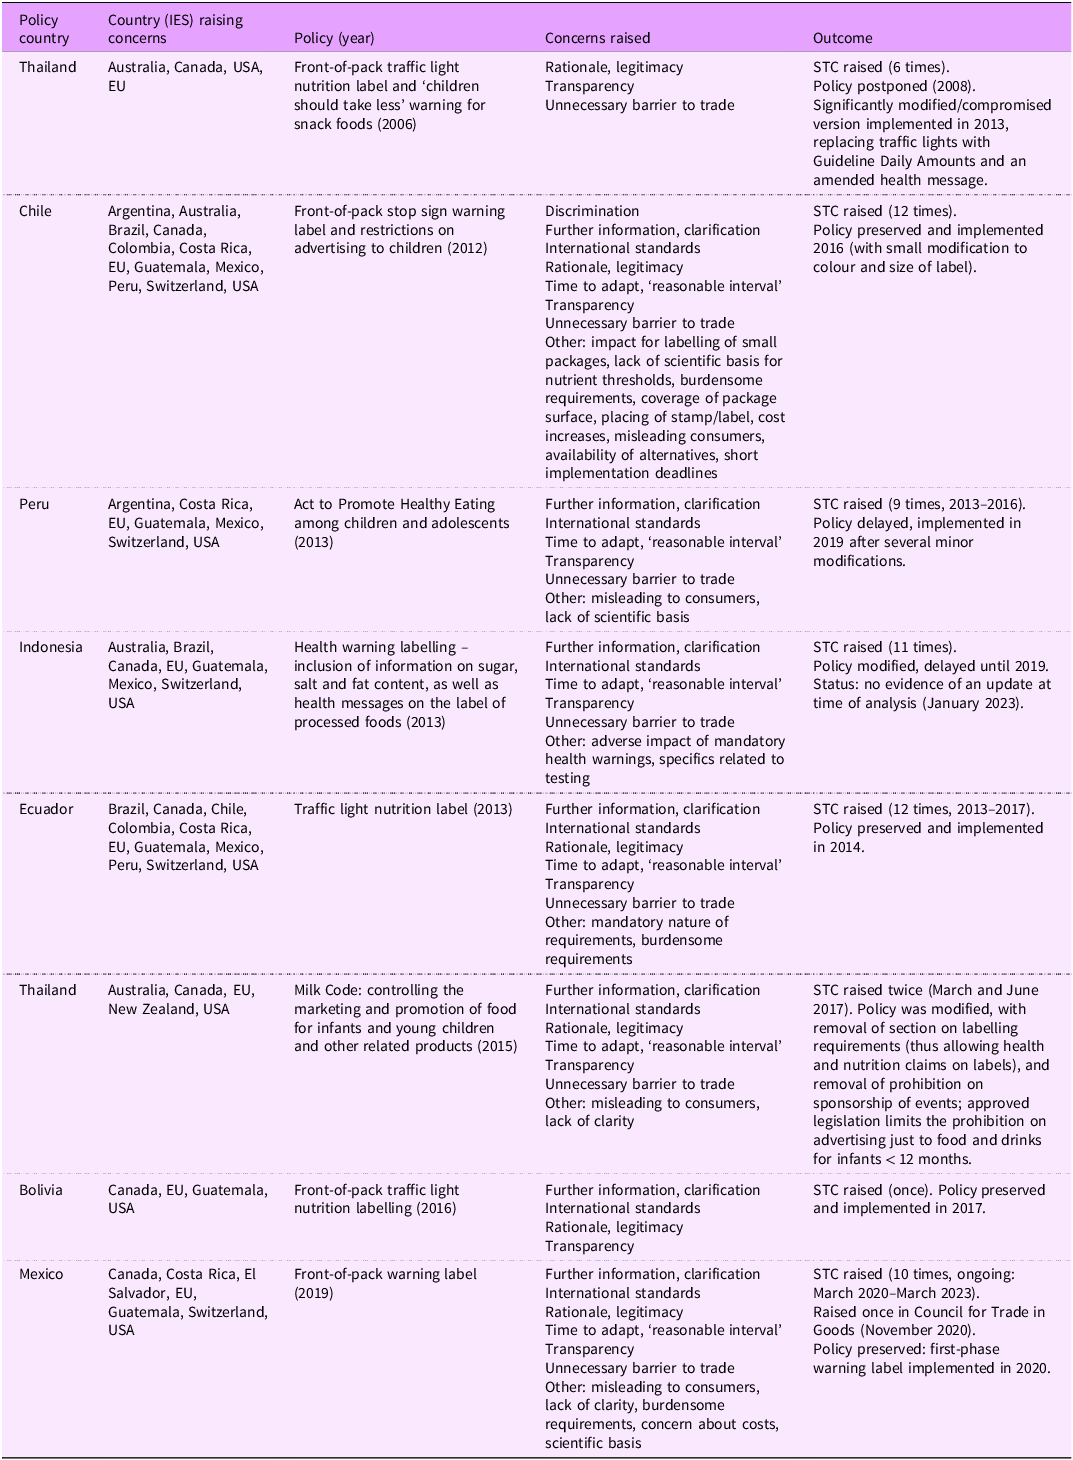
However, Canada did raise a series of STC regarding healthy food environment-related policies through the WTO TBT committee, all of which were related to nutrition labelling, and all STC raised by Canada were also raised by the USA, a significant trade partner (Table 5). Apart from Thailand and Indonesia, all respondent countries (i.e. the country whose policy was raising concerns) were in the Americas. STC were raised across a broad array of issues, the most frequent of which were (1) WTO obligations to implement the least trade restrictive measures, prompting countries to consider less trade restrictive alternative regulatory measures; (2) WTO obligations regarding the scientific evidence for regulatory measures, prompting countries to provide additional information on how determinations, such as acceptable limits or applicable products, were made; and (3) WTO obligations regarding process and transparency, citing that countries had not properly notified the new measures or were providing inadequate time to respond or implement regulatory changes. Of the eight different country policies that Canada raised STC about, one policy in Indonesia was abandoned, two policies in Thailand were modified in ways that were considered to comprise the health benefits (i.e. elements designed to have an effect on public health were downgraded or eliminated from the regulation) and two policies in Chile and Peru were delayed in their implementation, by 4 and 6 years, respectively. Three of the policies subject to STC raised by Canada (in Ecuador, Bolivia and Mexico) were preserved and not significantly delayed.
Summary of trade and investment disputes and concerns over food environment policies where Canada was involved (1995–2024)

STC, specific trade concern.
Discussion
TIA represent a critical commercial determinant of health fundamentally reconfiguring national and global food systems through complex mechanisms of market integration, regulatory harmonisation and corporate influence. This study provides a comprehensive monitoring account of indicators of trade and investment in Canada’s food environment utilising the INFORMAS monitoring framework. By systematically reporting tariff rates and import and export volumes across varying levels of food processing alongside indicators of foreign direct investment volumes and concerns raised against regulatory reforms related to food in trade forums, we advance nuanced understanding of the myriad ways in which global trade mechanisms reshape dietary landscapes and nutritional opportunities.
Our findings align with and extend existing literature on the commercial determinants of health, particularly regarding the relationship between trade and food environment transformations. Our results revealed that international trade and investment agreements dismantled barriers to food trade and investment in Canada, irrespective of their nutritional value or processing intensity, and exposed considerable consistency in trade volume growth across varying processing levels, challenging the viability of simplistic narratives about trade and nutrition.
This appears to support and contextualise some of the diverse findings in the trade and investment and food environment literature. That is, while these agreements support trade across all food categories – and in Canada seemingly without prejudice towards UPF products as evidenced through tariff rates over time – as trade and investment eases the cross-border flow of food and food investment broadly, larger producers of UPF may be better able to take advantage of these opportunities. In turn, this may be driving the demonstrated spikes in specific products (e.g. processed dairy products and ready-to-eat-meals) that have a higher value-add for food companies and are more amenable to the hazards and timelines of international transport and global marketing. Alternatively, it could be suggested that in failing to discriminate between minimally processed food and UPF, TIA have potentially undermined efforts to promote healthier dietary patterns. This particular observation resonates with previous research that has highlighted how trade policies can inadvertently facilitate the global spread of nutritionally limited food products(Reference Stuckler, McKee and Ebrahim25,Reference Baker, Machado and Santos41) .
Consistently high levels of FDI into Canada’s food manufacturing sector warrants critical examination and more precise data to infer nutritional impacts. Food manufacturing is an economically and politically significant sector in Canada. Valued at CAD 156·5 billion, it accounts for 18·2 % of total manufacturing sales and is the single largest manufacturing sector and employer, providing employment for over 300 000 Canadians(42). The manufacturing sector produces products of varying levels of processing, ranging from Group 2 (processed culinary ingredients) to Group 4 (UPF), and sales data is reported by food category (e.g. bakeries, meat) rather than processing level, making additional interpretations here difficult. Sugar and confectionary product manufacturing, which is reported individually and likely would be all Group 4, allows some inferences. Specifically, this segment of the sector was valued at CAD 5·2 billion in 2022 – representing only 3 % of all food and beverage processing, suggesting a rather minor overall contribution, though it did grow from CAD 4·1 billion in 2018(43).
Research suggests that transnational food corporations strategically leverage trade agreements to consolidate market positions and optimise investment strategies, reflecting a broader trend of corporate consolidation within global food systems, where a diminishing number of powerful actors increasingly control more extensive segments of food production, processing and distribution networks(Reference Clapp5). In Canada, most segments of the food processing sector have exceeded the CR4 40 ratio – where four firms control at least 40 % of a market, including dairy products, grain and oilseed milling, sugar and confectionary, meat, and fruit and vegetable processing. The highest concentration ratios are found in soup (81 %), ice cream and frozen desserts (77 %) and breakfast cereals (77 %) manufacturing(Reference Gaucher-Holm, Wood and Sacks44) – providing some insights into concentration in UPF manufacturing in Canada.
Our findings demonstrate that Canada has been involved, as one country in a group of countries, in raising informal trade challenges related to nutritional policies. While direct evidence of regulatory chill remains methodologically challenging to document(Reference Van Harten and Scott45,Reference Schram, Friel and Anthony VanDuzer46) , there is growing recognition that the mere threat of trade or investment disputes can influence policy development processes. This influence manifests both directly, through the resource-intensive requirements of defending innovative measures in international forums, and indirectly, through the anticipatory dampening of policy ambition(Reference Schram, Friel and Anthony VanDuzer46). Lower-income countries may be particularly vulnerable to these effects, as the substantial costs of defending policies in international dispute settlement mechanisms can strain limited government resources and technical capacity(Reference Thow, Jones and Hawkes47). Canada’s involvement with USA, New Zealand, Australia and the EU in challenging Thailand’s implementation of the Milk Code, designed based on WHO Code on Marketing of Breastmilk substitutes, which ultimately resulted in delays and dilution of this policy is a clear example of a strong and consolidated industry, in this case dairy products, exerting influence through TIA measures. The broad interpretation of investor protections in recent disputes has arguably expanded the scope of potentially challengeable public health measures, creating uncertainty for policymakers considering novel regulatory approaches(Reference Friel, Schram and Townsend7). However, this challenging landscape also highlights the crucial role of academic research in supporting evidence-based policymaking that can achieve public health objectives while maintaining compliance with international obligations. Scholars can contribute by documenting successful policy approaches that have withstood legal scrutiny and providing technical assistance to countries navigating these complex regulatory spaces.
While TIA create structural opportunities in food environments, domestic policy environments and consumer markets further influence these patterns. Alternative explanations for the observed changes in food imports, exports and FDI present a rich tapestry of interconnected factors extending far beyond trade policy. Technological innovations have fundamentally transformed food production and distribution landscapes, enabling more complex global supply chains. Advanced refrigeration technologies, biotechnological innovations and sophisticated logistics systems have collectively reduced barriers to global food trade. Simultaneously, evolving consumer preferences – driven by urbanisation, changing work patterns and increasing global cultural interconnectedness – have created unprecedented demand for convenient, processed food products. Moreover, domestic agricultural policies have equally played a crucial role in shaping these transformations. Canada’s unique agricultural policy landscape, characterised by supply management systems in sectors like dairy products and eggs, has created distinctive dynamics within the broader global trade environment. These policy mechanisms have simultaneously protected domestic producers while creating intricate negotiation spaces within international trade agreements and other trade forums.
Traditional approaches to understanding food environments have often been siloed, separating trade and agricultural policy, nutritional science and public health into discrete domains. Our research demonstrates the critical need for integrated, interdisciplinary monitoring approaches that can capture complex interactions between these fields and increasingly sophisticated mechanisms required to dynamically assess and respond to the nutritional complexity of food products. The latter might involve developing multivariate classification systems that extend beyond current frameworks like NOVA, incorporating comprehensive metrics that capture nutritional content, processing complexity, environmental sustainability and potential health impacts. The temporal nature of the analysis also reveals the importance of critical periods, particularly surrounding Canada’s integration into major international trade frameworks like the WTO and subsequent bilateral and multilateral agreements. Such moments of institutional transformation represent opportunities for fundamental reconfigurations of food systems governance, with far-reaching implications for population nutrition, and should be observed closely when they occur.
This study, focused on monitoring rather than evaluation, faced several data constraints, including missing HS codes and other limitations. While we can observe that Canada’s international trade and investment commitments appear to shape the food environment, we cannot, through our current methodological approach, establish causality or precisely measure how specific agreement provisions affect nutrition quality and food environment health. Moreover, the NOVA system employed here has been critiqued for a lack of precision in defining the boundaries between processing levels and for its emphasis on the level of processing, which does not always correlate with the calculated nutritional value of the food (e.g. higher levels of processing with lower nutritional values or lower levels of processing with higher nutritional values), thus potentially stigmatising all processed foods – even those with some health benefits(Reference Petrus, do Amaral Sobral and Tadini48,Reference Braesco, Souchon and Sauvant49) . That said, NOVA is frequently used to explore relationships among the consumption of highly processed foods and diet quality or health outcomes, being used in 95 % of studies between 2015 and 2019 in a recent systematic review(Reference Chen, Zhang and Yang38). Specifically, NOVA classification is highly applicable for the study of trade and investment and food environment relationships where detailed nutrient information is unavailable and HS codes are, in fact, generated in relation to processing level to derive taxation based on value-added modifications of agricultural inputs.
Conclusions
The influence of TIA on population nutrition is inherently complex, operating through multiple interconnected pathways mediated by a range of domestic socio-economic factors. Consequently, empirical assessments of trade’s nutritional impacts face significant methodological challenges, as these outcomes emerge from intricate, context-specific interactions rather than direct, universal causalities. The key insight from the literature is that trade and investment are neither inherently beneficial nor detrimental to health and nutrition. Instead, they represent dynamic systems that create specific conditions for nutritional outcomes. Our results reflect that the trade and investment mechanisms we observed were largely neutral by design for nutrition, and population nutrition outcomes were likely steered to a greater extent by food industry interests. Future research should continue to develop and refine monitoring frameworks, integrating insights from nutritional science, policy analysis, political economic theory and public health. Only through such comprehensive, interdisciplinary approaches can we hope to effectively navigate and potentially reshape the complex landscape of global food system transformations.
Acknowledgements
The authors would like to extend their thanks to Ms Sharni Goldman for her assistance in preparing the data for this analysis.
Financial support
This work was supported by a Canadian Institutes for Health Research Project Grant (PJT #173367). CIHR had no role in the design, analysis or writing of this article. L.V. is supported by funding from the Canada Research Chairs programme.
Competing interests
There are no conflicts of interest.
Authorship
A.S., K.G., C.V. and L.V. contributed to the research design; AS and KG collected and analysed the data; A.S. wrote the first draft; A.S., K.G., C.V. and L.V. edited and finalised the manuscript.
Ethics of human subject participation
No ethics required.


 Open access