


An unhealthy diet is recognised as being among the main modifiable risk factors for the major non-communicable diseases globally( Reference Ezzati and Riboli 1 , 2 ), thus measuring and targeting diet, is important. However, as no objective biomarkers of total diet yet exist( Reference Kuhnle 3 ), dietary assessments cannot avoid using some form of self-reported data. The limitations of self-reported data should not be downplayed, and well-conducted validation studies are therefore extremely important, to quantify how much the estimated dietary intake deviates from the unknown true intake.
Among the existing dietary self-report assessment methods, the FFQ and the 24-h recall (24HR) are much used and validated tools; however, the FFQ is especially found to have considerable limitations( Reference Dhurandhar, Schoeller and Brown 4 , Reference Subar, Freedman and Tooze 5 ). The FFQ is nonetheless popular, particularly in large epidemiological studies, because it is designed to capture the habitual dietary intake, and it can be applied in large numbers of individuals, at a relatively low cost( 6 , 7 ). In comparison, the 24HR has proven superior to the FFQ in terms of accuracy( Reference Freedman, Commins and Moler 8 ), but repeated recalls are needed when assessing the distribution of intakes in a group, or individual intakes( 6 , 7 ).
New technology has been proposed as a way to reduce the challenges associated with the self-report dietary assessment methods; shifting from paper-based FFQ with limiting printed formats, to web-based FFQ with possible skip-algorithms and images for improved portion size estimates( Reference Kristal, Peters and Potter 9 ). Web and computer formats permit inherent error checks, avoiding incomplete recordings and inconsistency, and add additional value in reducing the burden of data handling( Reference Illner, Freisling and Boeing 10 , Reference Falomir, Arregui and Madueno 11 ).
A web- and image-based self-administered FFQ (WebFFQ), has been recently developed at the University of Oslo, to replace the much used paper-based FFQ( Reference Andersen, Solvoll and Johansson 12 ). As any new tool, the WebFFQ needs to be validated to reveal how it performs, and to clarify how data from the WebFFQ can be used and interpreted in future studies.
The main aim of this study was to assess the validity of estimated intakes from the WebFFQ, using two different reference methods; an absolute validation of energy intakes (EI) using doubly labelled water (DLW), and a relative validation of macronutrients and food groups using repeated non-consecutive 24HR. A supplementary aim was to assess the validity of EI estimated from the second reference method (24HR) using DLW.
Methods
Design
A total of ninety-two participants were recruited over two rounds. Group 1, consisting of women only, was recruited in November 2015, and the data collection was conducted from January to June 2016. Group 2, consisting of both women and men, was recruited and data collected, in the period from March to December 2016.
Both written and verbal information regarding the study was provided to all participants. All participants were instructed to fill out the WebFFQ, covering their habitual dietary intake, over the last 12 months. Subsequently, four non-consecutive 24HR were collected for all participants by trained nutritionists, using telephone interviews. In addition, the participants in group 1 had their total energy expenditure (TEE) assessed by the DLW method.
Ethical statement
This study was conducted according to the guidelines laid down in the Declaration of Helsinki and all procedures involving human subjects were approved by the Data Protection Official for Research in Norway (NSD), project nos: 44876 and 45712. Written informed consent was obtained from all participants. No economical compensation or incentives were given to the participants.
Recruitment
An overview of the recruitment process is shown in Fig. 1. Group 1 was recruited using Facebook, posters and word of mouth. During a period of 2 weeks, fifty-eight women volunteered to participate, of which forty-two fulfilled the inclusion criteria. Out of these women, thirty-two with the least similar traits, defined by age, self-reported body weight and height, self-reported physical activity level and area where they lived, were included in the study. This was done to increase variability in the sample, and to include only the number of individuals needed, based on sample size calculations. Before the commencement of the study, one participant withdrew and was replaced by one of the ten formerly omitted individuals, who fulfilled inclusion criteria. All thirty-two completed all parts of the study.
Flow chart showing the recruitment process in a Norwegian validation study of a web-based FFQ (WebFFQ). 24HR, 24-h recalls; DLW, doubly labelled water.
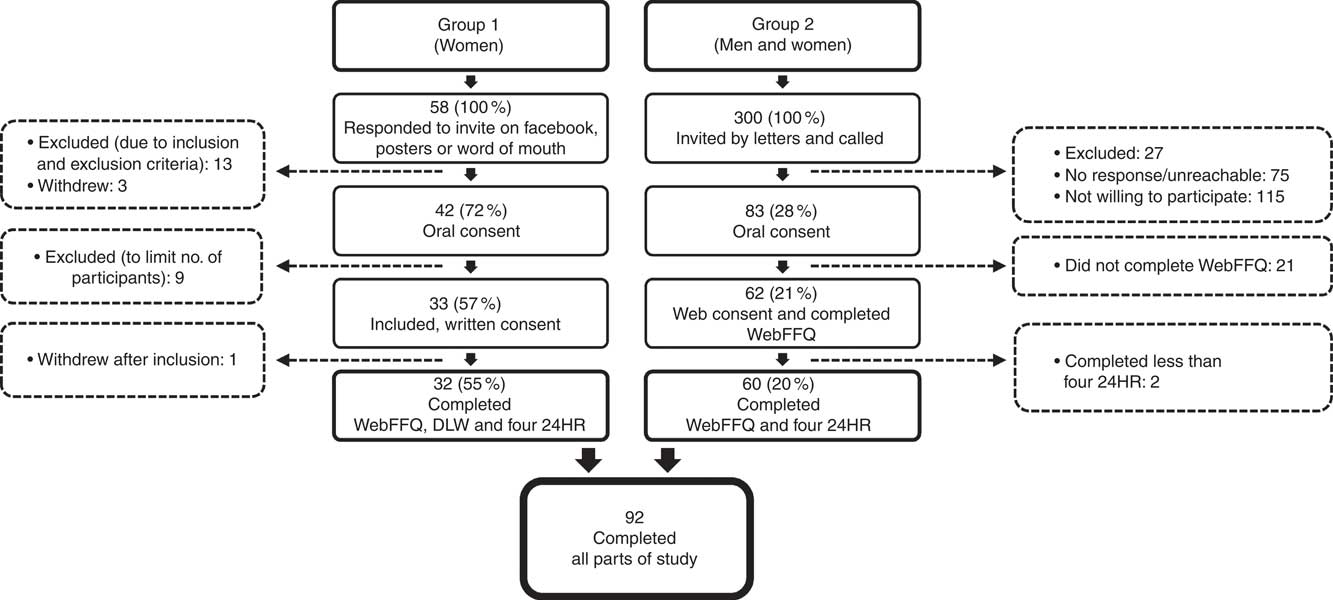
Group 2 was recruited from a random selection of the Norwegian population aged between 18–70 years. The sample was drawn by the Norwegian Tax Administration. A total of 300 received invitations, out of which 200 were a random mix of both sexes and 100 were a random selection of men. More men than women were invited in group 2, to equalise the sex ratio in the entire sample. Potential participants were sent a written invite, followed up by a phone call within 1 to 2 weeks. Text messages or voice-mail were used if no contact was established, and if needed a new phone call was made again after a few days.
Inclusion and exclusion criteria
Stricter criteria were used for group 1 than for group 2, as the DLW method was used only in group 1. However, all had to be between the age 18–70 years, born in Scandinavia, and have access to a computer and internet. Any present or former students in nutrition or sports nutrition were excluded.
In addition, those included in group 1 had to be healthy, female, have a BMI 18·5–35 kg/m2 and a domestic freezer in their home (for sample storage), and live within Oslo or surrounding areas to fulfil the inclusion criteria. Women who were pregnant, breast-feeding or had given birth during the last 10 months were excluded. Furthermore, women with self-reported weight fluctuations>2·5 kg over the last 3 month period, women planning to increase or lose weight, and professional athletes were also excluded.
The web-based FFQ
The WebFFQ was developed by researchers from the Department of Nutrition and staff at the University Center for Information Technology, both at the University of Oslo, based on the experience from former paper-based FFQ( Reference Nes, Frost Andersen and Solvoll 13 , Reference Carlsen, Karlsen and Lillegaard 14 ).
The WebFFQ is designed as a web-based, self-administered FFQ, assessing the habitual intake for an individual, asking about their diet over the past 12 months. Access is provided by a direct link sent to each participant’s email. It contains 279 foods or beverages, with images illustrating different portions sizes to help the portion size estimation. Skip-algorithms are used to reduce the burden on the participants; that is, entire food main categories (i.e. cereals) are bypassed if the participant indicates that such foods are never consumed. Inherent error checks are used to minimise unintentional oversights: the participant cannot proceed without ticking off the boxes for each question on each page. Questions on background variables (i.e. age and educational level) are at the very end of the FFQ. The data collected in the WebFFQ on frequency of consumption and portion sizes were converted into g/d, using standard procedures( 15 ), before it was imported into the food and nutrient composition database and calculation system KBS (KBS, version 7.3, database AE14; University of Oslo), to allow calculations of energy, nutrients and food groups. Calculations of EI were done using standard procedures (SI units) for the energy providing nutrients( 16 ).
Doubly labelled water
TEE was measured using the DLW technique( Reference Lifson and McClintock 17 ), in all participants in group 1, for comparison with estimates of EI from the WebFFQ. This method has been previously validated on multiple occasions by comparison with simultaneous indirect calorimetry in humans( Reference Speakman 18 ).
After completing the WebFFQ, participants were individually paid a total of three home visits. During the first visit, they were provided with equipment for sampling and storage of urine samples. Visit two included collection of a baseline (pre-dose) urine sample, to estimate background isotope enrichment and assessment of height and weight, before dosing with DLW. A multi-sample protocol over a period of 2 weeks was used. The DLW doses with mixed isotopes were prepared individually, based on participants self-reported body weight, by technical staff from the Energetics group, University of Aberdeen, Scotland, UK. The isotopes, 18O and 2H, were purchased from Sercon. The calculated enrichment of the mixed DLW was 109 203·1 parts per million (ppm) 18O and 47 193·7 ppm 2H and the dose was 1·2 ml/kg body mass. Dosing was done in the mornings, from a sealed cup, in the fasting state. Two post-dose urine samples were collected by the participants the same day to obtain the initial isotope enrichments: one approximately 3–4 h after dosing, and subsequently another in the evening. Further urine samples (evening void) were collected every other day until day 14. Precise times of all samples were recorded. All urine samples were kept frozen in the participants’ domestic freezers until the third home visit, during which samples were collected and subsequently brought to the laboratory at the Department of Nutrition, University of Oslo. Weight of the participants was also measured at the third home visit, to assess weight stability during the sampling period.
Urine samples were thawed, well mixed and pipetted from the urine specimen containers into cryotubes, which were kept at −80°C, until shipped on dry ice from Oslo, Norway to, Aberdeen, Scotland, UK, where they were kept frozen until analysis. Blinded analysis of the isotopic enrichment of urine was performed, using a Liquid Isotope Water Analyser (Los Gatos Research)( Reference Berman, Fortson and Snaith 19 ). First, the urine was vacuum distilled( Reference Nagy 20 ), and the produced distillate was used for analysis. Samples were run alongside five lab standards for each isotope and International standards (GISP, SMOW and SLAP) to correct for day-to-day variation, and the data were converted from delta values to ppm. For each sample, fifteen replicates were analysed. The average within day error in 2H replicates after stability had been reached was 0·05 ppm and for 18O was 0·12 ppm. The average between day error in 2H was 0·08 ppm and for 18O was 0·87 ppm. The mean isotope enrichments in each sample, after accounting for background levels, were loge transformed and the elimination constants (k o and k d) were calculated by fitting a least squares regression model to the loge transformed data. To calculate the isotope dilution spaces (N o and N d), the back extrapolated intercept was used. A two-pool model, using Schoeller et al.’s equation A6( Reference Schoeller, Ravussin and Schutz 21 ), in its modified form( Reference Schoeller 22 ) was used to calculate rates of CO2 production as recommended for humans by Speakman( Reference Speakman, Nair and Goran 23 ) using an assumed food quotient of 0·85( Reference Black, Prentice and Coward 24 ).
The interviewer-assisted computer-based 24-h multi-pass recall module
Intake data from 24HR were used as a relative reference method to the WebFFQ. An interviewer-assisted and computer-based 24-h multi-pass recall module, integrated and directly connected to the nutrition composition database KBS (KBS, version 7.3, database AE14) was used, as described elsewhere( Reference Myhre, Loken and Wandel 25 ). In short, the 24HR-module is used in a three-step sequence; first, the interviewee freely describes what was consumed the previous day; second the interviewer repeats all items that are reported, chronologically, and adds questions about portion sizes, plausible overlooked extra items (i.e. milk, if cereals are reported without milk), and possibly omitted eating occasions; finally, the interviewer prompts for commonly forgotten items, including supplements. All participants in the current study had access to a booklet with images of different portion sizes, in paper format or electronically as a PDF file.
Three trained interviewers, all with 5 years of formal nutrition educational background, conducted the interviews by telephone. Four non-consecutive 24HR were completed for each participant. One out of the 4 d had to be a Friday, Saturday or Sunday, as people tend to eat differently on these days compared with the rest of the week( Reference McCarthy 26 ). To avoid reactivity, interviews were predominantly not pre scheduled (93 %); that is, the participants did not know in advance which days they were to be interviewed.
Anthropometrics
All participants self-reported weight and height in the WebFFQ.
In addition, participants in group 1 had their weight and height measured in their home during home visits. Height was measured once using a portable stadiometer (Seca 213; Seca GmbH & Co. KG.) to the nearest mm. Weight was measured twice on a digital scale (TANITA TBF-300; Tanita Corporation) to the nearest 0·1 kg; first at the day of dosing, and second, the day after the last urine sample was sampled. Both weight measurements were done in the morning, in the fasting state, after emptying the bladder. Only underwear or very light clothing was allowed during weighing.
Other information
Questions regarding educational level, smoking habits and birth date were included in the WebFFQ. Also, information regarding physical activity level was provided by group 1 participants over the phone, at the time of evaluation of possible inclusion in the study.
Statistical analyses
Descriptive statistics were computed for the total study sample, and by participant group and sex, given as means and standard deviations or as percentage. χ 2 and Mann–Whitney tests were used to compare groups. Paired-sample t tests were used to compare measured weight at baseline and the second weighing, and measured weight at baseline to self-reported weight, in group 1.
The absolute validity of estimated EI from the WebFFQ (EIFFQ), and for the mean of four 24HR (EI24HR), was assessed for group 1 (n 29), using TEE from DLW (TEEDLW) as the reference method. Mean and sd of EIFFQ, EI24HR and TEEDLW were computed, in addition to ratios between their means. Further comparisons of means were done using paired-sample t tests, after loge transformations, due to skewed data.
Crude Pearson’s correlations were calculated between EIFFQ and TEEDLW, and between EI24HR and TEEDLW, using loge transformed data, to deal with the non-normally distributed data. To take into account the within-person variation in EI in the 24HR data, we calculated the deattenuated Pearson’s correlation coefficient r d using the formula from Beaton et al.( Reference Beaton, Milner and Corey 27 ), using data on EI for each recording day, for each individual. Scatterplots were also created for EIFFQ and TEEDLW, and EI24HR and TEEDLW, respectively.
A Bland–Altman plot was created for the difference between EIFFQ and the TEEDLW, and the mean of the two.
To identify acceptable reporters (AR) of EI, we calculated the ratio of EIFFQ:TEEDLW. A perfect agreement between the methods would give EIFFQ:TEEDLW=1. Due to the skewness in EI data, the ratio was subsequently loge transformed. AR were defined as subjects within the range of the 95 % confidence limits of agreement (95 % CI) for EIFFQ:TEEDLW, calculated in accordance with Black( Reference Black 28 ), on the loge ratio scale. Because the WebFFQ refers to habitual intake, the number of assessment days can be taken as infinite; the CV for EIFFQ was therefore set to 0, whereas the CV for TEEDLW was set to 8·2 %( Reference Black and Cole 29 ), giving a 95 % CI ±16 % for the loge transformed EIFFQ:TEEDLW. Individuals who were defined to be within these CL were defined as AR.
Quartiles for EIFFQ, EI24HR and TEEDLW were created, and the WebFFQ’s and 24HRs’ ability to correctly classify their respectively estimated EI compared with TEEDLW were assessed.
A relative validation was conducted for the entire sample (n 92), assessing macronutrients and food groups. Median intakes and 25 and 75 percentiles were calculated. Absolute intakes are presented in g/d. Simple energy adjustments were done by calculating energy percentage (E%) for macronutrients, and intakes per 10 MJ for fibre and all food groups. Wilcoxon’s signed-rank test for related samples, was used to test for differences in median intakes between the WebFFQ and the 24HR. The ratio of the WebFFQ to the 24HR, using median intakes, was also calculated. Crude Pearson’s correlations were calculated for nutrients and food groups between the WebFFQ and the mean of four 24HR using loge transformed data. The formula from Beaton et al. ( Reference Beaton, Milner and Corey 27 ) was used to calculate deattenuated Pearson’s correlation coefficient r d. The WebFFQ’s ability to correctly classify nutrient or food intake of individuals compared with dietary intake data from the 24HR was assessed. Quartiles were created using estimated intakes from the WebFFQ and 24HR data for nutrients and food groups using both absolute intakes and energy adjusted intakes. Proportions of individuals classified into the same, adjacent and extreme opposite quartile were calculated. Finally, the absolute difference between EIFFQ and TEEDLW was plotted against the difference in grams between the WebFFQ and 24HR, for the food groups having a significantly different absolute estimated intake between the two methods. Pearson’s correlation coefficients were subsequently calculated for the respective variables in these plots, except for skewed variables in which Spearman’s non-parametric alternative was used.
All data analyses were conducted using IBM SPSS (version 22.0, 2013; IBM Corp.) and MS Excel (version 2010; Microsoft).
Power calculations
For the DLW analyses, in which only the participants in group 1 were included, sample size was calculated based on the ability to identify AR of energy. AR were defined as individuals within the 95 % CI for EIFFQ:TEEDLW, described previously. Thus, a difference of 16 % between reported EI and TEEDLW needed to be detectable. Using the equation from Cole( Reference Cole 30 ), based on an expected mean EI of 8·0 (sd 2·4) MJ sourced from the latest nationwide Norwegian dietary survey( 31 ), a power of 80 and a 5 % significance level, a total of twenty-seven participants were needed. To account for expected dropouts and invalid samples, thirty-two participants were recruited.
For the relative validation analyses, all participants from both group 1 and group 2 were included. Data from ninety-two participants was available. For a sample this size, a significance level of 5 and 80 % power, it would be possible to detect a correlation of minimum 0·26( 32 ).
Results
Characteristics of participants
Characteristics of the study sample are presented in Table 1. Out of the ninety-two participants, 37·0 % were male, 68·5 % had higher education and 10·9 % were smokers. Mean age was 44·4 years, and mean BMI was 24·5 kg/m2. Participants, in group 1 (all women), were different than group 2, having a 1·0 kg/m2 lower average BMI (P=0·04), a higher educational level (P=0·02), in addition to being 9 years younger on average (P<0·001). During the sampling period, we observed a non-significant mean weight change of 0·1 kg between baseline and the second weighing (P=0·72), implying that group 1 was weight stable. In addition, no significant difference was observed between the mean self-reported and measured weight in group 1 (P=0·98).
Descriptive statistics of the participants in a validation study of a web-based FFQ in Norway (n 92) (Mean values and standard deviations; percentages)

*Characteristic statistically significantly different across groups. Significance level is 0·05.
†Characteristic statistically significantly different across sex. Significance level is 0·05.
‡ Completed a minimum of 3 years at University or University College.
§ Initial weight (visit 1), group 1, twenty-nine, participants included in the doubly labelled water analyses only.
|| Between visit 1 and visit 3, group 1, twenty-nine, participants included in the doubly labelled water analyses only.
¶ Based on initial weight and height (measured at visit 1), group 1, twenty-nine, participants included in the doubly labelled water analyses only.
Absolute validity of estimated energy intake
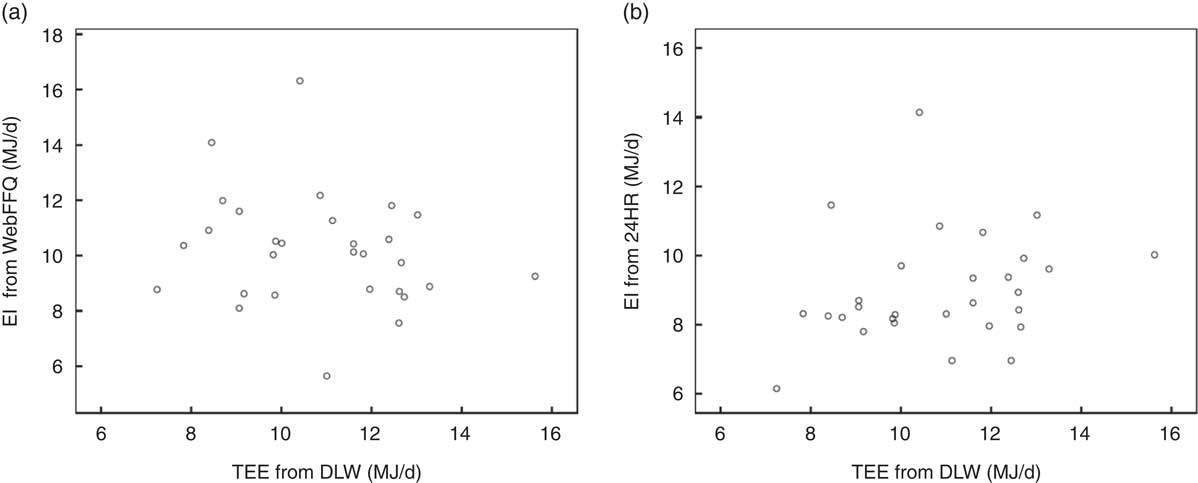
Out of the thirty-two participants in group 1, three had non-valid samples and were consequently excluded, leaving twenty-nine to be included in the statistical analyses. The ratio of the elimination constants k o:k d was 1·25 (sd 0·001) and the dilution space ratio N d:N o was 1·05 (sd 0·004). On average across all individuals, the EIFFQ was 0·7 MJ (6 %) lower, but not significantly different, than the TEEDLW (P=0·22), on group level (Table 2). In comparison, on average the EI24HR was underestimated significantly with 1·9 MJ (17 %) compared with the TEEDLW (P<0·001). Pearson’s correlation between EIFFQ and TEEDLW showed no significant linear relationship (r −0·18), see Fig. 2(a). The deattuenuated Pearson’s correlation observed between TEEDLW and the EI24HR was stronger (r 0·34), see Fig. 2(b).
Plots showing (a) the energy intake (EI) from a web-based FFQ (WebFFQ) plotted against the total energy expenditure (TEE) from doubly labelled water (DLW) and (b) the mean EI from multiple 24-h recalls (24HR) plotted against the TEE from DLW (n 29).
Comparisons of energy estimates between the web-based FFQ (WebFFQ) and the mean of four 24-h recalls (24HR) and total energy expenditure (TEE) measured by doubly labelled water (DLW) (n 29) (Mean values and standard deviations)
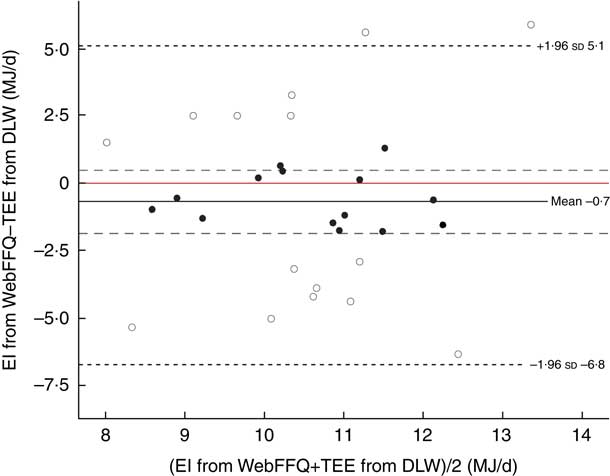
The Bland–Altman plot in Fig. 3 displays difference between energy estimates from the WebFFQ and the DLW method, against the average of the measurements of each individual in group 1. Over-reporting and under-reporting of EI is spread widely but evenly out, resulting in the small mean difference between the methods. The plot reveals that the individual EIFFQ deviate largely from the individual TEEDLW and only fourteen out of twenty-nine individuals were identified as AR of EI (Fig. 3).
Bland–Altman plot showing the difference between energy intake (EI) from a web-based FFQ (WebFFQ) and total energy expenditure (TEE) from doubly labelled water (DLW) plotted against the average of the two methods. ![]() , Individuals identified as acceptable reporters of EI;
, Individuals identified as acceptable reporters of EI; ![]() , 95 % CI for the mean difference.
, 95 % CI for the mean difference.
Cross-classification between quartiles of EIFFQ and TEEDLW showed that 52 % of the participants were classified in the same or adjacent quartile, and 21 % were grossly misclassified (opposite quartiles). In comparison, for EI24HR and TEEDLW, the proportion of individuals classified in the same or adjacent quartiles, v. the grossly misclassified were 66 and 7 %, respectively.
Relative validity of macronutrients and food groups
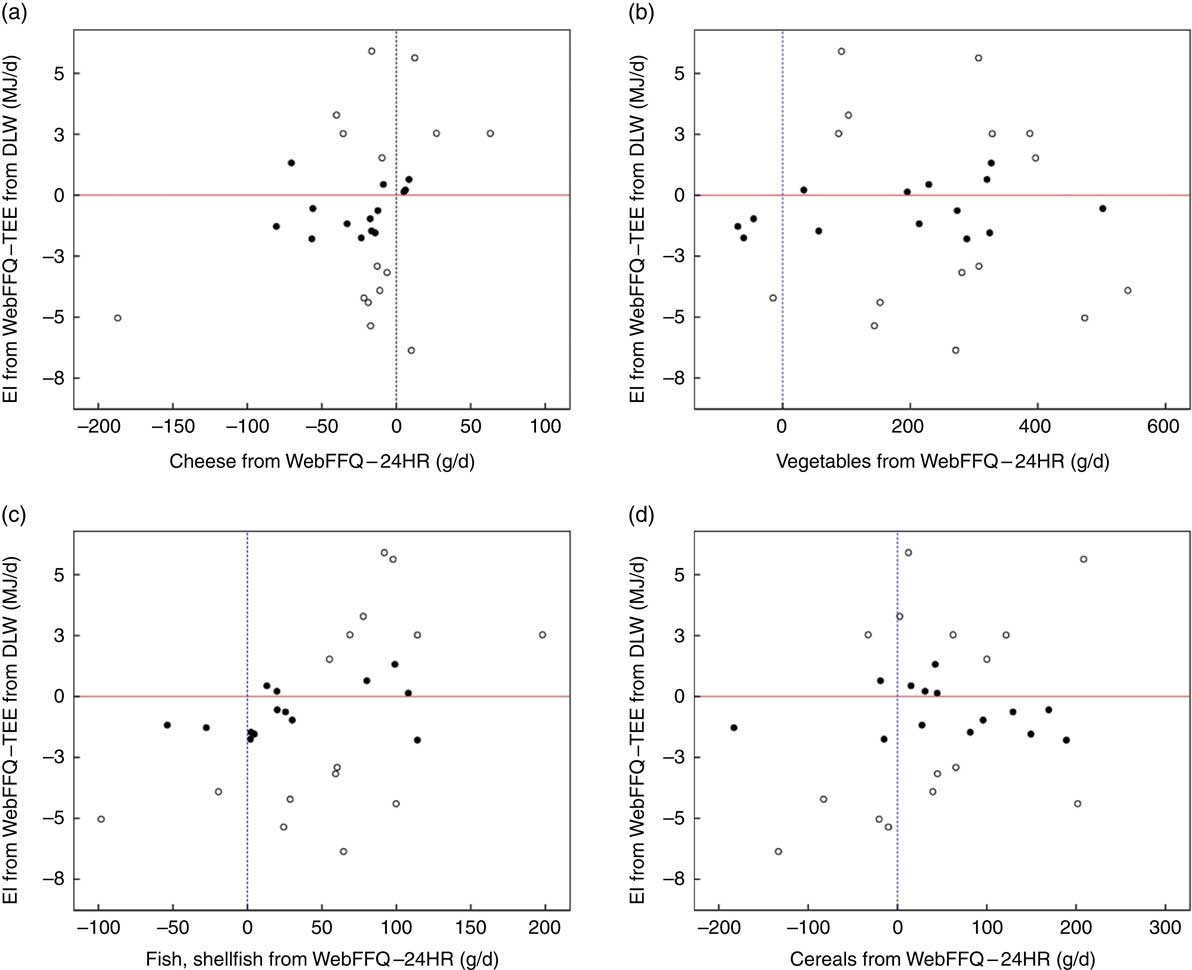
The relative validity for the energy providing nutrients, including alcohol and fibre, and several food groups, is presented as absolute intakes (Table 3) and energy adjusted intakes (Table 4). The absolute estimated intakes (g/d) from the WebFFQ, were significantly overestimated compared with the 24HR, for 68 % of the variables. ‘Cheese’ was the only significantly underestimated variable. ‘Alcohol’ had the least discrepancy between the two methods, and the largest overestimations by the WebFFQ were observed for ‘vegetables’ and ‘fish and shellfish’, followed by ‘cereals’, ‘fibre’ and ‘butter, margarine, oil’. Less overestimation was observed for energy adjusted intakes, for which 32 % of the variables were significantly overestimated, 53 % were not significantly different, and ‘cheese’ and ‘cakes’ were the only underestimated variables, by the WebFFQ relative to the 24HR. The under- and over-reporting of absolute estimated intakes of food groups by the WebFFQ relative to the 24HR, were mostly spread out between the over- or under-reporters of energy: No significant correlations between energy deviations and these food deviations were observed except for ‘fish and shellfish’, in which a significant positive correlation (r 0·48) was found. See Fig. 4 (a–d) for selected plots showing: ‘cheese’, ‘vegetables’, ‘fish and shellfish’ and ‘cereals’. Similar patterns were observed for the other food groups.
Absolute intakes from a web-based FFQ (WebFFQ) and the mean of four non-consecutive 24-h recalls (24HR), cross-classification of quartiles and observed and deattenuated Pearson’s correlation coefficients (r p) between the WebFFQ and 4×24HR in a Norwegian validation study among adults (n 92) (Medians and 25th and 75th percentiles (P25–P75))

* Statistically significantly different from reported WebFFQ intakes. Significance level is 0·05.
† Crude Pearson’s correlation coefficient based on log-transformed data.
‡ Deattenuated Pearson’s correlation coefficient based on log-transformed data.
Energy adjusted intakes from a web-based FFQ (WebFFQ) and the mean of four non-consecutive 24-h recalls (24HR), cross-classification of quartiles and observed and deattenuated Pearson’s correlation coefficients (r p) between the WebFFQ and 4×24HR in a Norwegian validation study among adults (n 92) (Medians and 25th and 75th percentiles (P25–P75))
* Statistically significantly different from reported WebFFQ intakes. Significance level is 0·05.
† Crude Pearson’s correlation coefficient based on log-transformed data.
‡ Deattenuated Pearson’s correlation coefficient based on log-transformed data.
§ Energy densities in E%.
Plots showing the difference between energy intake (EI) from a web-based FFQ (WebFFQ) and total energy expenditure (TEE) from doubly labelled water (DLW), plotted against the difference of estimated intakes of foods between the WebFFQ and multiple 24-h recalls (24HR). (a) Cheese, (b) vegetables, (c) fish and shellfish and (d) cereals. ![]() , Individuals identified as acceptable reporters of EI;
, Individuals identified as acceptable reporters of EI; ![]() , point of 0 difference between EI from the WebFFQ and TEE from DLW;
, point of 0 difference between EI from the WebFFQ and TEE from DLW; ![]() , point of 0 difference between the WebFFQ and 24-h recalls (24HR) in the estimated food groups.
, point of 0 difference between the WebFFQ and 24-h recalls (24HR) in the estimated food groups.
Crude and deattenuated Pearson’s correlations for absolute intakes varied from 0·19 to 0·69 and 0·22 to 0·89, respectively (Table 3). The strongest correlations were observed for ‘milk, cream, ice cream and yogurt’, ‘juice’ and ‘fruits and berries’, all at 0·80 or more after adjusting for within-person variation. The weakest correlations were observed for ‘fibre’, ‘eggs’, ‘potatoes’ and ‘cakes’, all below 0·40, even for the deattenuated correlations. An improvement in the linear relationship adjusted for within-person variation was observed for 68 % of the variables when shifting from absolute intakes to energy adjusted intakes (Tables 3 and 4); the largest improvements were observed for ‘vegetables’, ‘protein’ and ‘fibre’.
In Table 3, cross-classifications between quartiles of absolute intakes from the WebFFQ and quartiles of absolute intakes from the 24HR are shown. For the majority of the variables no more than 5 % of participants were grossly misclassified. The most correctly classified variables were ‘milk, cream, ice cream and yogurt’ and ‘juice’, whereas the least correctly classified variables were ‘carbohydrates’, ‘fibre’, ‘vegetables’ ‘cakes’ and ‘fish and shellfish’. The cross-classifications were improved when using energy adjusted intakes (Table 4) instead of absolute intakes (Table 3). The variables ‘vegetables’ and ‘fish and shellfish’ had the largest improvement; the percentage of grossly misclassified was reduced from 8 and 7 % to 3 and 2 %, respectively. Consequently, low levels of grossly misclassified participants (0–3 %) were observed for more than 63 % of the energy adjusted variables.
Discussion
Results showed no significant difference between estimated EI from the WebFFQ and the TEE from DLW on group level. However, the WebFFQ’s ranking abilities for EI were unsatisfactory. By contrast, the 24HR showed a significant underestimation of EI at group level, but better ranking abilities for EI. When comparing absolute intakes of macronutrients and food groups from the WebFFQ to the 24HR, we observed a general overestimation of estimated intakes by the WebFFQ on the group level, and Pearson’s correlations in the range of 0·19–0·69. Adjusting for within-person variation improved correlation coefficients, and the use of energy adjusted intakes compared with absolute intakes improved both correlations and cross-classifications for most macronutrients and foods groups.
Absolute validity of estimated energy intake from the web-based FFQ
In a Norwegian validation study of a paper-based FFQ, on which the WebFFQ in our study builds upon, DLW was used in a group of women; EI was under-reported modestly by a mean of 0·96 MJ/day (compared with 0·70 MJ/d reported here), but the Bland–Altman plot showed large differences between the methods at the individual level( Reference Andersen, Tomten and Haggarty 33 ). These results conform to the observations in the present study. Based on this, it looks like the WebFFQ tool is neither superior nor worse in estimating EI than the paper-based FFQ.
Under-reporting of energy in dietary self-reported methods has been reported previously, amongst others in the study of Freedman et al., who pooled results from five large validation studies using recovery biomarkers, including TEE measured by DLW( Reference Freedman, Commins and Moler 8 ). Specifically, for women, Freedman et al., report an average rate of under-reporting of EI of 28 % with FFQ ( Reference Freedman, Commins and Moler 8 ). In comparison, the mean EI was only under-reported by 6 % in our study. This shows that on group level, the WebFFQ seems to perform more superiorly than several other FFQ. However, the group mean is a result of large over- and under-reporting of energy on the individual level that cancelled each other out. The evenly spreading out of over- and under-reporting of energy in the present study may have been influenced by the sampling, as we attempted to increase the variability in age, BMI and physical activity. Moreover, Freedman et al. reported deattenuated correlations for women in the range of 0·11–0·34 between the estimated EI from the FFQ and TEE measured from DLW. Our observations from group 1 are quite similar to these results, showing that our WebFFQ, like several other FFQs, is unsuited for ranking individuals correctly according to reported EI.
Absolute validity of estimated energy intake from the 24-h recalls
For the 24HR, we observed an underestimation of EI of 17 %, compared with the TEE from DLW, which is in line with the under-reporting found for 24HR in other studies among adults in western countries( Reference Thompson and Subar 34 ). Despite a thorough multi-pass approach and the use of images for portion size estimation, some foods or beverages were probably omitted or forgotten, and/or portion sizes were underestimated, which previously have been identified as a source of error( Reference Jonnalagadda, Mitchell and Smiciklas-Wright 35 ). However, Pearson’s deattenuated correlation and cross-classification showed reasonable ranking abilities. This is similar to observations from Freedman et al. who reported deattenuated correlations for women in the range of 0·27–0·42 between the estimated EI from the mean of three 24HR and TEE measured from DLW( Reference Freedman, Commins and Moler 8 ). In our study we do not know what foods or beverages contributed the most to the observed under-reporting of energy in the 24HR estimates, yet it is of importance to take the under-reporting into account when interpreting the results from the relative validation of the WebFFQ, in which the mean of four 24HR was used as the reference.
Relative validity of macronutrients and food groups estimated by the web-based FFQ
A satisfying agreement on group level between the WebFFQ and mean of the four 24HR were observed for the macronutrients for energy adjusted intakes. However, for absolute intakes, the WebFFQ overestimated the intake of all macronutrients significantly, relative to the 24HR, except for alcohol. This trend of overestimation by FFQs compared with multiple 24HR or food records is also observed in a number of other studies( Reference Silva-Jaramillo, Neutzling and Drehmer 36 – Reference Paalanen, Mannisto and Virtanen 39 ), although reports on underestimation are also found( Reference Knudsen, Hatch and Cueto 40 , Reference Christensen, Moller and Bonn 41 ). We speculate that the observed overestimation of absolute intakes of macronutrients by the WebFFQ may partly be artificially overestimated, as a result of the underestimation of energy observed for the 24HR, compared with the DLW data.
The observed ranking abilities of the WebFFQ, relative to the 24HR for macronutrients, are comparable to what have been found in other studies; the observed proportions of grossly misclassified individuals for the E% of protein, fat and alcohol, except for carbohydrates, were slightly lower in our study, compared with a Swedish relative validation study between two web-based FFQs and a 7-d weighed food record( Reference Christensen, Moller and Bonn 41 ). Moreover, the deattenuated energy adjusted correlations for macronutrients found in the present study are also conforming to the Swedish study( Reference Christensen, Moller and Bonn 41 ), a study of an Ecuadorian FFQ compared with 3×24HR( Reference Silva-Jaramillo, Neutzling and Drehmer 36 ), and a study of a Chinese web-based FFQ compared with a 3-d record( Reference Feng, Du and Chen 37 ).
Food groups were also assessed in this validation study, because food groups and food patterns are growingly used as a measure of dietary exposure( 42 ). The WebFFQ overestimated the absolute intake significantly for all food groups, in the range of 3–120 %, except for ‘juice’, ‘cakes’, ‘eggs’, ‘cheese’ and ‘sweets, desserts, sugar’, demonstrating that the agreement on the group level varied substantially. As speculated for the macronutrients, the overestimation observed for food groups may partly reflect a true under-reporting by the reference instrument, rather than, or in addition to, an overestimation by the WebFFQ. Yet, especially for ‘vegetables’ and ‘fish and shellfish’ the reported intakes from the WebFFQ are remarkably large, relative to the 24HR, even for the energy adjusted intakes. Due to the extent of overestimation, we argue that this most likely reflects a true overestimating of these variables, perhaps caused by a social desirability bias.
By combining data from the validation of estimated EI from the WebFFQ using DLW, and the relative validation of the WebFFQ compared with the 24HR, it was possible to demonstrate how misreporting of different food groups was distributed in relation to misreporting of energy. The plots showed that the direction and magnitude of misreporting of food groups were mainly evenly distributed between AR of energy and those who under-reported or over-reported their EI by the WebFFQ, indicating that misreporting of energy is associated with misreporting of many foods.
Comparing food groups across different studies can be challenging, because of discrepancies in how foods are grouped, and due to cultural differences in what is eaten. Nevertheless, some of our observations for Pearson’s correlations between estimated intakes of food groups (i.e. vegetable, milk and milk products), are comparable and in line with results of ranking abilities from other studies: including a paper-based Dutch FFQ( Reference Streppel, de Vries and Meijboom 43 ), a Danish web-based FFQ( Reference Knudsen, Hatch and Cueto 40 ) and a Finnish paper-based FFQ study( Reference Paalanen, Mannisto and Virtanen 39 ). This indicates that the observed acceptable ranking abilities of the WebFFQ, for most energy adjusted food groups, relative to the 24HR seems to be in line with what is reported elsewhere.
Implications of energy misreporting on the relative validation between web-based FFQ and the 24-h recalls
Because the intake of many nutrients, and especially the intake of energy providing nutrients are correlated with total EI( Reference Willett, Howe and Kushi 44 ), one would expect the ranking abilities of a tool to be fairly similar for energy and energy providing nutrients. Yet, we observed poor ranking abilities for energy for the WebFFQ as compared with the objective DLW method, but acceptable ranking abilities for the macronutrients, in the relative comparison between the WebFFQ and 24HR. Without nutritional biomarkers( Reference Kuhnle 3 ) for more nutrients or food groups, or other objective reference methods, it is not possible to disentangle what this truly implies. Nevertheless, we speculate if this could indicate that there are correlated errors between the WebFFQ and 24HR, which may falsely improve the agreement between methods( Reference Thompson and Subar 34 ). However, ranking abilities for EI of the 24HR assessed by the objective DLW were moderately satisfactory. We argue that because the EI ranking ability of the 24HR is superior to that of the WebFFQ, the 24HR seems an appropriate reference tool for comparison with the WebFFQ.
Referring to previous arguments in this paper, the 24HR proved to underestimate EI on group level to a larger extent than the WebFFQ, and the general overestimation observed for most macronutrients and food groups by the WebFFQ is probably partly reflecting the true underestimation by the 24HR. Thus, mean intakes on group level from the WebFFQ, seem to be acceptable, with some exceptions.
Methodological considerations
The strength of the present study was the use of two different reference methods. The DLW biomarker allowed an objective assessment of the energy estimates from the WebFFQ. Moreover, the four repeated non-consecutive 24HR used in the relative comparison between methods enabled evaluation of estimates of the usual dietary intake. However, the number of recalls needed to estimate usual dietary intake varies for different components of the diet( Reference Pereira, Araujo and Lopes 45 ). Although as few as three to four repeats can be sufficient for the macronutrients validated in the current study, this is in all probability not the case for episodically consumed foods. Still, the number of recalls was restricted to four in this study, due to feasibility and limited resources.
For the WebFFQ to be filled in by the participants under as unflawed conditions as possible, it was administered as the first thing in the study, before the 24HR for all participants, and before the dosing of DLW and urine sampling in group 1. Therefore, the WebFFQ and 24HR diverge timeline wise: the WebFFQ covers the period before the 24HR. A recent systematic review and meta-analysis have demonstrated that there is seasonal variation in EI and the intake of several foods or food groups( Reference Stelmach-Mardas, Kleiser and Uzhova 46 ); this may have attenuated the agreement between the WebFFQ and the 24HR. Group 1, in which the validity of EI was assessed using the DLW method, consisted of women only; this constrains the generalisability of the results to the general adult population, and is also a limitation of this study.
The web-format of our WebFFQ offer inherent error checks, skip-algorithms and images of foods to improve portion size estimates. However, as discussed previously, we did not observe noticeably different results compared with other studies, not even for a paper-based Norwegian FFQ( Reference Andersen, Tomten and Haggarty 33 ). No improvement in accuracy was observed for the web-format compared with the paper format in a study by Beasley et al. ( Reference Beasley, Davis and Riley 47 ) either, and Illner et al. ( Reference Illner, Freisling and Boeing 10 ) argue that the fundamental issues with dietary self-reports are not bypassed by new technology. Thus, a web-based FFQ is still an FFQ, and will still call for the ability to perform cognitively complex tasks, including estimating the intake of episodically consumed foods.
Conclusion
The performance of the WebFFQ conformed to both similar paper-based FFQ and web-based FFQ. For energy, the WebFFQ showed only an insignificant mean underestimation of EI compared with measured TEE from DLW, but is not suitable to rank individuals correctly according to their EI. The relative comparison between the WebFFQ and the mean of four 24HR demonstrated that the estimated intakes on group level for most macronutrients and food groups appear to be acceptable, except for ‘vegetables’ and ‘fish and shellfish’ which are significantly and largely overestimated by the WebFFQ. The WebFFQ’s ranking ability for macronutrients and most food groups appears to be satisfactory relative to the 24HR. The agreement between methods improved after energy adjustments. In conclusion, energy estimates must be used with caution, but the WebFFQ’s ranking abilities and estimated group intakes are mostly acceptable relative to the 24HR, and may, therefore, be used in both future nutrition epidemiology studies and dietary surveys, respectively. Further studies using nutritional biomarkers or other objective reference methods are warranted to confirm these results.
Acknowledgements
The authors thank Peter Thomson for conducting the laboratory analysis on the DLW, and Helene Astrup and Ida Sofie Kaasa for conducting telephone 24HR.
This study was funded by the Institute of Basic Medical Sciences, University of Oslo, with supplementary funds from the Throne Holst Nutrition Research Foundation. The funders had no role in the design, analysis or writing of this article.
The authors’ roles in the study were as follows: A. C. M., C. H., J. R. S., L. F. A.: conception and design; A. C. M.: acquisition of data; A. C. M., M. H. C., C. H., J. R. S., S. S., L. F. A.: analysis and interpretation of data; A. C. M.: drafted the manuscript; A. C. M., M. H. C., C. H., J. R. S., S. S., L. F. A.: critically revised the manuscript; L. F. A.: supervision and obtained funding.
The authors declare that there are no conflicts of interest.


