Monitoring nutritional status of the population is essential in the development and evaluation of national or local health policies. Many countries are monitoring nutrient intake and the food sources of those nutrients using population-based national surveys. In Japan, the National Nutrition Survey (NNS) and the National Health and Nutrition Survey (NHNS) – annual nationwide surveys – have provided valuable information on nutritional and health status in the nation over 70 years( Reference Katanoda and Matsumura 1 ).
Previous studies regarding dietary transition among the Japanese population have shown that the percentage of energy intake from fat and protein gradually increased between 1946 and 2000 (6·9 to 26·5 % and 12·4 to 15·9 %, respectively), whereas total energy intake decreased after reaching the peak of 9569 kJ (2287 kcal)/d in 1971 to 8150 kJ (1948 kcal)/d in 2000( Reference Katanoda and Matsumura 1 ). However, trends in energy intake and the nutrients that are its sources have not been reported since 2000. Obesity is currently one of the rising health issues globally, and Japan is not an exception( Reference Afshin and Forouzanfar 2 ). Although Japan is known as one of the countries that have the lowest proportion of obesity, approximately 30 % of men are overweight and this proportion has been stable for nearly 20 years. Increasing energy intake along with rising overweight and obesity population have been observed in other industrialised countries( Reference Yancy, Wang and Maciejewski 3 – Reference Yun, Kim and Oh 5 ). On the other hand, an increase in the proportion of thinness among young women has been observed, especially after the 1970s( Reference Hayashi, Takimoto and Yoshita 6 , Reference Sugawara, Saito and Sato 7 ). High Na intake is also a major global concern. Excess Na intake among the population is associated with higher risks of major non-communicable diseases such as hypertension, CVD and stroke( 8 ). CVD and cerebrovascular disease remain the leading causes of death among Japanese( 9 ). Although the NNS and NHNS have reported decreasing Na intake among Japanese since 1974 to 2015 (14·5 to 9·7 g/d)( 10 ), high Na intake is still on the top of cardiovascular risk factors of Japanese( Reference Forouzanfar, Alexander and Anderson 11 ).
In addition, the mean age of participants in the NNS and NHNS has been reported to be rising, reflecting ageing in the general population( 8 ). Detailed analyses are needed to detect Japanese dietary changes, by taking such demographic characteristics into account.
Finally, revisions in food composition tables applied to estimate dietary intakes may affect the trends. Since 1950, the Japanese food composition table has been updated to increase both food items and selected nutrients( Reference Watanabe 12 ). The NNS and NHNS data provide a unique opportunity to examine the effect of revisions in food composition tables, because the survey is conducted annually. Here, we demonstrated analyses of the trends in intakes of energy, macronutrients (fat and protein) and Na of the NNS and NHNS participants during 1995–2016.
Methods
Study design and data
The NNS and NHNS are a series of nationally representative cross-sectional nutrition surveys conducted by local public health centres under the supervision of the Ministry of Health, Labour and Welfare on the basis of the Nutrition Improvement Act (Law No. 248, enacted in 1952 and abolished in 2003) and the Health Promotion Act (Law No. 103, enacted in 2002), respectively. The NNS and NHNS collect information on health status, food and nutrient intakes and lifestyles of Japanese civilians using a two-stage cluster sampling scheme. Detailed descriptions of survey procedures have been published( Reference Katanoda and Matsumura 1 , Reference Ikeda, Takimoto and Imai 13 ). In brief, participants are household members aged 1 year or older of households living in the 300 unit blocks (about 5700 households and n 15 000) that were randomly selected from the unit blocks of the Comprehensive Survey of Living Conditions of each year except for 2012 and 2016 where an expanding survey was conducted. In 2011, Iwate, Miyagi and Fukushima prefectures were excluded from the survey because of the Great East Japan Earthquake. In 2012 and 2016, 475 (out of about one million) census units were randomly sampled as survey areas, and all household members in the selected area (approximately n 61 000) were invited to participate. The surveys were conducted in November, except for 2012 and 2016 where it was conducted from 25 October to 7 December and 1 October to 30 November, respectively. Overall response rates for the NHNS ranged from 44·4 % (2016) to 68·6 % (2003) according to the reports of the surveys, whereas the rate for the NNS has not been reported.
The present analyses included data of the NNS (1995–2002) and the NHNS (2003–2016). This period was chosen because assessment of individual’s intakes of nutrients and food groups started in 1995( Reference Iwaoka, Yoshiike and Date 14 ), instead of the previous method assessing only household-based food consumption( 15 ).
These surveys were conducted according to the guidelines of the Declaration of Helsinki and verbal informed consent was obtained from all individual subjects. They have stringent protocols and procedures that ensure confidentiality and protect individual participants from being identified. Under the Statistics Act, the Ministry of Health, Labour and Welfare anonymised individual-level data collected from the NNS and NHNS provided the first author with the data sets for this study.
Study sample
The present analyses were limited to individuals aged 20–79 years who completed the dietary assessment (total: 94 270 men and 107 890 women). Analytic sample sizes ranged from 2604 men and 3009 women in NHNS 2015 to 11 385 men and 13 007 women in NHNS 2012.
Dietary assessment
Dietary intake data were collected using a 1-d semi-weighed household dietary record. Participants recorded food consumption at each household for a usual day excluding trip or festivity days. During the orientation session before the survey, trained fieldworkers (mainly registered dietitians) gave instructions to participants about the survey purpose and how to complete the dietary record. The main record-keepers in a household (members who are usually responsible for preparing meals) were instructed to weigh all of the foods and beverages consumed by the household members and record their names and weights on open-ended recording forms, including the amounts of food waste and leftovers. The main record-keepers were also asked to record the approximate proportions of the food taken by each household members when the members shared foods from the same dish, so that the dietary intake of each individual could be calculated.
For example, when a hot-pot dish (e.g. miso soup) was divided equally and eaten up by three household members (father, mother and a child) without leftovers, the assignment ratio to father, mother, child and leftover is 1:1:1:0. An example of this dietary record is shown in the online Supplementary Table S1. When weighing was not possible, the main record-keepers were asked to record as much information as possible including the portion size consumed or quantity of foods (using household measures) and details of any leftovers.
Trained fieldworkers visited each household and checked the completeness of recording forms and, if necessary, confirmed portion sizes using commercially available food models or food booklets, and corrected any missing and/or illogical information. In accordance with a survey manual of the NNS or NHNS, the trained fieldworkers converted these estimates of portion sizes or quantity of foods being recorded into weights of foods and coded each food item according to the NNS or NHNS food number lists in order to calculate intakes of energy and nutrients from the record of household food consumption.
These food number lists are basically based on the newest Standard Tables of Food Composition in Japan at the date (4th edition( 16 ) for 1995–2000, 5th edition( 17 ) for 2001–2004, 5th revised and enlarged edition( 18 ) for 2005–2010, 2010 edition( 19 ) for 2011–2016), but several food items such as post-cooked foods or water-soaked dried foods (n 6) and prepared foods (n 69) were added to the list as original food items for the NHNS since 2011. When the reporting of the ingredients of mixed dishes was uncertain, such as eating out, common food compositions were allocated to the mixed dish according to typical Japanese recipes( Reference Harigai and Adachi 20 ). The collected recording forms and converted data were further checked at the local public health centre. Dietary intake from supplements, fortified foods and foods for specified health use was assessed in the survey during 2003–2011.
For the nutrient calculation, all the food weights were considered raw-food nutrient values until 2000, where the Standard Tables of Food Composition in Japan, 4th edition( 16 ), was used, owing to the absence of heat-cooked or water-soaked nutrient values. Since 2001, as the Standard Tables of Food Composition introduced post-cooked nutrient values on several food items to reflect changes in nutrient composition, as well as food weight after cooking, the nutrient values in the NNS and NHNS were calculated according to the cooking status (boiled, stewed, roasted, water-soaked or raw). As for cooked foods whose post-cooked nutrient values were listed on the Standard Tables of Food Composition in Japan 2010, the nutrient values at post-cooked status were estimated by applying the post-cooked nutrient values and the post-cooked weight. If the weight of a food at post-cooked status was not available, the weight at raw status was converted to the weight at post-cooked status by using the post-cooked weight conversion rate( 19 ). As regards cooked foods that were not listed in the Standard Tables of Food Composition in Japan 2010, the post-cooked nutrient values were estimated on the basis of the percentage changes in nutrients after cooking for selected food groups (online Supplementary Table S2). For these cooked foods with cooked nutrient values unknown, when a cooked food item was reported at a post-cooked weight, the food weight was converted to an uncooked weight by using a conversion factor in order to apply the percentage changes mentioned above. The weight conversion factors used are as follows: 2·3 for boiled dried noodles; 1·8 for boiled raw noodles; 0·9 for boiled raw potatoes; 2·3 for boiled or stewed dried legumes; 0·7 for boiled or stewed raw leaves vegetables; 6·4 for boiled or stewed dried vegetables; 6·2 for boiled or stewed dried mushrooms; 3·0 for boiled or stewed dried seaweeds (kombu); 0·8 for boiled, stewed or roasted raw fish and shellfish; and 0·7 for boiled, stewed or roasted raw meat. The percentage changes were derived, primarily but with slight modification, from the database developed by Watanabe and colleagues( Reference Watanabe, Suzuki and Kumagai 21 , Reference Watanabe, Suzuki and Yamaguchi 22 ). When using these yield factors, the energy intake was calculated by multiplying the intake amounts of protein, lipid and carbohydrate by applying the Atwater factors (online Supplementary Table S3). Energy and nutrient intakes from food items with these values listed on the Standard Tables of Food Composition in Japan were calculated accordingly. For food items containing alcohol, energy values were calculated as 29·7 kJ (7·1 kcal)/g of alcohol( 16 – 19 ).
The utility of this household-based dietary record to estimate food and nutrient intakes at the individual level has been examined in Japanese subjects( Reference Iwaoka, Yoshiike and Date 14 ). Dietary intakes among thirty-two young female dietetic students estimated by this 1-d household dietary record by their mothers were compared with those estimated by a 1-d weighed dietary record, which was independently conducted by the young students themselves. Mean differences between intakes estimated by the two methods were 6·2 % for energy, 5·7 % for protein, 6·7 % for fat and 6·3 % for carbohydrate, whereas Pearson’s correlation coefficients were 0·90 for energy, 0·89 for protein, 0·91 for total fat and 0·90 for carbohydrate.
In the present study, the selected nutrient intake values were energy-adjusted using the density method (i.e. the percentage of energy for fat and protein, and the amount per 4184 kJ, equivalent to 4184 kJ (1000 kcal), for Na). The proportions of energy intake from fat and protein were calculated using total energy intake and energy intake derived from fat and protein, for each participant. The amount of energy from protein and energy from fat was calculated as 37 kJ (9 kcal)×fat (g) and 17 kJ (4 kcal)×protein (g), by applying Atwater factors.
Anthropometric measurement
Body height and body weight were measured on approximately 90 % of the participants by trained fieldworkers using standardised procedures( 23 ). For the remaining participants (approximately 10 %), height and weight were measured either by other household members at home or self-reported. Height (to the nearest 0·1 cm) and weight (to the nearest 0·1 kg) were measured while the participants were barefoot and wearing light clothes only, and BMI was calculated as weight (kg) divided by height squared (m2).
For analyses in the present study, data were limited to those with acceptable values for height and weight (height>120 cm and 20≤weight≤150 kg) in Japanese. As the maximum value for height was 195·1 cm, we did not set an upper limit for height.
Statistical analysis
Mean values and standard derivation for continuous variables and percentage for categorical variables were calculated according to the survey years. In this calculation, for the data of 2012 and 2016, where the method of cluster sampling was different from other years, weighing was performed to correct for differences between the number of households in each prefecture. The weight for subjects in each prefecture was calculated by dividing the total number of households during the prior 3 years in each prefecture by that in 2012 and 2016. The details of weighing have been described elsewhere( 24 ).
Mean values with their and standard errors of daily energy intake, the proportion of energy intake from fat and protein intakes and Na intake were calculated according to the survey years. Regression models were used to predict energy and nutrient intakes adjusted for the age groups and the status of data regarding height and weight. In addition, because of the differences in the age distribution across surveys, estimates of energy intake and nutrients intake were adjusted to the 2010 survey population using the six age groups 20–29 years, 30–39 years, 40–49 years, 50–59 years, 60–69 years and 70–79 years, and the participation in anthropometric measurement, using the direct method. The year 2010 was chosen because the census survey was conducted, and was the last year before the Great East Japan Earthquake. These regression models were used to generate adjusted total energy intake and adjusted proportions of total energy from protein and fat, Na and energy-adjusted Na to assess differences across time. All analyses were stratified by sex.
The trend analyses were performed by joinpoint regression program (Joinpoint Regression software, version 4.2; National Cancer Institute (http://www.surveillance.cancer.gov/joinpoint)). Joinpoint regression analysis (also known as piecewise linear regression) uses statistical criteria to determine the minimum number of linear segments needed to describe a trend and determine the annual percentage change (APC) for each segment. Monte Carlo permutation method was used to test whether a change in the trend is statistically significant( Reference Kim, Fay and Feuer 25 ). The other statistical analyses were performed with the SAS statistical software, version 9.4 (SAS Institute Inc.). All reported P values were two-tailed, with a P value <0·05 considered statistically significant.
Results
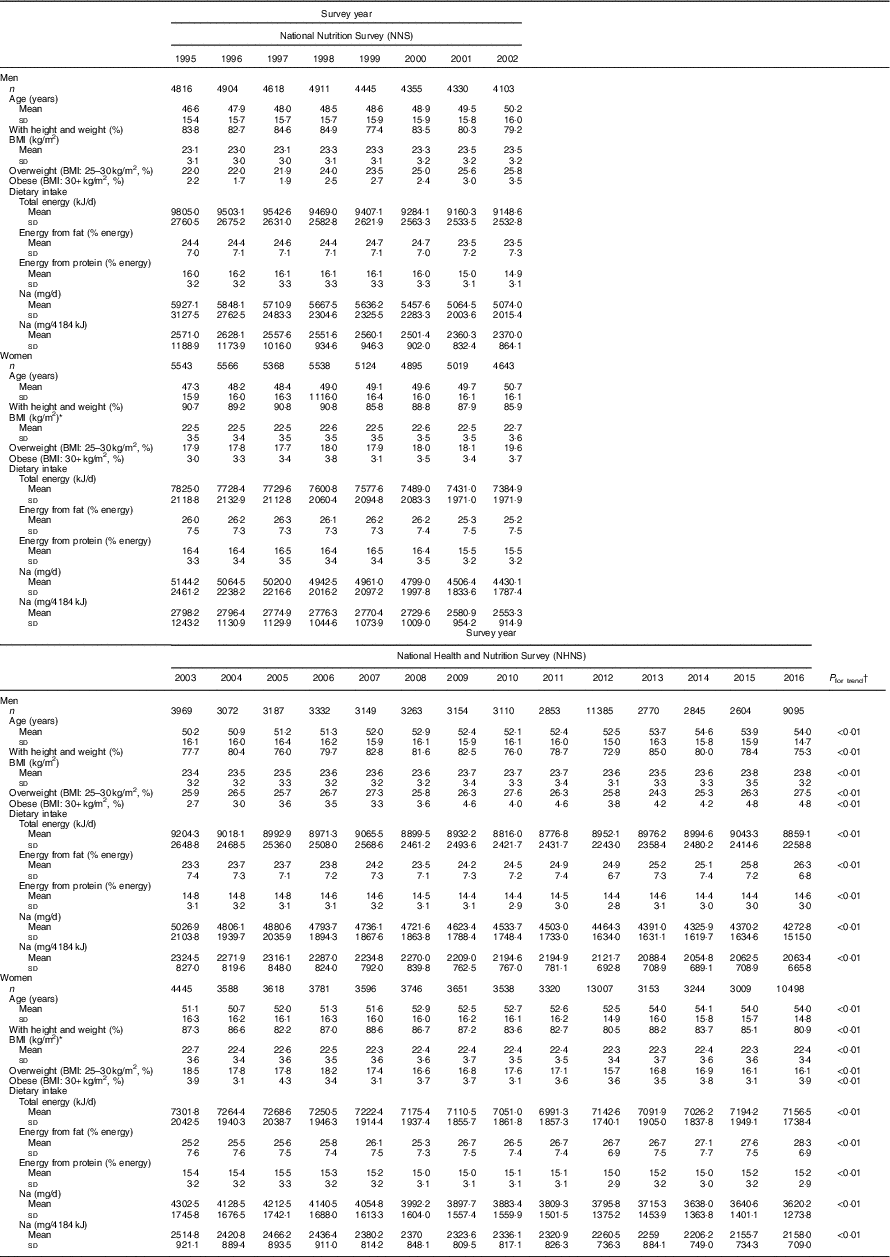
The characteristics of subjects in the present analysis are shown in Table 1. During 20 years of the NNS and NHNS, the number of subjects steadily decreased over time except for 2012 and 2016, during which an expanded survey was conducted. The mean age of participants increased over the survey years in men (46·6 to 54·0 years old, P<0·01 for trend) and women (47·3 to 54·0 years old, P<0·01 for trend). The proportion of subjects who had their height and weight measured significantly decreased from 1995 to 2016 (P<0·01 for trend). The mean BMI showed slight increasing trends in both sexes (P<0·01 for trend) with increasing trends of the prevalence of overweight (30>BMI ≥25 kg/m2) and obesity (BMI ≥30 kg/m2) in men and women (P<0·01 for trend).
Characteristics of survey participants aged 20–79 years by sex, 1995–2016 (Mean values and standard deviations)

* Excluding pregnant women, n 864.
† P for trend values were calculated using regression models.
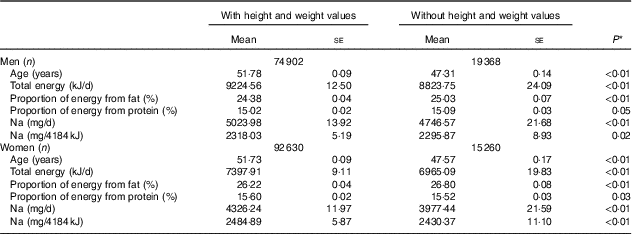
Table 2 shows the differences in age and dietary intakes between subjects who had height and weight measurements and those without. Subjects who had height and weight measurements were older, and had higher energy and Na intakes. In men, the proportion of energy from fat was lower in subjects who had height and weight measurements compared with those without. In women, the proportion of energy from fat was lower and proportion of energy from protein was higher in subjects who had height and weight measurements compared with those without.
Dietary intakes between subjects with and without height and weight values, according to sex (Mean values with their standard errors)

* P values were calculated using regression models.
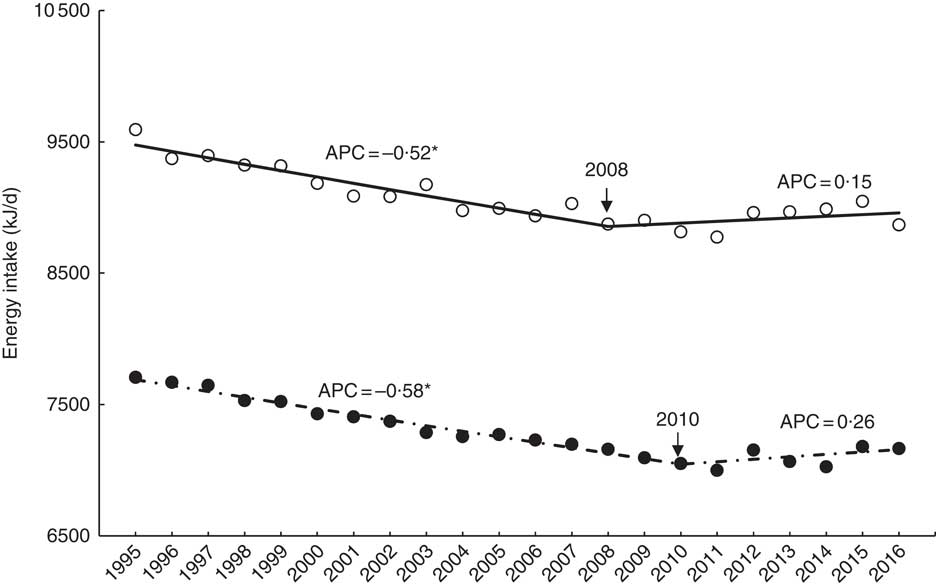
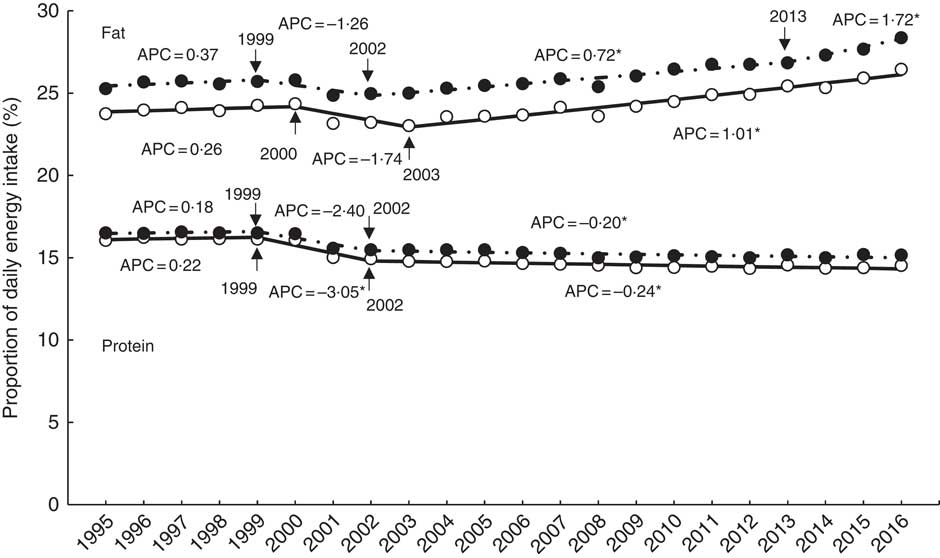
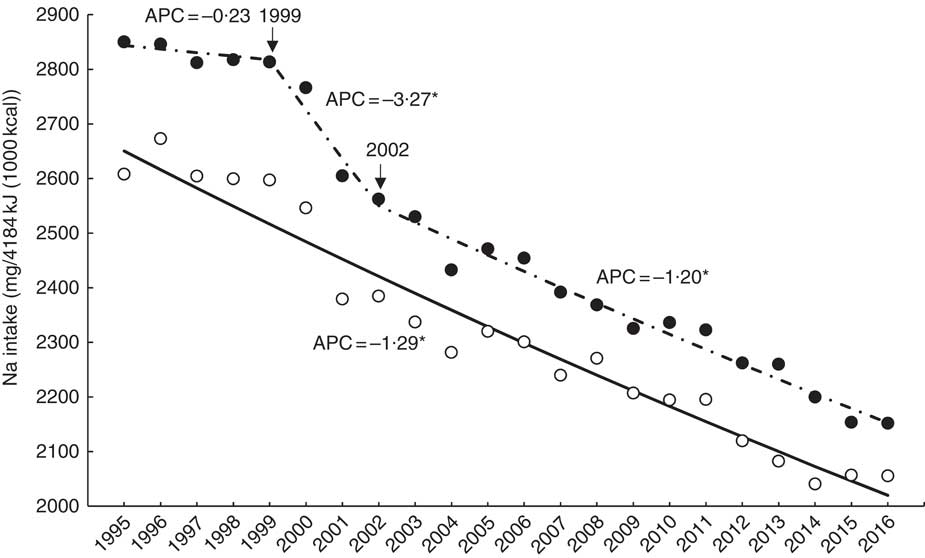
The trends in total intake, proportions of energy intake from fat and protein, and Na intake adjusted for age groups and height and weight measurements are shown in Fig. 1–3. Joinpoint regression analyses identified a change in the trend for total energy intake in 2008 for men and 2010 for women, with significant decreases in APC of 0·5 % from 1995 to 2008 and 0·6 % from 1995 to 2010 in men and women, respectively. Thereafter, annual increases in APC of 0·1 % from 2008 to 2016 and 0·3 % from 2010 to 2016 were observed in men and women, respectively, but the difference between APC was no longer statistically significant. The proportion of total energy from fat intake showed a significant change in trend in 2003, with annual increases of 1·0 % from 2003 to 2016 in men. Two significant changes in trend were identified in 2002 and 2013 in women, with smaller increases in APC of 0·7 % from 2002 to 2013, and thereafter annual increases of 1·7 % were observed. However, a reverse trend shift for the proportion of total energy from protein was found in both men and women, with significant annual decreases of 3·0 % from 1999 to 2002 in men and smaller decreases in APC of 0·2 % from 2002 to 2016 in both men and women. Trend in Na intake decreased over time from 1995 to 2016 in both men and women; three significant trend breaks with annual decreases of 1·1, 3·7 and 1·2 % from 1995 to 1999, 1999 to 2002 and 2002 to 2016 were identified in men and two significant trend breaks with annual decreases of 3·5 and 1·4 % from 1999 to 2003 and 2003 to 2016 were observed in women. Similarly, the trend in Na intake adjusted for energy intake decreased over time from 1995 to 2016 in both men and women. Annual decreases of 1·3 % from 1995 to 2016 were identified in men and two significant trend breaks with annual decreases of 3·3 and 1·2 % from 1999 to 2002 and 2002 to 2016 were observed in women.
Trends in energy intake adjusted for 2010 age category and anthropometry, according to sex. APC, annual percentage change;  , men modelled value;
  , women modelled value;
  , men observed value;
 , women observed value. Arrows show years with a trend shift as indicated by the joinpoint regression analysis. * P<0·05.

Trends in proportion of energy from fat and protein (%) adjusted for 2010 age category and anthropometry, according to sex. APC, annual percentage change; , men modelled value; , women modelled value; , men observed value; , women observed value. Arrows show years with a trend shift as indicated by the joinpoint regression analysis. * P<0·05.

Trends in sodium intake (mg/4184 kJ (1000 kcal)) adjusted for 2010 age category and anthropometry, according to sex. APC, annual percentage change;
, men modelled value; , women modelled value; , men observed value; , women observed value. Arrows show years with a trend shift as indicated by the joinpoint regression analysis. * P<0·05.

Discussion
The present study described the trends in energy intake and its nutrient sources and Na intake among Japanese adults from the data of the NNS and NHNS from 1995 to 2016. Overall, daily energy intake and the percentage of daily energy from protein decreased during over the two decades, whereas the percentages of daily energy intake from fat increased both in men and women. Na intake was significantly decreased even after energy adjustment.
Trends in energy intake have been described around the world. For example, in the USA, results from the National Health and Nutrition Examination Survey showed an increasing trend in energy intake( Reference Yancy, Wang and Maciejewski 3 ). Similarly, Korea National Health and Nutrition Examination Survey has reported the upward trend in energy intake only in men, whereas women’s energy intake decreased( Reference Yun, Kim and Oh 5 ). Other industrialised countries have reported similar trends( Reference Whitton, Nicholson and Roberts 4 , Reference Dubuisson, Lioret and Touvier 26 ). In contrast, although the method to estimate dietary intake was different, the present study identified a downward trend in energy intake, which is a continuous decline from the prior trend( Reference Katanoda and Matsumura 1 ). Japan is known as one of the countries that have the lowest prevalence of overweight or obesity( 27 ).
Moreover, Japanese women have been reported to have a larger proportion of underweight( Reference Hayashi, Takimoto and Yoshita 6 , Reference Sugawara, Saito and Sato 7 ). Taking these into account, Japanese population has different trends in energy intake from other countries, and this might be reflected in their weight status. However, our study also showed that the prevalence of overweight or obesity increased in men. A recent Japanese study reported that men who skipped breakfast more frequently gained their body weights during 5 years and those who skipped breakfast reported significantly lower energy intake( Reference Sakurai, Yoshita and Nakamura 28 ). Data from the NHNS have shown that more men than women skipped their breakfast( 23 ), and this percentage has become more common among young adults (20–39 years) in the recent 20 years. This might partly explain the present results of the trend in energy intake. In addition, energy intake from any self-reporting methods should be interpreted with under- or over-reporting( Reference Murakami, Sasaki and Okubo 29 ), which might have influenced the present results. In particular, there have been several studies on the greater under-reporting of dietary intake among overweight or obese subjects( Reference Murakami, Sasaki and Okubo 29 , Reference Murakami and Livingstone 30 ) and older age( Reference Murakami and Livingstone 30 ). A previous study using data of the 2012 NHNS reported that misreporting of energy intake was≤10 % (−10 to +6 %), on average, and the prevalence of under- and over-reporters was ≤6·3 and ≤2·0 %, respectively( Reference Murakami, Livingstone and Okubo 31 ). This study also reported that under-reporting was associated with overweight and obesity. Therefore, the increased percentage of overweight might have had some impact on an underestimation of energy intake.
In contrast, the present study observed differences in energy and nutrient intake between subjects with and without height and weight values, which was taken into account for the trends analyses. In most cases, the NHNS physical examination is accompanied by an in-person review of the dietary record, and missing a review could lead an under-reporting of dietary intake. Indeed, a previous study using NHNS data reported that there was a significant difference in total energy intake according to the status of participation in a physical examination( Reference Ikeda, Okuda and Tsubota-Utsugi 32 ). However, in this previous study, the participation of physical examination had little impact on the decreasing trend in energy intake, which was consistent with the present study. Moreover, the change across the time of under- or over-reporting remains unclear in the adult participants of the NHNS. Therefore, further studies are needed in Japanese population to determine the background of the change in energy intake, such as physical activity status.
Regarding the macronutrient intakes, energy intake from protein decreased, whereas that from fat increased. Our findings indicated that a change might have occurred in Japanese food intake pattern over two decades. According to the NHNS, meat intake increased and fish intake decreased during these 20 years( 23 ). Similarly, there has been a marked change in food supply in which the amounts of animal products and total fats and oils increased( 23 ). A report from Korea showed similar trends in which energy intake from fat increased and that from protein decreased( Reference Yun, Kim and Oh 5 ). The changes in household status may be another factor. For example, in 1995, only 9 % of the population was living alone, whereas it reached 14·5 % in 2015( 33 ). A previous Japanese study reported that those living alone were likely to have lower protein intakes compared with those living with family members among 18- to 20-year-old women( Reference Kobayashi, Asakura and Suga 34 ). In addition, now approximately 40 % of Japanese regularly (more than 2 d/week) use ready-to-eat meals such as those from restaurants and take-out foods( 10 ). Higher frequency of eating out was reported to be associated with higher intake of fat among female Japanese students aged 18 to 22 years( Reference Murakami, Sasaki and Takahashi 35 ). Such changes in lifestyle and dietary behaviour may have led to the observed changes in macronutrient source of energy intake. The Dietary Reference Intake for Japanese set dietary goal for fat and protein at 20–30 % energy for fat and 13–20 % energy, respectively( 36 ). Our results indicated that the intakes of these macronutrients remained within the recommended ranges. However, the macronutrient intakes were different among men and women. Greater proportions of energy intake from both fat and protein were observed in women than in men. The present analyses did not examine the trends of energy intake from alcohol, as well as carbohydrates. Regarding alcohol, we were unable to accurately estimate energy intake from alcohol in the NNS and NHNS, because of insufficient data. According to the NHNS, the prevalence of alcohol drinking (drinking 3 d/week or more, with 20 mg of alcohol/d or more when drinking) has been decreasing in men, whereas the opposite trend has been observed in women in the recent decade( 23 ). The present results could have been affected if energy intake from alcohol was taken into account. Further studies are needed to examine the background factors that contribute to intakes of macronutrients in Japanese, as well as a continual monitoring of the intakes.
In East Asia, particularly Japan, high Na intake is a major dietary problem that deteriorates health( Reference Forouzanfar, Alexander and Anderson 11 ). In this study, a declining trend in Na intake was observed along with years; however, the amount is still greater than that in other countries( Reference Asakura, Uechi and Sasaki 37 , Reference Trieu, Neal and Hawkes 38 ). The main approach for the Na reduction has been through national and regional educational campaigns in Japan( 39 ), where the major sources of dietary Na are seasonings such as soya sauce and miso (soya paste)( Reference Anderson, Appel and Okuda 40 , Reference Asakura, Uechi and Masayasu 41 ). However, it is unlikely that these campaigns contributed to the present result showing a decreasing trend. A recent systematic review reported that Japanese high Na intakes did not change across the time during the period from the 1970s to 2010s by assessing the studies using 24-h urinary Na excretion data( Reference Uechi, Sugimoto and Kobayashi 42 ). From this review, it is likely that Na intake is still high in Japanese population. In addition, processed foods were not the major sources of Na in the diet( Reference Anderson, Appel and Okuda 40 , Reference Asakura, Uechi and Masayasu 41 ), whereas a recent study indicated that the source of Na might be changing to processed foods( Reference Asakura, Uechi and Masayasu 41 , Reference Takimoto, Saito and Htun 43 ). Amounts of Na in various processed foods might be underestimated in the self-reported method we used, because of the limited information in the food database. The Na intake in NHNS dietary assessment may be underestimated to some extent, but the decline in energy-adjusted Na intakes along with the downward trend in mean systolic blood pressure among adults( 23 ) suggest that population Na intakes may indeed be decreasing. Further approaches, such as measuring urine Na excretions in sub-samples of the NHNS, may need to be applied to increase the accuracy of current estimates( Reference Rhodes, Murayi and Clemens 44 ).
In this study, the trends in energy and nutrient intakes observed were generally consistent. However, there were several significant trend breaks according to the joinpoint regression analyses. One possible reason for this could be the revision of the Standard Table of Food Composition ( Reference Watanabe 12 ). Unfortunately, the continuity of the calculation using different versions of the Standard Table of Food Composition in Japan has been poorly examined. A previous study reported that the change in mean energy, protein and fat intake could be estimated to be <2 % with the revision from the 4th to the 5th versions( Reference Yoshiike 45 ). However, the influence of other revisions has not been investigated. Although the other revisions did not include major changes in calculation method or nutrient analysis( 18 , 19 ), our results suggest that population estimates be interpreted with caution.
The strengths of this study should be taken into account. The NNS and NHNS are the only surveys that produce nationally representative data on dietary intake in Japan. Annual implementation of the surveys enabled to monitor and investigate the dietary trends at the population levels. However, several limitations also need to be mentioned. First, although the NNS and NHNS have been conducted aiming to represent a national representative sample of Japanese population, the household response rates are relatively low (ranging from 44·4 % (2016) to 68·6 % (2003)). Moreover, the response rate of individual household members is unknown. During these two decades, the Japanese population structure has gradually changed. In 1995, the proportion of those aged 60–79 years was approximately 17 %, and this proportion increased to 26 % in 2016. The contribution from people in this age group was even larger in the NNS and NHNS, because as much as approximately 31 % of participants were in this age group in 2016. Selection bias cannot be ruled out. Therefore, the under-representation of those under 60 years may have affected the results, although age-standardisation was applied to minimise the effect. Second, the utility of the household-based dietary record in estimating energy and nutrient intakes has been examined only among young women. The utility of the method applied to other age or sex categories, especially in the elderly, remains unknown. The previous validation study only compared individual self-reported data and individual data derived from household-based dietary data, among households with young women( Reference Iwaoka, Yoshiike and Date 14 ). To truly validate this current survey method, households with members who have similar sex and age distributions to those participating in the NHNS should be selected as study samples. Third, we were unable to obtain nutrient intakes from dietary supplements or nutrient-fortified food except for 2003–2011, because of the lack of reliable databases in Japan. Meanwhile, the use of dietary supplements or the so-called ‘dieting foods’ are becoming more popular among Japanese population( Reference Koike, Ohtsu and Sakakibara 46 ); therefore, these foods could result in inaccurate reporting of dietary intake status of the population. It has been reported that the distribution of energy and protein intake did not differ according to Ca or Fe supplement uses, whereas Ca supplement use was associated with greater fat intake in a Japanese study using NHNS data( Reference Sato, Tsubota-Utsugi and Chiba 47 ). Moreover, nutrient intakes from many processed foods cannot be estimated, because the Standard Table of Food Composition in Japan fails to provide timely updated information. Thus, this methodological issue might explain part of the trends observed in this study.
In summary, we demonstrated the analyses on energy, fat, protein and Na intake trends in Japanese population during the recent 20 years. This study identified the decrease in total energy intake, energy intake from protein and Na intake, whereas there were inverse trends in energy intake from fat. Detailed analyses of the background of these trends are needed, as the trends are different from the reports of other countries. Continued monitoring of trends in dietary intake will be needed, while there should be efforts to increase the accuracy of current survey procedures.
Acknowledgements
This study was supported by the Health Japan 21 (the second term) Analysis and Assessment Project, Ministry of Health, Labour, and Welfare. Ministry of Health, Labour, and Welfare had no role in the design, analysis or writing of this article.
Author contributions were as follows: H. T. substantially contributed to the conception and design, and the acquisition of the data. A. S., N. C. H. and H. T. contributed to the analysis and interpretation of the data and A. S. and S. I. drafted the manuscript. E. O., K. Y. and N. Y. took part in the interpretation of the data and provided critical revisions of the manuscript for important intellectual content. H. T. made a final revision and approval of the manuscript. All authors read and approved the final manuscript.
The authors declare that there are no conflicts of interest.
Supplementary material
For supplementary material/s referred to in this article, please visit https://doi.org/10.1017/S0007114518001162