


Consumption of Brassica vegetables has been inversely associated with the incidence of several cancers, including cancer of the breast, colon, endometrium, liver, lung, ovaries and stomach( Reference Chen, Wallig and Jeffery 1 – Reference Lam, Ruczinski and Helzlsouer 8 ). Brassica vegetables contain numerous health-promoting compounds, but the ability to disrupt cancer initiation and progression is thought to originate with a class of sulphur-containing secondary metabolites called glucosinolates, which are found in plants of the order Brassicales and in all Brassica vegetables. Glucosinolates have little or no bioactivity, but in the presence of plant or bacterial myrosinase they are hydrolysed to bioactive isothiocyanates and further metabolites.
Isothiocyanates are electrophilic compounds that may inhibit cancer by a variety of mechanisms. Several plant-derived isothiocyanates activate nuclear factor (erythroid-derived 2)-like 2 (NRF2) signalling to induce enzymes involved in maintaining intra-cellular redox capacity and phase II detoxification enzymes such as NAD(P)H quinone oxidoreductase 1 (NQO1) and glutathione S-transferases (GST)( Reference Thimmulappa, Mai and Srisuma 9 , Reference Fahey, Wehage and Holtzclaw 10 ). Sulphoraphane (SF, 1-isothiocyanato-4-methylsulfinyl butane), an isothiocyanate derivative of glucoraphanin, which is the predominant glucosinolate in broccoli, induces apoptosis( Reference Sakao and Singh 11 ) and preferentially inhibits histone deacetylase in cancer cells( Reference Nian, Delage and Ho 12 ). Another chemopreventive mechanism mediated by isothiocyanates may involve NRF2-independent modulation of inflammasomes, which have been implicated in inflammatory disorders and may be linked to some cancers( Reference Greaney, Maier and Leppla 13 ).
The effectiveness of isothiocyanates to inhibit cancer may depend on isothiocyanate concentration, molecular mechanism and cell type. Expression of NQO1 doubled in Hepa 1c1c7 cells at SF concentrations of 0·4–0·8 µm ( Reference Zhang, Talalay and Cho 14 ), whereas at concentrations of 5–50 µm, in these cells and HT29 cells, apoptosis was induced dose dependently( Reference Gamet-Payrastre, Li and Lumeau 15 ). In a human clinical study, consumption of high-SF broccoli soup, cooked briefly to ensure retention of plant myrosinase activity, up-regulated several genes in gastric mucosa with oxidoreductase activity, whereas broccoli soup with one-third the amount of SF induced only one gene from this group( Reference Gasper, Traka and Bacon 16 ).
Therefore, to develop dietary recommendations to optimise the health benefits of Brassica vegetable consumption, it is important to identify factors that influence isothiocyanate absorption and metabolism in humans. There is evidence, for example, that the efficiency of isothiocyanate metabolism is influenced by the presence or absence of the glutathione S-transferase μ 1 (GSTM1) and glutathione S-transferase θ 1 (GSTT1) genes( Reference Gasper, Al-Janobi and Smith 17 , Reference Seow, Shi and Chung 18 ). In addition, the content of glucosinolates and other phytochemicals varies considerably across cultivars, impacting effective dose from a serving and therefore affecting bioactivity, as well as blood levels and urinary excretion of isothiocyanates and their metabolites( Reference Faulkner, Mithen and Williamson 19 ). Furthermore, SF is absorbed more rapidly and is found at higher levels in blood and urine following consumption of raw broccoli compared with cooked broccoli, a difference that is likely to be related to the denaturation of plant myrosinase by the heat of cooking( Reference Vermeulen, Klöpping-Ketelaars and van den Berg 20 , Reference Oliviero, Verkerk and Vermeulen 21 ). Some differences in the absorption, metabolism and subsequent urinary excretion of isothiocyanates may be explained by differences in the myrosinase-like activity of gut microbiota among individuals( Reference Li, Hullar and Beresford 22 ). A recent pre-clinical study has shown that adaptation to Brassica vegetables influences absorption and metabolism of isothiocyanates. Microbiota from rats that were given broccoli powder daily for 1 or 2 weeks more efficiently converted glucosinolates to isothiocyanates compared with microbiota from rats with no prior exposure to broccoli powder( Reference Angelino, Dosz and Sun 23 ). However, little is known about how dietary patterns affect the absorption and metabolism of isothiocyanates from Brassica vegetables in humans.
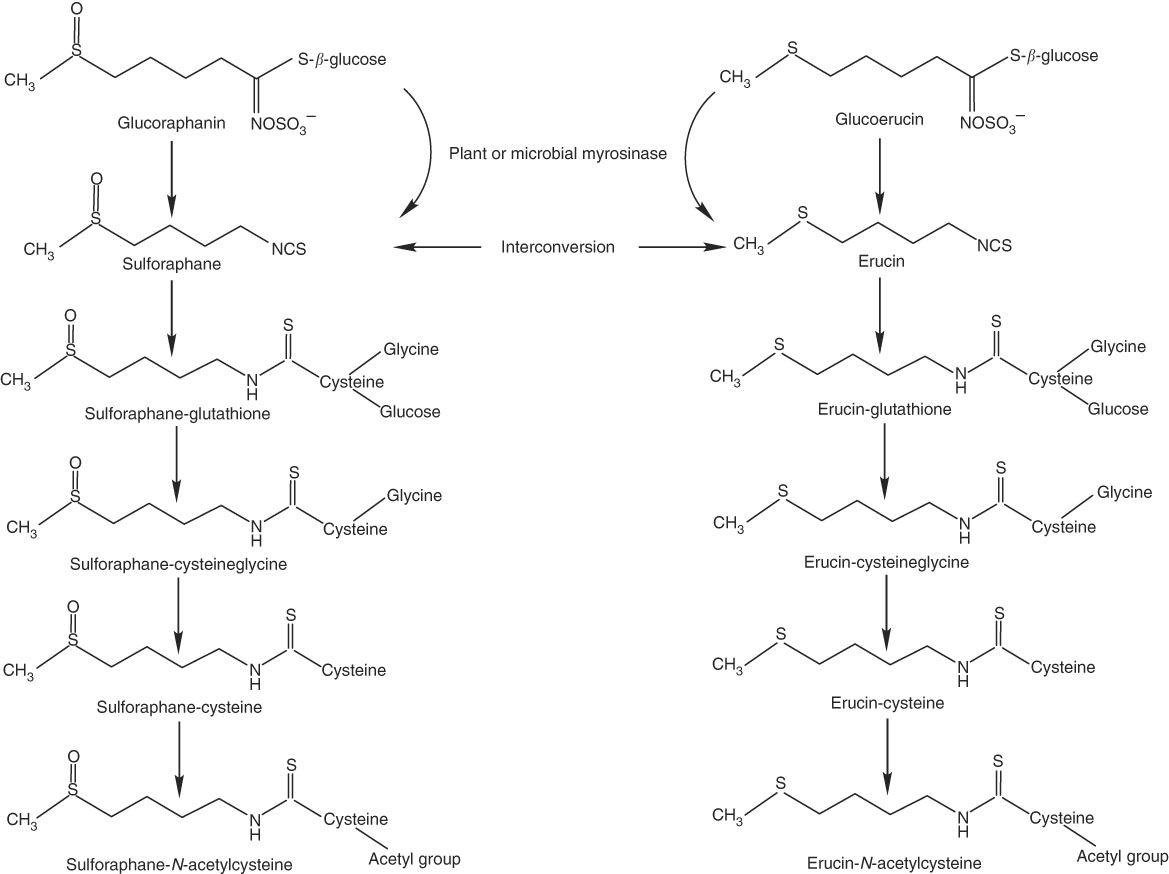
Thus, we conducted a human clinical trial to investigate how daily consumption of broccoli might influence absorption and metabolism of isothiocyanates and their metabolites, as reflected in plasma and urinary excretion, and whether any effects were related to BMI, GSTM1 genotype or sex. We targeted SF and its mercapturic acid pathway conjugates because of the large body of evidence supporting the chemopreventive action of SF. We also measured erucin (ER) mercapturic acid pathway conjugates because ER and SF have been shown to interconvert, and thus ER metabolites are related to the pool of SF metabolites( Reference Clarke, Hsu and Riedl 24 , Reference Platz, Piberger and Budnowski 25 ) (Fig. 1).
Myrosinase-mediated catabolism of glucoraphanin and glucoerucin to sulphoraphane and erucin, respectively, and subsequent mercapturic acid pathway conjugations and interconversion of sulforaphane and erucin.
Methods
Subjects
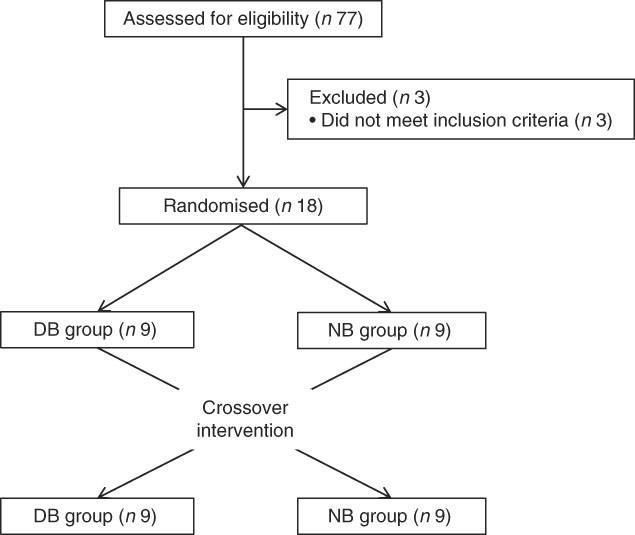
This study was conducted at the Beltsville Human Nutrition Research Center (BHNRC) in Beltsville, MD, USA. Healthy adults were recruited from the Washington, DC area from January to March 2015. Participants were screened to ensure general health and were 37–65 years of age (online Supplementary Fig. S1) with a BMI between 19 and 37 kg/m2 (online Supplementary Fig. S2). Potential subjects who met any of the following criteria were excluded: (1) pregnant or lactating; (2) allergic or intolerant to Brassica vegetables; (3) history of bariatric surgery or nutrient malabsorption disease (such as celiac disease) or other metabolic disorders requiring special diet recommendations; (4) used tobacco products; (5) type 2 diabetes requiring the use of diabetes pills, insulin or non-insulin shots; (6) used blood-thinning medications such as Coumadin (warfarin), dicumarol or Miradon (anisindione) and (7) self-report of alcohol or substance abuse within the past 12 months and/or current acute treatment or rehabilitation program for these problems. Eligibility was determined by routine blood and urine screening and health history questionnaire. Potential subjects were genotyped for GSTM1 and GSTT1. See Fig. 2 for the recruitment and enrollment data. This study was conducted according to the guidelines laid down in the Declaration of Helsinki, and all procedures involving human subjects were approved by the MedStar Health Research Institute (Hyattsville, MD, USA). Written informed consent was obtained from all subjects. Participant characteristics are reported in Table 1. All subjects were GSTT1-present. This trial was registered at clinicaltrials.gov (NCT02346812).
Recruitment and enrollment of subjects. DB, daily broccoli; NB, no broccoli.
Characteristics of study participantsFootnote * (Mean values and standard deviations)
GSTM1, glutathione S-transferase µ 1.
* All subjects were GSTT1-present.
Broccoli
The broccoli used in this study was procured as a single shipment of commercially frozen broccoli that was thoroughly mixed and stored at –80°C. Commercially processed frozen broccoli is blanched and has very little myrosinase activity, particularly when it is further cooked( Reference Dosz and Jeffery 26 ). Therefore, broccoli portions consumed during the study were served with raw daikon radish as a source of plant myrosinase. A single batch of fresh raw daikon radish was procured, and slices totalling 10 g were stored at –80°C and used throughout the study. We chose this approach because it was not possible to obtain fresh broccoli of consistent glucosinolate content over the duration of this study.
Glucosinolates were measured in randomly selected 100-g samples (n 3) of broccoli by a previously described method before the beginning of the study( Reference Saha, Hollands and Teucher 27 ). Broccoli weighing 200 g provided 97·5 µm of glucoraphanin and 5·8 µm of glucoerucin (Table 2). Fibre content was determined by the method of Prosky et al. ( Reference Prosky, Asp and Furda 28 ).
Macronutrients, fibre, glucoraphanin and glucoerucin provided by base diet and broccoli
Experimental design and treatments
This study was a randomised cross-over design consisting of two 18-d periods separated by a 3-week washout. The cross-over design was chosen so that each subject could serve as his or her own control, thus increasing the likelihood that differences could be detected. Sample size was estimated for treatment main effects on plasma time curve (AUC) based on data from humans after adaptation to polyphenols in a study conducted in our laboratory. Using the 65 % increase in AUC that we measured( Reference Novotny, Chen and Terekhov 29 ) and using 80 % power and P<0·05, a sample size of 14 was calculated. To allow for drop-out rate, we enrolled eighteen subjects. Power calculations were performed using SigmaPlot 12.0. Subjects consumed either a control diet with no broccoli or other Brassica vegetables (NB) or a daily broccoli (DB) diet for 16 d. The NB diet consisted of 16 % energy content from protein, 30 % from fat and the remainder from carbohydrates. Macronutrient content is reported in Table 2. Foods were scaled in 836 kJ (200 kcal) increments to meet individual energy requirements and to maintain subject weights. The diet consisted of typical American foods and provided 3–5 servings of fruit or vegetables daily (268–536 g/d). The DB diet consisted of the same NB diet plus 100 g of broccoli and 10 g of frozen raw daikon radish with breakfast and the same amounts of broccoli and daikon radish with dinner each day for 15 d. Broccoli that was consumed at the BHNRC was thawed at 4°C, and 100-g portions were heated for 30 s in a 1200-W microwave oven (NE-1258R; Panasonic). For broccoli consumed outside of BHNRC (weekends), subjects were instructed to heat the 100-g broccoli portion in a microwave oven for 15-s increments until warm. On day 16, subjects on the DB diet received 100 g of broccoli and 10 g of radish at breakfast but not at dinner. Broccoli was excluded from the day-16 dinner so that metabolites would not carry over to day 17. On day 17, all subjects consumed 200 g of broccoli, 20 g of daikon radish, a 100-g roll and 10 g of margarine for breakfast. The broccoli was heated for 30 s in a 1200-W microwave oven, stirred and heated for an additional 20 s. Each subject received each treatment and was randomly allocated to one of two groups using stratified randomisation to ensure balance of GSTM1 genotype, BMI, sex and age. The allocation sequence was concealed from the principal investigator (C. S. C.) and was assigned diet by the supervisory dietitian without consulting the PI. The allocation sequence was not provided to the PI until the study was completed. Laboratory analysts were blinded to the treatment allocation, although it was not possible to blind the subjects to which diet they received.
Study participants were instructed to consume all foods and only foods provided by the BHNRC, with the exception of coffee, tea and diet soda. Breakfast and dinner on weekdays were consumed in the BHNRC dining room, and lunches and weekend meals were packed for carryout. Coffee and tea intake was limited to 2 cups/d, and intake of diet soda was not limited. Consumption of coffee, tea and soda was recorded by study participants. Study participants were asked to abstain from Brassica vegetables (except during the DB diet period when they consumed broccoli) and vitamin and mineral supplements beginning 3 weeks before the study and continuing for the duration of the study, including the washout period. No adverse effects were observed. All participants completed the study, and corresponding samples were analysed.
Glutathione S-transferase μ 1 and glutathione S-transferase θ 1 genotyping
Genotyping was conducted at the Bionomics Research and Technology Center of the Environmental and Occupational Health Sciences Research Institute (Piscataway, NJ) using a previously described method( Reference Charron, Clevidence and Albaugh 30 ).
Sample collection and analysis
On day 17, blood and urine were collected for 24 h. Blood was collected immediately before the broccoli challenge meal and at 0·5, 1·0, 1·5, 2·0, 2·5, 3·0, 3·5, 4·0, 5·0, 6·0 and 24 h thereafter. Blood was collected into EDTA-coated vacutainers, centrifuged at 2000 g for 10 min and after removing 0·5-ml aliquots of plasma into cryovials the cryovials were immediately snap-frozen in liquid N2 and stored at –80°C until analysis. All urine samples were collected and weighed beginning before the broccoli challenge meal and continuing for 24 h. Urine was collected at 2, 4 and 6 h at BHNRC and aliquots of 1·5 ml were added to 0·25 ml of 0·7 % ascorbic acid and stored at –80°C. From 6–14 h, subjects collected all urine into a 3-litre collection jug containing 2 g of ascorbic acid and from 14 to 22 h collected all urine into a different 3-litre collection jug containing 1 g of ascorbic acid. A third jug was provided in the event that subjects needed to void before arriving at BHNRC, which was then added to the urine collected at BHNRC at 24 h. Aliquots of 1·5 ml from the 6- to 14-h and 14- to 22-h containers were dispensed into cryovials (with no additional acidification), and 1·5-ml aliquots from the 24-h combined collection (included urine from 22 to 24 h) were dispensed into cryovials containing 0·25 ml of 0·7 % ascorbic acid. Urine aliquots of 4·0 ml were removed from the 14- to 22-h collection for the lactulose:mannitol (LM) test. All samples were stored at –80°C until analysis.
Lactulose:mannitol test
To test for treatment effects on intestinal permeability, subjects were provided and instructed to drink a 100-ml solution containing 5 g of mannitol and 10 g of lactulose after their final void at 14 h, which was after fasting for approximately 4 h. Urine from the 14- to 22-h collection was analysed for lactulose and mannitol according to the procedure of Miki et al. ( Reference Miki, Butler and Moore 31 ). Lactulose and mannitol were separated on a Kromasil column (4·6×250 mm, 5 µm; Sigma) at 25°C with a mobile phase of 75 % acetonitrile and flow rate of 0·8 ml/min. Standard curves were generated to quantify lactulose and mannitol concentrations.
Analysis of sulforaphane and conjugates of sulforaphane and erucin in plasma and urine
SF and conjugates of SF and ER were measured in plasma and urine using a previously reported method( Reference Janobi, Mithen and Gasper 32 ). Aliquots of 0·5 ml of ice-cold plasma were combined with 50 µl of 100 µm N-acetyl(N-butylthiocarbamoyl)-l-cysteine (BNAC) as an internal standard, vortex-mixed for 3 s, then combined with 50 µl of ice-cold trifluoracetic acid and vortex-mixed again. The sample was centrifuged at 16 000 g for 10 min at 4°C to pellet precipitated proteins. The supernatant was filtered with a 0·2-µm spin filter (Grace) at 10 000 g for 5 min at 4°C. A volume of 150 µl of this filtered supernatant was transferred to a deactivated glass insert and autosampler vial (Agilent) for analysis. A volume of 0·5 ml of ice-cold urine was combined with 25 µl of 100 µm BNAC, vortex-mixed for 3 s and centrifuged at 10 000 g for 5 min at 4°C. This filtered urine was mixed with 4·5 ml of 10 mm ammonium acetate buffer at 4°C previously adjusted to pH 4·0 with acetic acid. A volume of 150 µl of the sample was then transferred to a deactivated glass insert and autosampler vial for analysis.
Plasma and urine samples (10 µl) were analysed by ultra high-performance liquid chromatography using an Agilent Zorbax SB-Aq column (2·1×100 mm, 1·8 µm) and an Agilent 6490 triple quadrupole mass spectrometer. Solvent A was 10 mm ammonium acetate adjusted to pH 4 with acetic acid and solvent B was acetonitrile with 0·1 % acetic acid. The flow rate was 0·25 ml/min and the gradient began at 5 % B, increasing to 30 % B over 5 min and returning to 5 % B over an additional 6 min. The UHPLC eluent was sprayed into the mass spectrometer source interface operating with electrospray ionisation in the positive mode. A total of nine metabolites were detected and measured by selected reaction monitoring collision-induced dissociation transitions: SF (m/z 178–114), sulforaphane-glutathione (SF-GSH, m/z 485–136), sulforaphane-cysteineglycine (SF-CG, m/z 356–136), sulforaphane-cysteine (SF-C, m/z 299–136), sulforaphane-N-acetylcysteine (SF-NAC, m/z 341–178), erucin-glutathione (ER-GSH, m/z 469–179), erucin-cysteineglycine (ER-CG, m/z 340–179), erucin-cysteine (ER-C, m/z 283–103), erucin-N-acetylcysteine (ER-NAC, m/z 325–164) and BNAC (m/z 279–122). Source parameters were as follows: capillary voltage, 3000 V; desolvation gas temperature and flow rate, 200°C and 14 litres/min, respectively; sheath gas temperature and flow rate, 250°C and 6 litres/min, respectively; and collision energy, 8–20 eV. External standard curves were produced using standards synthesised and purified by previously reported methods( Reference Kassahun, Davis and Hu 33 , Reference Egner, Kensler and Chen 34 ) and used to quantify metabolites in plasma and urine. As was determined in a study using similar analytical techniques, ER could not be reproducibly measured and therefore was not included in the analysis( Reference Clarke, Hsu and Riedl 24 ).
Statistical analysis
The plasma concentrations of SF and mercapturic acid pathway conjugates of SF and ER were adjusted for estimated plasma volumes( Reference Lemmens, Bernstein and Brodsky 35 , Reference Dill and Costill 36 ) and are presented as plasma mass of metabolites (µmol). We chose this approach so that differences in blood volume with body size would not skew the results. Rates of urinary excretion (µmol/h) of metabolites were determined by dividing the metabolite concentrations by the urine volumes from the time frames of collection. Plasma AUC was calculated using the linear trapezoidal method. The maximum plasma mass of metabolites (M max) and time to reach this maximum (T max) for each time point curve were determined by visual inspection. The elimination rate constant (k) was estimated from nonlinear exponential decay curves fit to the elimination phase of plasma mass–time curves. ANOVA was performed using the GLIMMIX procedure in SAS (version 9.3; SAS Institute). For maximum plasma mass, L:M ratio and total plasma metabolites across time, whose observed values were continuously distributed across a fixed-interval (i.e. [a,b] for any a<b) range, ANOVA models used a β distribution with a logit function to link inferences to the original scale of the observed data values. For all other variables, observed values were continuously distributed like time values across a positive range (0, ∞); ANOVA models used a γ distribution with a log function to link inferences to the original scale of the observed data values. Plots of models’ residuals were examined to verify goodness of fit. For models that analysed plasma and urinary metabolites with time, the following effects were included in the model: subject, period, sequence, hour, diet, BMI, GSTM1 genotype, sex, diet×hour, diet×BMI, diet×GSTM1 genotype, diet×sex, diet×BMI×hour, diet×GSTM1 genotype×hour and diet×sex×hour. All other models excluded the hour terms. Subject was modelled as a random effect and other effects were modelled as fixed effects. Pairwise t tests (P<0·05) were conducted at each time point to test for differences based on sex or GSTM1 genotype when the diet×sex×hour or diet×GSTM1 genotype×hour interaction was significant. For clear graphical depiction of the diet×BMI interaction, data were divided into two groups (n 9, for each) by median BMI=26 kg/m2. All significance tests of model effects and mean comparisons were conducted on the model’s logit or log scale and reported on the original data scale as least squares means with 95 % CI.
A diet×BMI interaction was observed for plasma and urinary metabolites, but the study was not powered to allow statistical detection of a diet×BMI interaction. A post hoc power analysis was conducted to identify a valid way to examine this interaction. On the basis of the philosophy that the eighteen original study observations can reasonably be assumed to be representative of observations that would have been measured if the original study had had thirty-six instead of eighteen subjects, all data analyses conducted for the original study (eighteen subjects) were repeated on the thirty-six observations (i.e. ‘x2’ data) constructed by duplicating each of the original eighteen observations. False discovery rate (FDR q-values) were calculated for the P values resulting from all tests on the ‘χ 2’ data. All tests from the original study (eighteen subjects) with unadjusted P-value <0·05 also exhibited a q-value <0·05 in the ‘χ 2’ post hoc power analysis, indicating validity in reporting unadjusted P values for all tests conducted for the original study.
Results
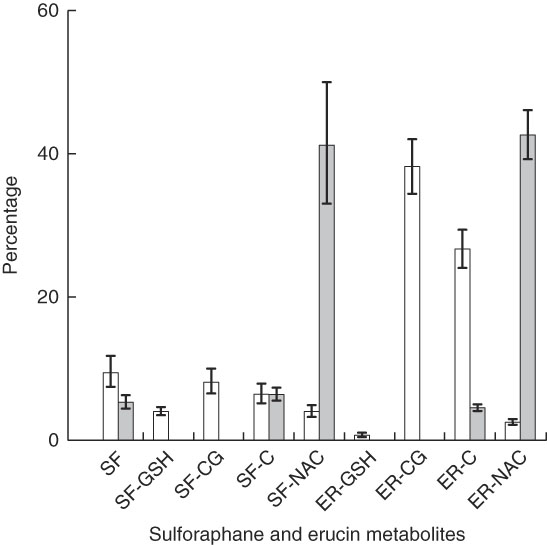
The quantities of individual metabolites of glucoraphanin and glucoerucin in plasma and urine, represented by percentage of total plasma AUC and percentage of total urinary accumulation, respectively, are presented in Fig. 3 for the NB diet. The main effect of diet was nonsignificant, and thus the results were similar for the DB diet (online Supplementary Fig. S3). Although glucoraphanin constituted 94 % of the glucosinolates provided by glucoraphanin+glucoerucin in the broccoli challenge meal, SF and SF metabolites comprised 32 and 34 % of plasma metabolites for the NB and DB diets, respectively, and made up 53 and 54 % of urinary metabolites for the NB and DB diets, respectively. Metabolites measured in plasma were SF, SF-GSH, SF-CG, SF-C, SF-NAC, ER-GSH, ER-CG, ER-C and ER-NAC, of which ER-CG comprised >37 %. In urine, SF-NAC and ER-NAC each comprised >41 % of metabolites, the remainder of which consisted of SF, SF-C, SF-CG and ER-C. SF-CG was <0·1 % of urinary metabolites. Excreted urinary metabolites accumulated over 24 h accounted for 23 % (NB diet) and 21 % (DB diet) of the 103 µm of parent glucosinolates (glucoraphanin and glucoerucin) provided in the broccoli challenge meal (Table 3).
Plasma AUC (over 24 h) and urinary accumulation (over 24 h) of metabolites of glucoraphanin and glucoerucin expressed as the percentage of total AUC and total urinary accumulation, respectively, of subjects who had consumed the diet with no broccoli. Values are least squares means and 95 % CI. SF, sulphoraphane; SF-GSH, sulphoraphane-glutathione; SF-CG, sulphoraphane-cysteineglycine; SF-C, sulphoraphane-cysteine; SF-NAC, sulphoraphane-N-acetylcysteine; ER-GSH, erucin-glutathione; ER-CG, erucin-cysteineglycine; ER, erucin-cysteine; ER-NAC, erucin-N-acetylcysteine. □ , Percentage plasma AUC;
![]() , percentage urinary accumulation.
, percentage urinary accumulation.
Pharmacokinetic data over 24 h and lactulose:mannitol ratio following consumption of a meal of 200 g of broccoli with 20 g of raw daikon radish that had been preceded by either 16 d of a control diet with no broccoli or the same control diet with daily consumption of 200 g of broccoli and 20 g of daikon radish (Least squares means and 95 % confidence intervals; n 9 for each BMI group)
NB, control diet with no broccoli; DB, control diet with daily consumption of 200 g of broccoli and 20 g of daikon radish; M max, maximal plasma mass of metabolites during the 24-h time course; T max, time at which maximal plasma mass occurred during the 24-h time course; k, elimination rate constant; 24-h total, total accumulation of urinary metabolites over 24 h.
* Unadjusted P-values associated with F-tests from (n 18) cross-over ANOVA model effects: treatment, BMI and treatment×BMI; error term df=15.
† Mean value was significantly different on the DB diet compared with the NB diet (P<0·05), determined by ANOVA model linear contrasts.
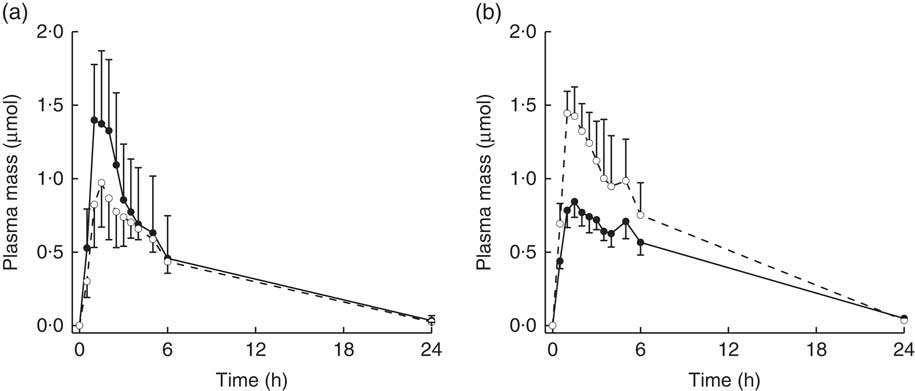
Diet interacted with BMI such that for higher BMI, plasma AUC and M max of total metabolites were higher for subjects on the NB diet compared with the DB diet, whereas for lower BMI plasma AUC and M max were higher for subjects on the DB diet compared with those on the NB diet (Table 3; P=0·0457 for AUC; P=0·0311 for M max; df=15). To illustrate these relationships, mean AUC and mean M max for subjects above and below median BMI (26 kg/m2) are reported in Table 3. Pharmacokinetic data for individual metabolites are presented in online Supplementary Tables S1–S4. The interaction of diet with BMI was statistically significant (P=0·0464; df=279) for the plasma mass of total metabolites over time (Fig. 4) and followed the plasma AUC and M max relationships of higher values for subjects on the NB diet (compared with the DB diet) who had higher BMI and lower values for subjects on the DB diet (compared to NB diet) who had lower BMI. There was no effect of GSTM1 genotype or sex on any variables (data not shown).
Plasma mass (concentration/plasma volume) of total metabolites (sulphoraphane, sulphoraphane-glutathione, sulphoraphane-cysteineglycine, sulphoraphane-cysteine, sulphoraphane-N-acetylcysteine, erucin-glutathione, erucin-cysteineglycine, erucin-cysteine and erucin-N-acetylcysteine) with time for subjects with (a) BMI <26 kg/m2 and (b) BMI >26 kg/m2. Values are least squares means with upper 95 % confidence limits shown above largest mean at a given time and lower 95 % confidence limits shown below smallest mean at a given time. Treatment×BMI was statistically significant (P=0·0464) as determined by ANOVA model linear contrasts.
![]() , Daily broccoli diet;
, Daily broccoli diet;
![]() , no broccoli diet.
, no broccoli diet.
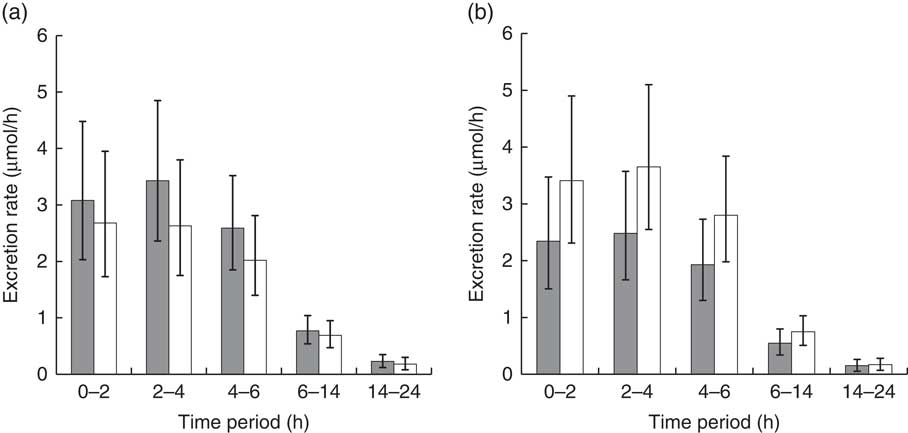
The urinary excretion rates of the sum of SF and ER metabolites generally followed the same trends as levels of plasma metabolites. Although the main effect of diet was nonsignificant, the interaction of diet with BMI was significant at P=0·0154 (Fig. 5; df=108). Urinary excretion rates for subjects with higher BMI were higher on the NB diet compared with the DB diet, and for lower BMI subjects, excretion rates were higher on the DB diet compared with the NB diet. The LM ratio was higher on the DB diet, and there was no relationship with BMI (Table 3).
Urinary excretion rate of total metabolites (sulphoraphane, sulphoraphane-glutathione, sulphoraphane-cysteineglycine, sulphoraphane-cysteine, sulphoraphane-N-acetylcysteine, erucin-glutathione, erucin-cysteineglycine, erucin-cysteine and erucin-N-acetylcysteine) during collection time periods for subjects with (a) BMI <26 kg/m2 and (b) BMI >26 kg/m2. Values are least squares means and 95 % CI. Treatment×BMI was significant (P=0·0154) as determined by ANOVA.
![]() , Daily broccoli diet; □ , no broccoli diet.
, Daily broccoli diet; □ , no broccoli diet.
Discussion
In this study, we investigated whether daily broccoli consumption modifies the metabolism of isothiocyanates and their metabolites as indicated by their levels in plasma and urine. We found that the effect of daily consumption depended on BMI. Following the broccoli challenge meal, the plasma AUC of total metabolites of low BMI subjects (BMI <26 kg/m2) was 17 % higher when on the DB diet than when on the NB diet. In contrast, plasma AUC was 28 % lower in high BMI subjects (BMI >26 kg/m2) on the DB diet compared with the NB diet.
This effect was also reflected by M max of total metabolites, which was increased by 55 % by the DB diet (compared with the NB diet) for low-BMI subjects but decreased by 33 % by the DB diet for high-BMI subjects. M max for SF+SF metabolites followed similar trends (online Supplementary Table S2) and ranged from 0·56 (NB diet) to 0·91 µmol (DB diet) for BMI <26 kg/m2 and from 0·66 (NB diet) to 0·42 µmol (DB diet) for BMI >26 kg/m2. In comparison, M max for plasma SF+SF metabolites in a study providing 200 g of raw broccoli was 0·28 µmol (calculated based on estimated plasma volume of 2·7 litres)( Reference Vermeulen, Klöpping-Ketelaars and van den Berg 20 ). This value is lower than our results and may be explained partly by differing total glucoraphanin amounts; we provided 98 µmol, whereas the cited study provided 61 µmol.
The optimal levels of plasma SF and SF metabolites for conferring health benefits have not been established but likely would depend on the tissue and possible benefit in question. However, pre-clinical studies suggest that the effects of SF and SF metabolites are dose dependent( Reference Juge, Mithen and Traka 37 , Reference Wu, Zhou and Yang 38 ). Thus, the interactive effect of daily broccoli consumption with BMI on plasma levels of SF and SF metabolites may have a corresponding influence on molecular mechanisms related to disease risk.
Evidence is accumulating that repeated intake of some foods may alter the absorption and metabolism of potentially health-promoting phytonutrients. A clinical study showed that daily administration of 800 mg of epigallocatechin gallate for 4 weeks resulted in 60 % greater plasma AUC at the end compared with the start of the study( Reference Chow, Cai and Hakim 39 ). Another clinical study demonstrated not only an effect of repeated intake on flavonoid absorption, but also an effect of BMI. In that study, lean volunteers had a greater plasma flavonoid response after consuming mixed grape polyphenols for 10 d compared with plasma response to a dose given before the 10 d of repeated exposure, whereas obese volunteers showed no adaptation( Reference Novotny, Chen and Terekhov 29 ). Much less is known about how repeated intake of glucosinolate-rich foods affects absorption and metabolism. In one study, 300 ml of liquefied broccoli florets was provided to six volunteers daily for 10 d, and the pharmacokinetic response of plasma SF did not differ between days 1 and 10( Reference Hanlon, Coldham and Gielbert 40 ). Notably, this study did not investigate the relationship of plasma response with BMI.
SF originates from the catabolism of glucoraphanin mediated by plant or gut-bacterial myrosinase and perhaps from the oxidation of ER originating from glucoerucin. SF and ER are metabolised through the mercapturic acid pathway in enterocytes and the liver, beginning with the GST-mediated conjugation of the isothiocyanate with GSH( Reference Baenas, Silván and Medina 41 ). The diet effect we observed in response to BMI may have been driven by mechanisms that altered the fraction of glucosinolates that were converted to isothiocyanates. We considered that prior exposure to SF might up-regulate GST in the enterocyte, thereby enhancing metabolism and secretion back into the gut as has been observed in vivo ( Reference Petri, Tannergren and Holst 42 ), although the relationship of this mechanism to BMI has not been established. Because the gut microbiome varies with BMI( Reference Dominianni, Sinha and Goedert 43 , Reference Haro, Rangel-Zúñiga and Alcalá-Díaz 44 ), it is possible that the interactions of diet with BMI for isothiocyanate metabolite levels reflect interactions in the intestinal microbiota. SF is presumed to be the first metabolite that is generated from glucoraphanin following broccoli intake and is the parent of the thiol conjugates. Therefore, microbial changes altering the generation of SF would be reflected in the sum of all metabolites. For example, changes in gut microbiota with consumption of Brassica vegetables have been reported( Reference Li, Hullar and Schwarz 45 ), and changes in myrosinase-expressing bacteria with daily broccoli consumption could increase the quantity of isothiocyanates available for absorption( Reference Liu, Wang and Hoeflinger 46 ). However, the peak plasma levels of most metabolites were from approximately 1 to 3 h, which is consistent with absorption before the broccoli bolus reaching the colon (Table 3). In contrast, the time of maximum SF levels occurred at approximately 5 h for both NB and DB groups (online Supplementary Table S3), which may be the result of absorption farther down the gastrointestinal tract, either owing to earlier excretion of the GSH complex or to newly metabolised glucoraphanin by the microbiome, leading to release of SF for reabsorption. It is possible that appearance of isothiocyanates in plasma at the later time points was influenced by changes in the capacity of microbiota to hydrolyse glucoraphanin and glucoerucin in the present study. Because the gut microbiome varies with BMI( Reference Dominianni, Sinha and Goedert 43 , Reference Haro, Rangel-Zúñiga and Alcalá-Díaz 44 ), it is possible that the interaction of diet with BMI for isothiocyanate metabolite levels reflects similar interactions in the intestinal microbiota.
Changes in gut transit time induced by daily broccoli feeding may also be a factor causing the observed changes in plasma metabolite levels and urinary excretion of SF and other metabolites. Mean gut transit times are negatively correlated with BMI( Reference Probert, Emmett and Heaton 47 ). Dietary fibre decreases transit time( Reference Anderson, Baird and Davis 48 ) and dietary fibre and transit time independently modify microbiota composition( Reference Chiang, Chiu and Pai 49 – Reference Stephen, Wiggins and Cummings 51 ). Thus, the 16 d of daily broccoli consumption with the additional 5 g/d of dietary fibre (Table 2) above that in the NB diet may have altered gut microbiota such that transit times differed compared with the NB diet. When microbiota were transplanted from healthy humans and individuals with chronic constipation to pseudo-germ-free mice, mice treated with microbiota from slow-transit constipation donors had delayed gastrointestinal transit time compared with healthy controls( Reference Ge, Zhao and Ding 52 ). Thus, both the added fibre and bioactive glucosinolate-derived metabolites( Reference Liu, Wang and Hoeflinger 46 ) of the DB diet may have modified microbial composition and in turn the gut transit time during which metabolites could be absorbed. Interestingly, genistein was more highly absorbed following a single dose of soya milk powder in women with relatively rapid gut transit times( Reference Zheng, Hu and Murphy 53 ), suggesting that at least for the case of genistein, absorption is related to the gut lumenal environment and not simply to the rate of passage.
BMI reflects differences in absorption, distribution and metabolism of a number of dietary components. Fat-soluble nutrients generally are retained in adipose tissue and larger adipose depots may result in reduced elimination rates. β-Carotene and α-tocopherol absorption in healthy overweight subjects consuming extracts of mixed fruits and vegetables and the rates of depletion showed an inverse correlation with general adiposity( Reference Wise, Kaats and Preuss 54 ). In healthy, post-menopausal women, a randomised cross-over study showed that BMI, percentage of body fat and absolute amounts of central and peripheral fat were inversely related to serum folate( Reference Mahabir, Ettinger and Johnson 55 ). Vitamin K levels were positively correlated with adipose tissue and inversely correlated with circulating markers of vitamin K status( Reference Shea, Booth and Gundberg 56 ). Because not all of the glucosinolate dose provided was recovered in 24-h urine, it is possible that some of the SF was retained in adipose tissue, although the water-soluble thiol conjugates likely would not be so retained. However, such a phenomenon does not explain why repeated intake of broccoli changes the plasma pharmacokinetic and urinary excretion responses depending on BMI level, as subjects were weight-stable throughout the study. Greater adiposity has also been associated with greater gut permeability( Reference Yang, Bostick and Tran 57 ), which conceivably could alter plasma and urinary isothiocyanate metabolites. However, the LM ratio, which reflects gut permeability, was not related with BMI and thus did not provide evidence for this explanation.
We note several limitations to this study. One limitation is that because we did not anticipate that treatment would interact with BMI we did not conduct measurements of body fat percentage by dual-energy X-ray absorptiometry and therefore could not determine whether the contribution of BMI was more precisely a result of body fat. A second limitation is that the fibre content of the NB diet was not matched to that of the DB diet, and the difference in fibre may have had a role in the absorption of glucosinolate metabolites. A third limitation is that we did not use fresh broccoli in this study, as might be more generally applicable to dietary eating patterns. To ensure homogeneity of the broccoli throughout the study, we procured a single batch of frozen broccoli and used daikon radish as the myrosinase source. Subjects consumed slightly more food on the DB diet compared with the NB diet. The average energy content in a pound of body weight is approximately 14644 kJ. The added energy from the 200 g of broccoli and 20 g of daikon radish totalled 301 kJ/d. Over 16 d of feeding before the broccoli pharmacokinetic challenge meal, 301 kJ/d is equivalent to 4820 kJ over the study period, which is about one-third the energy in a pound of body weight. The average human weighs around 80 kg (approximately 176 lbs); 1/3 lb is only 0·2% of 176 lbs and thus is insignificant compared with 176 lbs. We believe it is highly unlikely that this affected the results. Finally, we report P values unadjusted for multiplicity, based on post hoc power analyses indicating that FDR q-values from duplicate (thirty-six subjects) analyses were consistent with unadjusted P value results from the original eighteen subjects.
In conclusion, plasma and urinary levels of SF and mercapturic acid pathway products of SF and ER following a broccoli challenge meal were altered when preceded by 16 d of daily broccoli ingestion, and the effect depended on BMI. These results point towards the need for, and the challenge of, developing individualised dietary recommendations for consumption of broccoli and perhaps other Brassica vegetables. Where adaptation to daily broccoli consumption resulted in decreased plasma and urinary response (e.g. those with higher BMI), more research is needed to determine whether regular broccoli consumption resulting in lower levels of isothiocyanate metabolites after each meal is more beneficial than infrequent consumption resulting in higher levels after an occasional broccoli meal.
Acknowledgements
The authors thank Dawn J. Harrison and Meredith A. Capuco for conducting the analytical analyses.
This work was supported by the United States Department of Agriculture (USDA) (J. A. N., 8040-51000-056-00D) and the National Cancer Institute (ACN16003).
The authors’ contributions are as follows: C. S. C., J. A. N., E. H. J., H. E. S. and S. A. R. designed the research; C. S. C. and J. A. N. conducted the research; B. T. V. performed the statistical analysis; C. S. C. wrote the paper and had primary responsibility for the final content. All authors approved the final version of the manuscript.
The authors declare that there are no conflicts of interest.
The mention of trade names or commercial products in this publication is solely for the purpose of providing specific information and does not imply recommendation or endorsement by the USDA. The USDA is an equal opportunity provider and employer.
Supplementary material
For supplementary material/s referred to in this article, please visit https://doi.org/10.1017/S0007114518002921


