


Uric acid is the ultimate product of purine metabolism in humans. Hyperuricaemia occurs when serum uric acid level exceeds the normal level. As a precursor of gout symptoms(Reference Luk and Simkin1), hyperuricaemia is also associated with the development of hypertension(Reference Wang, Qin and Chen2), CVD(Reference Feig, Kang and Johnson3,Reference Kodama, Saito and Yachi4) , type II diabetes(Reference Sluijs, Beulens and van der5), metabolic syndrome(Reference Zhang, Lou and Meng6) and premature deaths(Reference Cohen, Kimmel and Neff7). The current prevalence of hyperuricaemia ranges from 8·9 to 24·4 % in different populations(Reference Zhu, Pandya and Choi8–Reference Uaratanawong, Suraamornkul and Angkeaw11). Nevertheless, the aetiology of hyperuricaemia remains unknown.
Besides genetic variations(Reference Kuo, Grainge and Zhang12,Reference Ebrahimpour-Koujan, Saneei and Larijani13) and environmental factors(Reference Boyle, Greig and Jasani14), several dietary factors have been associated with hyperuricaemia(Reference Kuo, Grainge and Zhang12). Purine-rich foods(Reference Choi, Liu and Curhan15–Reference Richette and Bardin17), alcohol(Reference Rai, Fung and Lu18) and even high fructose and sugar-sweetened beverages(Reference Choi, Willett and Curhan19,Reference Choi and Curhan20) may definitively increase the risk of hyperuricaemia(Reference Emmerson21). The intakes of some antioxidant nutrients, including vitamin C(Reference Bae, Shin and Chun22–Reference Sun, Sun and Wang24), vitamin E(Reference Onyesom, Uzuegbu and Nwangwa25) and Zn(Reference Zhang, Liu and Qiu26), are negatively associated with hyperuricaemia. The common mechanism of lowering uric acid level was because of the antioxidant property of these nutrients which could reduce oxidative stress and further decrease uric acid synthesis(Reference Gao, Curhan and Forman23,Reference Zhang, Liu and Qiu26) . Vitamin A, also called retinol, is a potent exogenous antioxidant for humans(Reference Goodman27,Reference Imam, Zhang and Ma28) that is presumed to be linked to uric acid metabolism. Several studies aimed to assess the relationship between dietary retinol intake and hyperuricaemia with inconsistent results. A Korean study revealed that subjects with hyperuricaemia had lower retinol intakes than controls(Reference Ryu, Kang and Kim29). However, a previous study conducted to compare data from two cohorts of homogenous ethnicity but different food traditions (Australia and Norway)(Reference Zykova, Storhaug and Toft30) revealed that retinol intake was positively associated with the uric acid level in the Australian cohort, although this association was not significant in the Norwegian cohort. In a cross-sectional survey in Taiwan, retinol intake was not significantly associated with hyperuricaemia(Reference Yu, See and Huang31). Thus, the limited evidences associating retinol intake with hyperuricaemia are controversial and need to be further assessed.
To our knowledge, previous studies on the associations of dietary retinol intake and hyperuricaemia have less stratified evidence when retinol intakes from animal food and plant food were referred to. Additionally, no known studies have investigated the dose–response relationship. Therefore, the current study aimed to assess the associations and dose–response relationship between risk of hyperuricaemia and dietary intakes of total, animal-derived and plant-derived retinol among the US adult population using data from the National Health and Nutrition Examination Survey (NHANES) 2009–2014.
Methods
Study populations
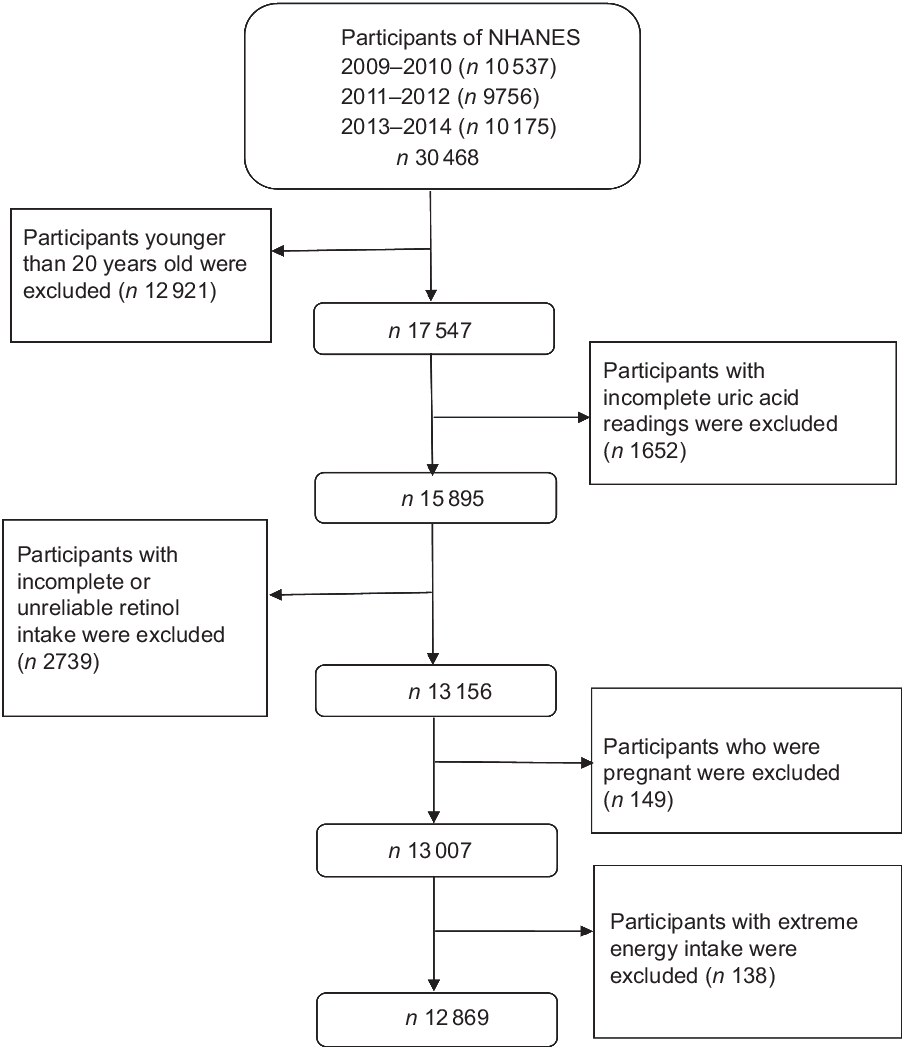
In this cross-sectional study, data were gathered from three 2-year cycles (2009–2014) of NHANES. A stratified, multistage sampling design was used to produce a sample that represented American civilians of the non-institutionalised population(Reference Choi, Ford and Curhan32). The programme covers clinical, physical, laboratory and interviews to obtain dietary and health indicators. NHANES participants are first interviewed at home and then undergone a health check at the mobile examination centre. More details of this study design are available on the NHANES official website(33). Overall, 30 468 individuals participated in the NHANES during 2009–2014. Our analyses were limited to 17 547 individuals aged ≥20 years. We excluded 1652 participants with incomplete uric acid results, 2739 with incomplete or unreliable 24-h recall data, 149 pregnant women and 138 with total energy intake >mean + 3 sd (18 853·104 kJ) or <mean − 3 sd (0 kJ). Finally, 12 869 subjects (6158 men and 6711 women) were included (Fig. 1).
Flow chart showing the population selection of the study. NHANES, National Health and Nutrition Examination Survey
Measures
Hyperuricaemia was defined as serum uric acid level ≥7·0 and ≥6·0 mg/dl in men and women, respectively. The method of detecting serum uric acid level was described elsewhere(Reference Sun, Sun and Wang24); serum uric acid concentration was detected on a Beckman Synchron LX20 or Beckman UniCel® DxC800 Synchron after oxidisation with the specific enzyme uricase to form allantoin and H2O2. The detailed measurement methods for weight and height are available in https://wwwn.cdc.gov/nchs/data/nhanes/2011-2012/manuals/Anthropometry_Procedures_Manual.pdf. The detailed measurement methods for blood pressure are available in https://wwwn.cdc.gov/Nchs/Nhanes/2011-2012/BPX_H.htm; Dietary vitamin A intake in retinol activity equivalents (mcg) was the main measure of retinol intake and was calculated through two 24-h dietary recall interviews. The first dietary recall interview was collected in-person in the mobile examination centre, and the second interview was collected by telephone 3–10 d later. Sources of dietary retinol were identified using US Department of Agriculture Food and Nutrient Database for Dietary Studies (2009–2010, 2011–2012 and 2013–2014, respectively). Intakes of animal-derived retinol (milk and milk products; meat, poultry, fish and mixtures; eggs) and plant-derived retinol (legumes, nuts and seeds; grain products; fruits; vegetables; fats, oils and salad dressings; sugars, sweets and beverages) were calculated according to the food code. As for ‘animal-derived retinol’, 1 mcg retinol activity equivalents = 1 mcg all-trans retinol from animal foods. To calculate retinol activity equivalents for ‘plant-derived retinol’, we used the equation: retinol activity equivalents for plant-derived retinol (mcg) = 1/12 beta carotene (mcg) + 1/24 other provitamin A (mcg).
Covariates
Based on the literatures and the assessed correlations in our data, the following factors that correlated with hyperuricaemia and retinol intakes were included to control for potential effects of confounding: age, gender, race (Mexican American, other Hispanic, non-Hispanic White, non-Hispanic black and others), educational background (<high school, high school and >high school), BMI, smoking status (smoking at least 100 cigarettes in life or not), drinking status (having at least twelve alcohol drinks/year or not), total energy intake, vitamin C intake, dietary fibre intake, Mg intake, levels of total cholesterol, hypertension status (mean systolic blood pressure ≥130 mmHg or diastolic blood pressure ≥80 mmHg(Reference Whelton, Carey and Aronow34) or self-reported physician diagnosis) and diabetes status (fasting blood sugar level ≥7·0 mmol/l or 2-h plasma glucose level ≥11·1 mmol/l or taking anti-diabetic pills or insulin).
Statistical analyses
All statistical analyses were conducted using Stata 15.0. To carry out nationally representative estimates, appropriate sampling weights, primary sampling units and stratified information were considered in the study. Following the NHANES analysis guide available on the NHANES website (https://wwwn.cdc.gov/nchs/nhanes/tutorials/module3.aspx), the new 6-year sample weight was created using one-third of the 2-year dietary weighted. Baseline characteristics of the participants with and without hyperuricaemia were compared with respect to gender. The continuous variables were presented as mean ± sd, and the categorical variables were presented as participants (percentage). χ 2 tests and Student’s t test were used to examine the differences in percentages and means, respectively. We also performed univariate and multivariate logistic regression analyses to estimate OR (95 % CI) of hyperuricaemia according to quintiles of dietary retinol intake. The lowest quintile of dietary intake was used as the reference. In the multivariate logistic regression analysis, model 1 was adjusted for age and gender and model 2 was adjusted for age, gender, race, BMI (continuous), smoking status, drinking status, education background, hypertension status, diabetes status, total energy intake, vigorous activities, total cholesterol, vitamin C intake, dietary fibre intake and Mg intake. The dose–response relationship was assessed using restricted cubic spline functions with three knots located at the 5th, 50th and 95th percentiles of the exposure distribution in the multivariate-adjusted model 2. In addition, we calculated sex-specific quintiles for the retinol intake; stratified analyses were performed based on genders (men and women) to evaluate the association between retinol intake and hyperuricaemia. All P values were two-sided, and P < 0·05 is considered statistically significant.
Results
In 12 869 participants (47·85 % was men), the mean values of age, BMI and retinol intake were 49·62 (sd 17·49) years, 29·20 (sd 6·94) kg/m2 and 618·18 (sd 543·59) mcg/d, respectively. Serum uric acid level was 5·42 mg/dl (6·07 and 4·84 mg/dl in men and women, respectively). The prevalence of hyperuricaemia was 19·35 % (22·32 and 16·67 % in men and women, respectively). The baseline characteristics of the study population according to hyperuricaemia status are presented in Table 1. Compared with controls, participants with hyperuricaemia tended to be older, non-Hispanic black and smoke at least 100 cigarettes in life and were more likely to have hypertension, diabetes, higher BMI, total cholesterol levels, lower total energy intake, vigorous activity and retinol intake (all P values < 0·05). Additionally, the characteristics of the study population according to quintiles of retinol intake are shown in Appendix 1 in supplementary material.
Characteristics of participants with or without hyperuricaemia, US adults aged ≥20 years, National Health and Nutrition Examination Survey (NHANES) 2009–2014†
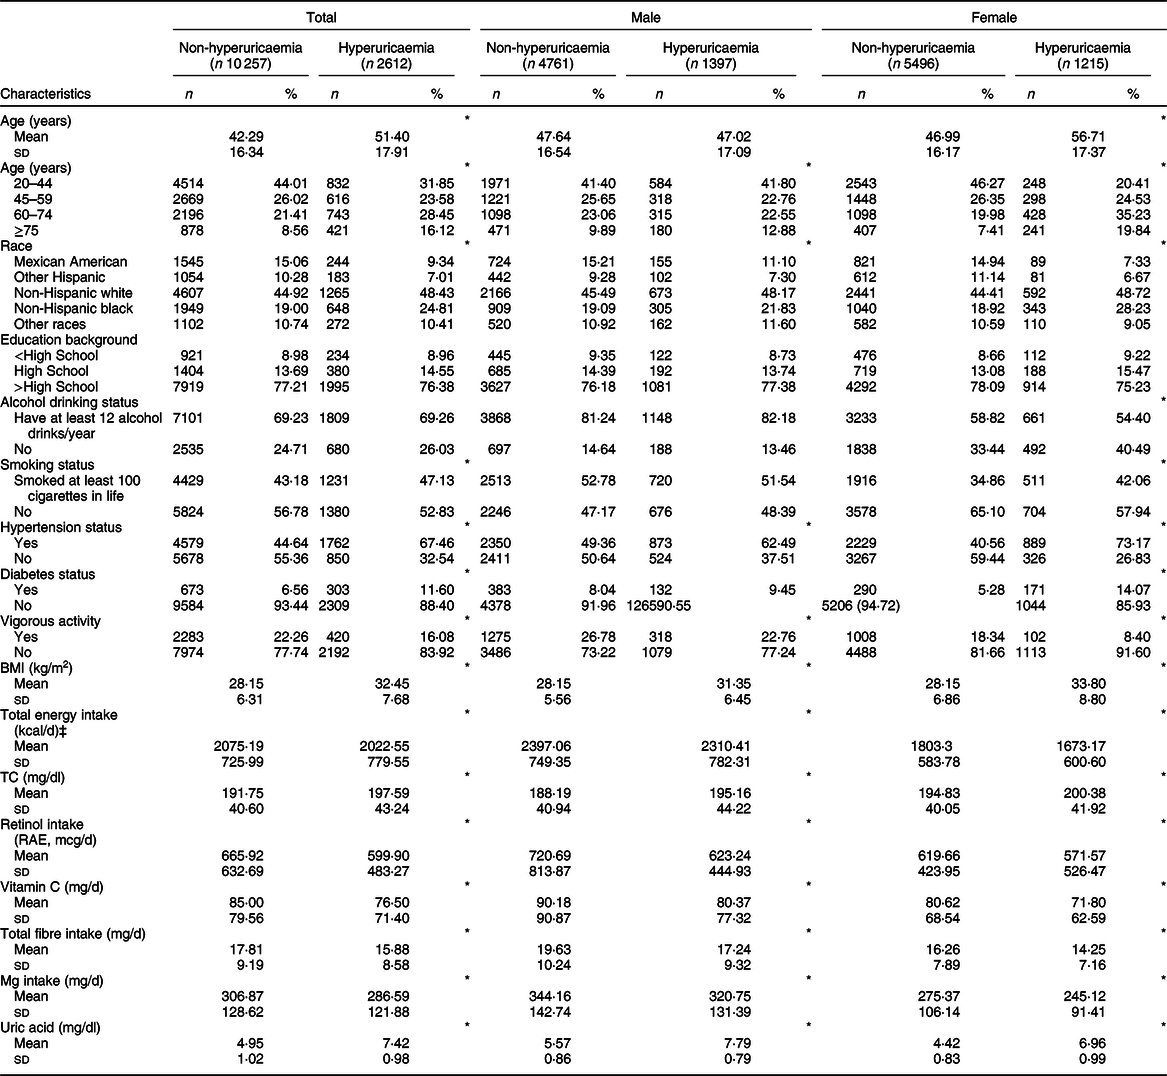
TC, total cholesterol; RAE, retinol activity equivalents.
† Data are presented as mean and standard deviation for continuous variables or participants (percentage) for categorical variable.
‡ To convert kcal into kJ, multiply it by 4·184.
*P < 0·05.
The weighted OR (95 % CI) of hyperuricaemia based on the quintiles of total, animal-derived and plant-derived retinol intakes are shown in Table 2. In the univariate logistic regression analyses, for the highest v. lowest quintiles, intakes of total retinol (0·62, 95 % CI 0·51, 0·75), animal-derived retinol (0·82, 95 % CI 0·69, 0·97) and plant-derived retinol (0·64, 95 % CI 0·54, 0·76) were all inversely associated with the risk of hyperuricaemia. After adjustment for age and gender (model 1), the results remained unchanged. After further adjustment for race, BMI, smoking status, drinking status, education background, hypertension status, diabetes status, total energy intake, vigorous activities, total cholesterol, vitamin C intake, dietary fibre intake and Mg intake (model 2), the OR of quintile 5 of intake of total, animal-derived and plant-derived retinol were 0·71 (95 % CI 0·52, 0·96), 0·76 (95 % CI 0·59, 0·96) and 0·92 (95 % CI 0·72, 1·17), respectively. The association between retinol intake and hyperuricaemia in stratified analyses by gender is shown in Table 3. For the highest v. lowest quintiles, the OR (95 % CI) of hyperuricaemia were 0·61 (95 % CI 0·47, 0·78) for men and 0·63 (95 % CI 0·50, 0·80) for women. After adjustment for age (model 1), the OR (95 % CI) of hyperuricaemia were 0·61 (95 % CI 0·47, 0·79) for men and 0·51 (95 % CI 0·40, 0·66) for women. After further adjustment for multiple covariates (model 2), the OR (95 % CI) of hyperuricaemia were 0·68 (95 % CI 0·48, 0·95) for men and 0·68 (95 % CI 0·46, 1·01) for women. After excluding participants with hypertension or diabetes, a total of 5871 individuals were included in the final analysis. We re-assessed the association between retinol intake and hyperuricaemia; the association remained unchanged after further adjustment for multiple covariates (Appendix 2 in supplementary material).
Weighted OR (95 % CI) of hyperuricaemia across quintiles of retinol intake, National Health and Nutrition Examination Survey (NHANES) 2009–2014†
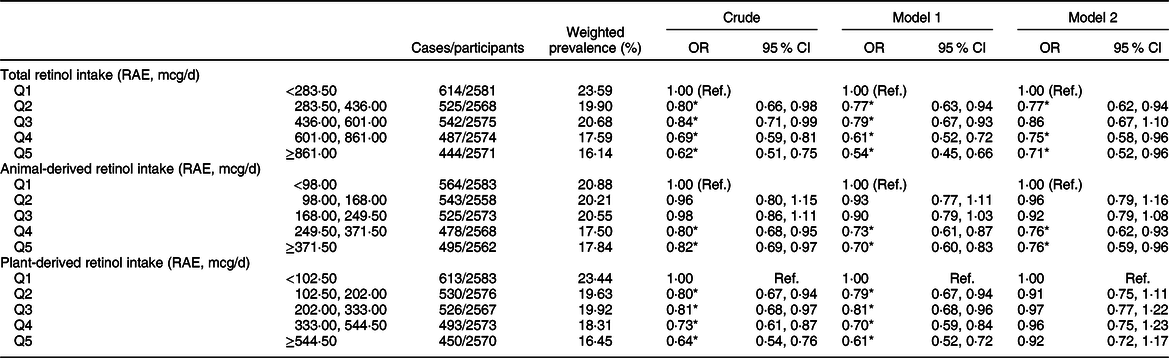
RAE, retinol activity equivalents.
† Model 1: adjusted for age, gender. Model 2: adjusted for age, gender, race/ethnicity, BMI, smoking status, drinking status, education background, hypertension status, diabetes status, total energy intake, vigorous activities, total cholesterol, vitamin C intake, dietary fibre intake and Mg intake. Results are survey-weighted.
*P < 0·05.
Weighted OR (95 % CI) of hyperuricaemia across quintiles of retinol, stratified by gender, National Health and Nutrition Examination Survey (NHANES) 2009–2014†
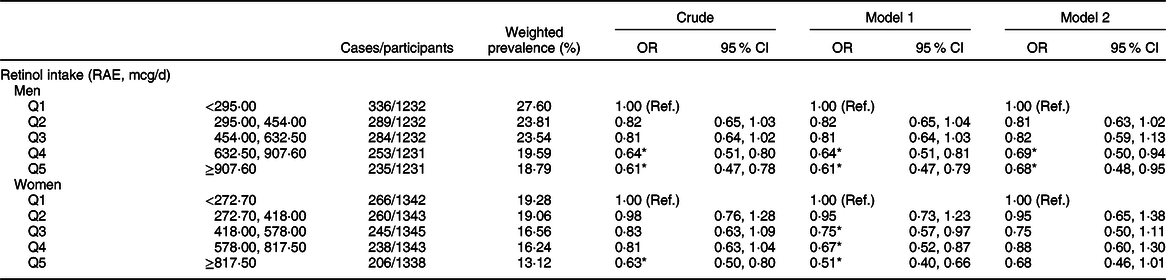
RAE, retinol activity equivalents.
† Model 1: adjusted for age. Model 2: adjusted for age, race/ethnicity, BMI, smoking status, drinking status, education background, hypertension status, diabetes status, total energy intake, vigorous activities, total cholesterol, vitamin C intake, dietary fibre intake and Mg intake. Results are survey-weighted.
*P < 0·05.
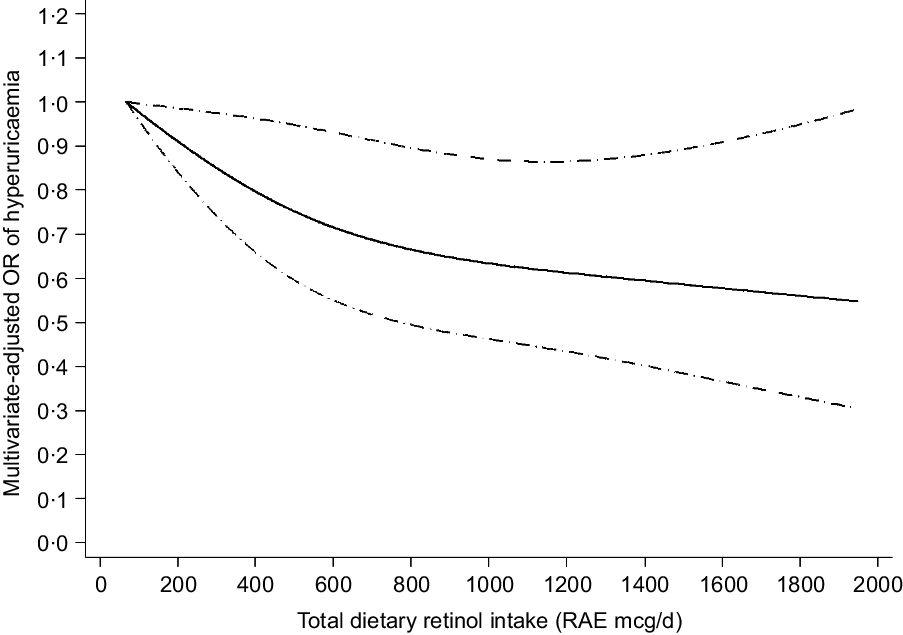
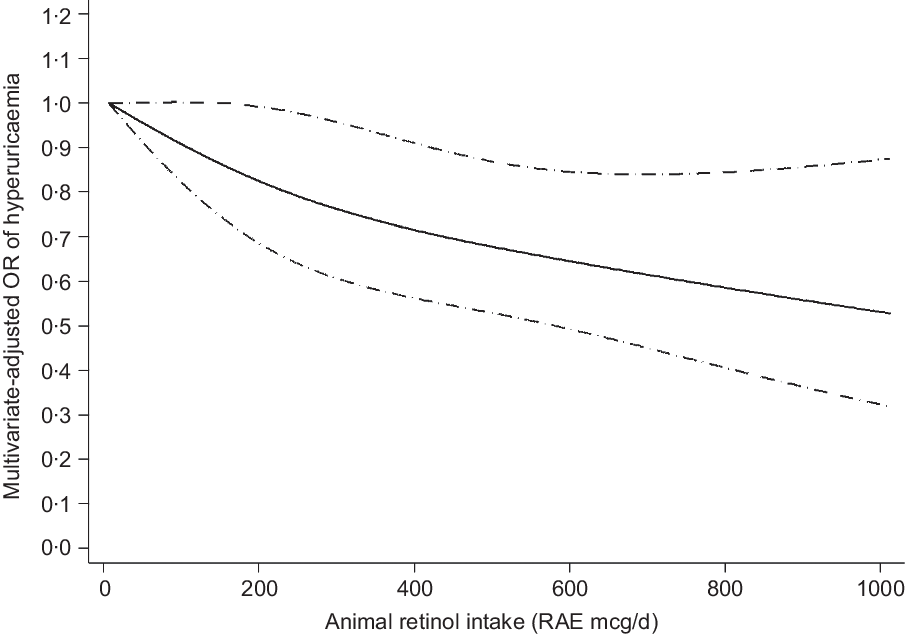
The results of the dose–response relationship analysis between dietary retinol intake and risk of hyperuricaemia are shown in Figs 2 and 3. Using the restricted cubic spline model, a linear negative association between total dietary retinol intake and hyperuricaemia was found (P for nonlinearity = 0·235). As the total dietary retinol intake increased, the OR of hyperuricaemia decreased. Dietary total retinol intake showed significant inverse association with the odds of hyperuricaemia when the intake of total retinol reached 115 mcg/d (OR 0·97, 95 % CI 0·94, 0·99). Similarly, animal-derived retinol intake also had a liner negative association with hyperuricaemia when the intake of animal-derived retinol reached 187 mcg/d (OR 0·83, 95 % CI 0·70, 0·99).
Linear dose–response relationship between retinol intake and hyperuricaemia, P for nonlinearity = 0·235. The lowest intake level (67 mcg/d) was used as the reference group. Adjusted for age, gender, race/ethnicity, BMI, smoking status, drinking status, education background, hypertension status, diabetes status, total energy intake, vigorous activities, total cholesterol, vitamin C intake, dietary fibre intake and Mg intake. The solid line and dashed line represent the estimated OR and its 95 % CI, respectively. RAE, retinol activity equivalents
Linear dose–response relationship between animal-derived retinol intake and risk of hyperuricaemia, P for nonlinearity = 0·510. The lowest intake level (7 mcg/d) was used as the reference group. Adjusted for age, gender, race/ethnicity, BMI, smoking status, drinking status, education background, hypertension status, diabetes status, total energy intake, vigorous activities, total cholesterol, vitamin C intake, dietary fibre intake and Mg intake. The solid line and dashed line represent the estimated OR and its 95 % CI. RAE, retinol activity equivalents
Discussion
In this national representative population study, total retinol intake was inversely associated with the risk of hyperuricaemia in both genders of the US adult population. After adjustment for multiple covariates (age, gender, race/ethnicity, BMI, smoking status, et al.), the association remained significant in men. Interestingly, we found a linear trend towards intake of animal-derived retinol and the risk of hyperuricaemia.
Several studies have examined the association between retinol intake and hyperuricaemia. Similar to our results, a Korean study revealed that patients with hyperuricaemia had a lower intake of retinol than controls(Reference Ryu, Kang and Kim29). Additionally, a cross-sectional study conducted in two Caucasian cohorts proposed that retinol intake was positively associated with the risk of hyperuricaemia for women without abdominal obesity among Australian subjects, whereas even no correlation was observed among Norwegian subjects(Reference Zykova, Storhaug and Toft30). In a cross-sectional survey in Taiwan, retinol intake was not significantly associated with hyperuricaemia. Several factors may account for the inconsistent results. First, the participants in our analysis were adults aged ≥20 years, and pregnant women were excluded, whereas the subjects in the Taiwan study were aged 4–96 years. Second, based on a previous study(Reference Yu, See and Huang31), there was significant difference in retinol intakes when calculated by a semi-quantitative FFQ compared with two 24-h diet recall survey. Retinol intakes were calculated using a semi-quantitative FFQ in the above Caucasian studies, whereas 24-h dietary recall interviews were used in our study. Finally, ethnic background and differences in dietary patterns might also contribute to the inconsistent results. Moreover, a previous cross-sectional study proposed that serum retinol level was positively associated with the risk of hyperuricaemia in the Third NHANES(Reference Choi, Ford and Curhan32). Further studies are needed to clarify the differences.
The biological mechanism underlying the association between retinol intake and hyperuricaemia remains poorly understood. The underlying mechanism could be that retinol intake modulates serum uric acid via antioxidant and anti-inflammatory mechanism. Uric acid may function as a pro-oxidant in hyperuricaemia, despite acting as an antioxidant under physiological conditions(Reference Kadowaki, Sakaguchi and Miyamoto35). Retinol has well-established antioxidant properties and has the potential to retard the oxidative process(Reference Goodman27). Several studies suggested that hyperuricaemia was positively associated with serum C-reactive protein, inflammatory cytokines IL-6 and TNF-α levels, which were generally viewed as biomarkers of inflammation(Reference Lyngdoh, Marques-Vidal and Paccaud36–Reference Ruggiero, Cherubini and Ble38). The reversed relationship was also reported between retinol status and inflammatory response(Reference Sauer, Hooser and Sipes39,Reference Swamidas, Basaraba and Baybutt40) . In a cross-sectional study, retinol-rich foods significantly reduced inflammation in peritoneal dialysis patients(Reference Martin-del-Campo, Batis-Ruvalcaba and Gonzalez-Espinoza41). Therefore, retinol intake reduced oxidative stress and inflammatory response and further decreased uric acid synthesis, thereby providing a potential mechanism for retinol to reduce the risk of hyperuricaemia(Reference Hayden and Tyagi42).
In our study, intake of animal-derived retinol was inversely associated with hyperuricaemia among US adults. Currently, available studies on the associations between different sources of dietary retinol intake and hyperuricaemia are very limited. Therefore, the underlying mechanism remains undetermined. A possible explanation may be that the absorption of retinol from animal sources is relatively more effective and not affected by food substrate(Reference van Vliet, Boelsma and de Vries43), while the bioavailability of retinol from plant sources is greatly affected by food substrate(Reference Edwards, You and Swanson44–Reference Hickenbottom, Follett and Lin47). Additional research is needed to elucidate the relationship between animal-derived retinol intake and the risk of hyperuricaemia.
Our study has several strengths. First, the large nationally representative sample increased the statistical power for assessing the relationship between retinol intake and the risk of hyperuricaemia. Second, we explored the dose–response relationship of retinol intake with the risk of hyperuricaemia. Finally, the association between various sources of dietary retinol intake and hyperuricaemia was examined for the first time.
Notably, our study also has some limitations. First, because of the cross-sectional study design, addressing the causal interpretations of the relationship between retinol intake and risk of hyperuricaemia is unfeasible and thus adds only limited information to the overall question how dietary retinol is associated with hyperuricaemia. Simultaneously, dietary retinol intake was calculated by two 24-h diet recall survey, which may not have accurately reflected an individual’s usual dietary intake. In addition, we could not exclude the possibility of residual confusion owing to unmeasured confounding factors.
Conclusion
Intakes of total and animal-derived retinol were inversely associated with hyperuricaemia among US adults. Furthermore, large prospective cohort studies need to be performed to support our findings.
Acknowledgements
Acknowledgements: The authors would like to thank all subjects, investigators and study personnel who participated in this study. Financial support: This work was supported by the grant from the Natural Science Foundation of China (no. 81703206) and China Postdoctoral Science Foundation (no. 2015M580575). Conflicts of interest: The authors declare no conflicts of interest. Authorship: P.Z. and Y.S. designed the research; P.Z. and J.S. conducted and wrote the manuscript; P.Z., J.S., Y.G., M.H. and F.Y. analysed and interpreted the data; Y.S. was primarily responsible for the final content; and all authors read and approved the final manuscript. Ethics of human subject participation: This study was conducted according to the guidelines laid down in the Declaration of Helsinki, and all procedures involving human subjects were approved by the Research Ethics Review Board of National Center for Health Statistics. All participants provided written informed consent both before the interview and examination stages. The security, anonymity and privacy of the participants were strictly respected.
Supplementary material
For supplementary material accompanying this paper visit https://doi.org/10.1017/S1368980020000324


