


Vitamin A deficiency (VAD) is a major public health concern worldwide, especially in low-income and middle-income countries(Reference Wirth, Petry and Tanumihardjo1). VAD leads to increased risk of a series of problems of children, including diarrhoea, measles, vision problems, impaired immune functions and anaemia(Reference Schultink2). VAD was widely prevalent in Sub-Saharan Africa and South Asia(Reference Stevens, Bennett and Hennocq3). Furthermore, VAD has become one of the leading causes of preventable childhood blindness, affecting approximately 250 million preschool children(4,Reference Gogate, Kalua and Courtright5) . Numerous studies have proved that vitamin A is an essential contributor to the visual system(Reference Uchida, Hayashi and Kuroki6,Reference Perusek and Maeda7) . Xerophthalmia, the typical and specific disorder of VAD, contains the clinical spectrum of ocular manifestations of VAD(Reference Akhtar, Ahmed and Randhawa8). Lack of vitamin A leads to an array of ocular manifestations like night blindness, Bitot’s spots, corneal ulcerations and lesions(Reference Smith and Steinemann9). Some studies have demonstrated that VAD was associated with socio-cultural limitations, inadequate dietary intake and insufficient absorption(Reference Changezi and Lindberg10). Universal periodic distribution of vitamin A to children in areas with a high incidence of VAD can reduce childhood mortality by 5-15 %(Reference Awasthi, Peto and Read11,Reference Imdad, Mayo-Wilson and Herzer12) .
VAD was one of the most important causes of childhood severe vision impairment and blindness in many countries like India(Reference Titiyal, Pal and Murthy13), Ethiopia(Reference Kello and Gilbert14), Indonesia(Reference Sitorus, Abidin and Prihartono15) and Bangladesh(Reference Muhit, Shah and Gilbert16). Visual impairment (VI) caused by VAD predisposes children to xerophthalmia, increases the risk of blindness and childhood mortality and impacts a considerable economic burden(Reference Smith and Steinemann9,Reference Sherwin, Reacher and Dean17,Reference Wang, Congdon and Bourne18) . The health loss associated with VAD was calculated by years lived with disability (YLD) in the Global Burden of Disease (GBD) Study 2017, contributing to 8313·0 (95 % uncertainty interval [UI] 5398·6–12150·6) thousand YLD(19). In the GBD 2017 study, blindness and vision impairment was the third leading impairment after anaemia and hearing loss, which affected 1·34 billion (95 % UI 1·29–1·39) people(19). Totally, 48·3 million people were blind, and 39·6 million people had severe vision loss (SVL). Moreover, 279·3 million people had moderate vision loss (MVL) in 2017. The vision-related health loss due to VAD is worth more attention in reducing the progression of avoidable blindness.
However, there is a relative lack of comprehensive research on the trends of global vision loss burden caused by VAD in the last decades. Identifying the patterns of VAD vision loss would be essential to improve the decision-making of health care plans. In this study, we aimed to analyse the prevalence and YLD of vision loss attributed to VAD by year, sex, age and socio-economic status at the global, regional and national levels using comprehensive data of the GBD 2017 study.
Methods
Data sources
The GBD category of vitamin A deficiency is defined by the International Classification of Diseases (ICD)-10 code E50. The GBD 2017 study collected data from typical surveys from 195 countries and territories grouped in twenty-one regions and seven super-regions based on 354 diseases and injuries. The GBD group quantified vision loss by age, sex and region over time, using estimated prevalence and YLD metrics(Reference Murray, Vos and Lozano20). Methods to calculate YLD estimates in the GBD 2017 study were reported(19,21,22) . Prevalence is the total number of cases in a specified population at a designated time. The YLD are years of life with any short-term or long-term health loss.
The GBD 2017 study used DisMod-MR 2.1, a Bayesian meta-regression tool, to estimate these metrics for each health loss condition. GBD 2017 extracted data of VAD from the WHO Vitamin and Mineral Nutrition Information System, health surveys such as Demographic and Health Survey and Multiple Indicator Cluster Surveys and studies identified through literature review(19). According to the definition of GBD 2017, VAD is defined as serum retinol concentration lower than 0·7 μmol/l(19). Blindness and vision loss due to VAD are associated with corneal ulcerations and corneal scars(19). The researchers estimated the coverage of vitamin A supplementation and then used the supplementation estimates as a location-level covariate to guide prevalence estimates of vision loss due to VAD. Vision loss due to VAD is divided into MVL, SVL and blindness. The MVL due to VAD has vision problems that make it difficult to recognise faces or subjects across a room. The SVL due to VAD has SVL, which caused difficulty in daily activities, some emotional impact (for example worry) and some difficulty going outside the home without assistance. The blindness due to VAD is completely blind, which caused difficulty in daily activities, worry and anxiety and great difficulty going outside the home without assistance(19).
We extracted data from the Global Health Data Exchange(23) based on GBD 2017 study, including 1. global total and sex-specific vision loss burden due to VAD, containing age-standardised prevalence and YLD rates from 1990 to 2017; 2. age-specific prevalence and YLD rates by SVL, MVL and blindness in 2017; 3. age-standardised YLD rates in seven super regions and twenty-one GBD regions in 1990 and 2017; 4. national age-standardised YLD rates in 195 countries in 1990, 1995, 2000, 2005, 2010, 2015 and 2017; 5. Age-standardised prevalence and YLD rates of fifteen most common vision loss causes in 1990 and 2017. Ethics approval and informed consent were not required for the current study because of public accessibility to the data.
We estimated the VAD vision loss of three extended categories of VI (MVL, SVL and blindness) from the GBD 2017 study in this study. MVL was defined as visual acuity (VA) < 6/18 but ≥ 6/60, SVL was defined as VA < 6/60 but ≥ 3/60 while the blindness definition was VA < 3/60 or visual field around central fixation < 10 % according to the Snellen chart(Reference Bourne, Stevens and White24,Reference Stevens, White and Flaxman25) .
Socio-economic status
The human development index (HDI) is a composite indicator of health, education and income. HDI ranges from 0 to 1, with a higher value indicating a higher level of socio-economic development. We took the HDI data in 1990, 1995, 2000, 2005, 2010, 2015 and 2017 from the Human Development Report 2018, published by the United Nations Development Programme(26). Countries were categorised into four socio-economic groups: low (HDI < 0·550), medium (0·550–0·699), high (0·700–0·799) and very high (HDI ≥ 0·800).
Health inequalities
We use the concentration index (CI) and the Gini coefficient to quantify the health inequalities in this study. The CI is used to explore the socio-economic-related inequalities, ranging from –1 to 1(Reference Costa-Font and Hernández-Quevedo27). A value of 0 for CI indicates the absence of inequality linked to socio-economic conditions. A positive (negative) value of the CI suggests that the vision loss burden of VAD is more concentrated in countries with high (low) levels of socio-economic status. The Gini coefficient is a widely used measure of the magnitude of inequality based on the Lorenz Curve(Reference Skaftun, Verguet and Norheim28). The Gini coefficient ranges from 0 (perfect equality) to 1 (perfect inequality)(Reference Lou, Wang and Xu29). In this study, the CI was calculated by national age-standardised YLD rates of vision loss burden due to VAD and the corresponding HDI to measure the vision loss inequality associated with socio-economic characteristics. The Gini coefficient was calculated by the age-standardised YLD rates of the vision loss burden of VAD of 195 countries from 1990 to 2017 to discover the trends in between-country inequality. The CI was calculated by the CONCINDC module, while the INEQQERR module calculated the Gini coefficient by STATA 15 (Stata Corporation).
Statistical analysis
All statistics were presented as values with 95 % UI. Paired Wilcoxon test assessed the comparisons of age-standardised prevalence and YLD rates among males and females. Pearson correlation and linear regression analyses tested the association of national age-standardised YLD rates and HDI. SPSS 23.0 Statistical software (IBM Corporation) and Prism Software Version 8 (GraphPad Software) conducted the analysis. Two-sided P values of < 0·05 were considered statistically significant.
Results
Global burden of vision loss due to vitamin A deficiency by year and age
After controlling the effect of population and age structure, age-standardised prevalence rates for vision loss due to VAD rose by 9·2 %, from 68·8 (95 % UI 54·7–86·8) per 100 000 population in 1990 to 75·1 (95 % UI 59·7–94·8) per 100 000 population in 2017 (Fig. 1a). Similarly, global age-standardised YLD rates increased by 10·8 %, from 3·7 (95 % UI 2·3–5·4) per 100 000 population in 1990 to 4·1 (95 % UI 2·7–6·1) per 100 000 population in 2017 (Fig. 1b). From 2014, the age-standardised prevalence and YLD rates showed a downward trend. Age-standardised prevalence and YLD rates by year and sex were available for only 120 countries. Paired Wilcoxon test revealed no significant sex disparities in age-standardised prevalence and YLD rates of VAD burden in 120 countries for each year.
Global burden of vision loss due to VAD by year and age. (a) Age-standardised prevalence rate from 1990 to 2017; (b) age-standardised YLD rate from 1990 to 2017. ![]() , Female;
, Female; ![]() , Total;
, Total; ![]() , Male. (c) age-specific prevalence rate by vision loss severity categories (MVL, SVL and blindness) in 2017; (d) age-specific YLD rate by vision loss severity categories in 2017.
, Male. (c) age-specific prevalence rate by vision loss severity categories (MVL, SVL and blindness) in 2017; (d) age-specific YLD rate by vision loss severity categories in 2017. ![]() , Total Male;
, Total Male; ![]() , Total Female;
, Total Female; ![]() , MVL-Male;
, MVL-Male; ![]() , MVL-Female;
, MVL-Female; ![]() , SVL-Male;
, SVL-Male; ![]() , SVL-Female;
, SVL-Female; ![]() , Blindness-Male;
, Blindness-Male; ![]() , Blindness-Female. VAD = vitamin A deficiency; YLD = years lived with disability; MVL = moderate vision loss; SVL = severe vision loss. The post neonatal period is 28–364 d
, Blindness-Female. VAD = vitamin A deficiency; YLD = years lived with disability; MVL = moderate vision loss; SVL = severe vision loss. The post neonatal period is 28–364 d
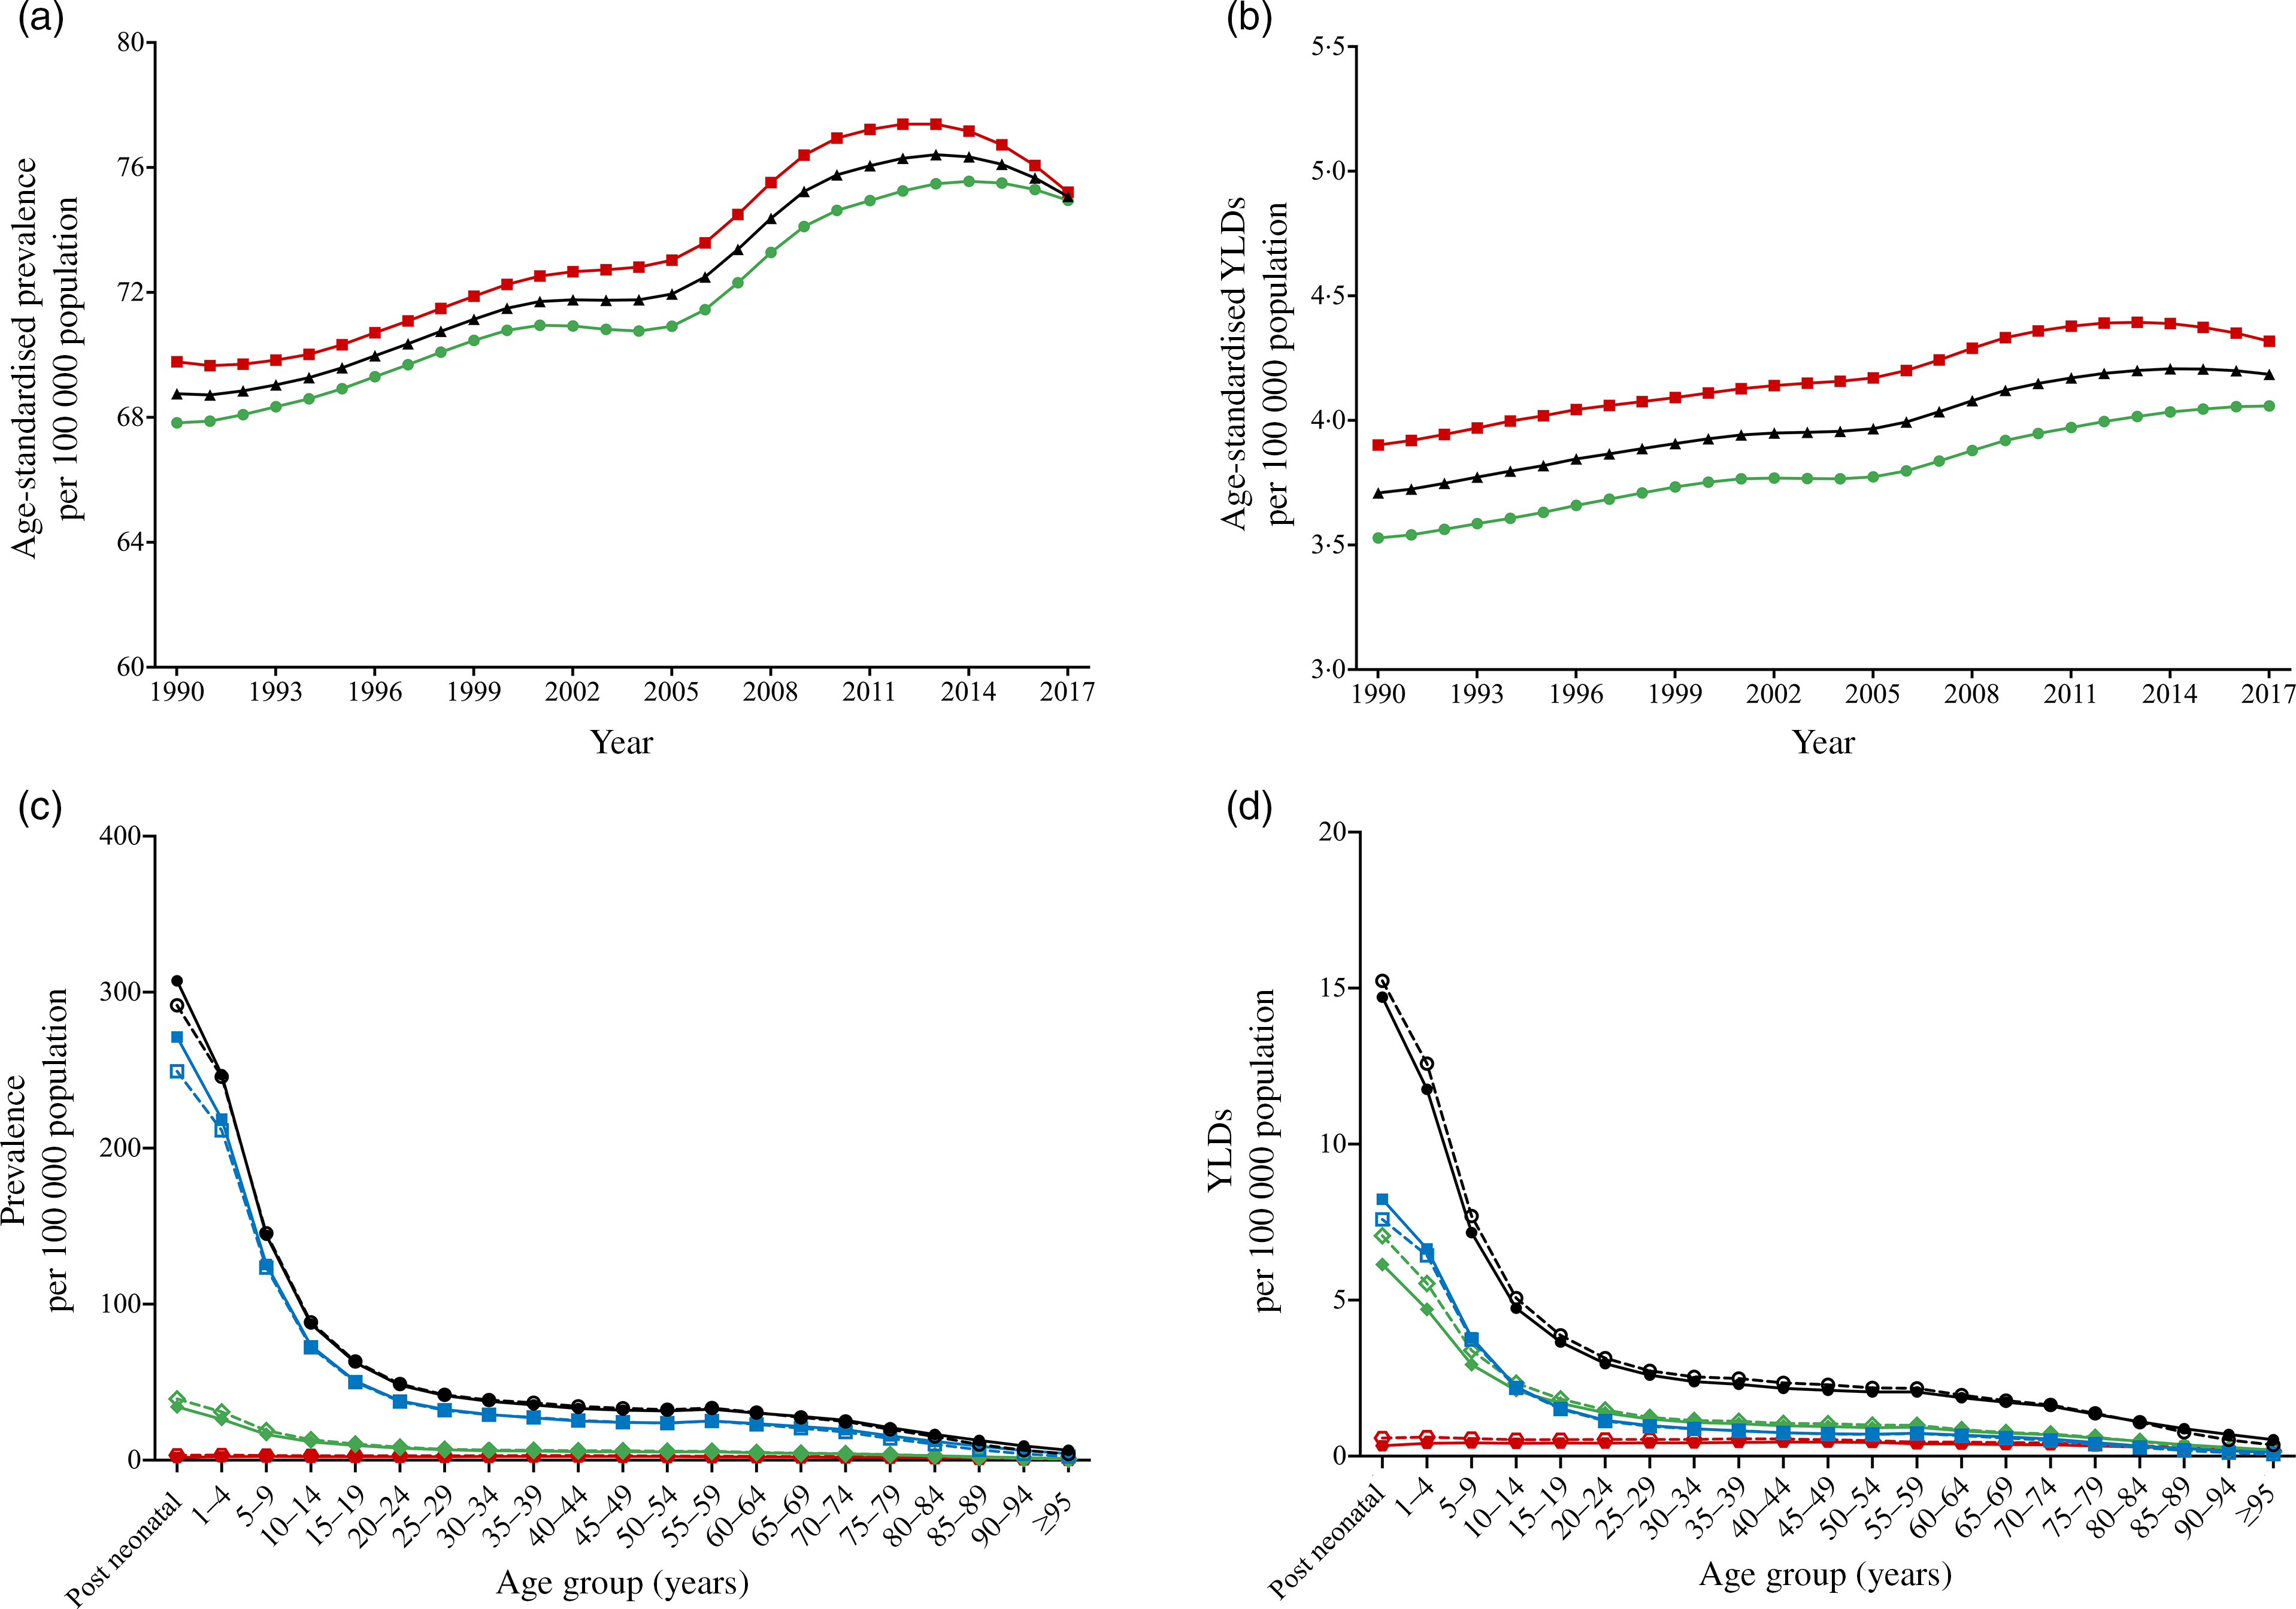
In 2017, the prevalence and YLD rates of VI (total, MVL, SVL and blindness) all reached a peak in the post-neonatal age group (Fig. 1c and 1d). Prevalence and YLD rates by age decreased rapidly from the post-neonatal age group and slowly above 20 to 24 years. For each age group, MVL of VAD occupied a larger portion than SVL and blindness in 2017.
Vision loss burden due to vitamin A deficiency by Global Burden of Disease regions
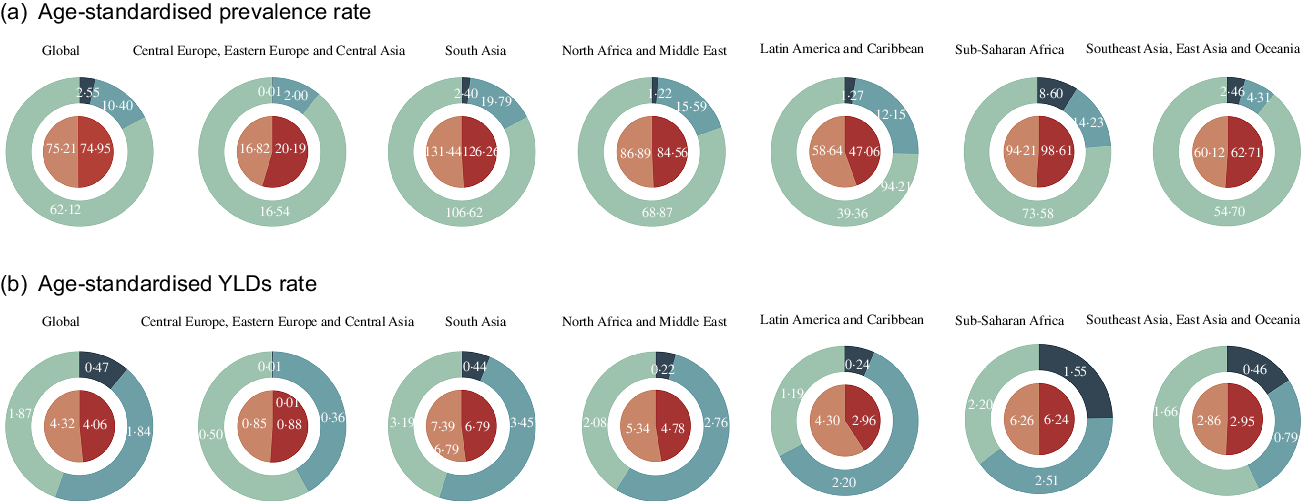
These dual-pie charts illustrated the distributional situation of sex and vision impairments of burden due to VAD in GBD super regions in 2017 (Fig. 2). The area of each block in the dual-pie chart represents the proportion, and the figure inside represents the absolute number. South Asia had the highest total age-standardised prevalence rate (128·8; 95 % UI 104·6–158·9) and YLD rates (7·1; 95 % UI 4·6–10·4). MVL accounted for the majority of the age-standardised prevalence rate of all super regions. MVL took up the largest portion in Central Europe, Eastern Europe andCentral Asia and Southeast Asia, East Asia and Oceania in age-standardised YLD rates. SVL represented the majority parts in South Asia, North Africa and Middle East, Latin America and Caribbean and Sub-Saharan Africa. Sub-Saharan Africa and South Asia had the highest portion of blindness in age-standardised prevalence and YLD rates.
Age-standardised prevalence (a) and YLD rates (b) of vision loss due to VAD in GBD super regions by sex and severity categories in 2017. The area of each block in the dual-pie chart represents the proportion, and the figure inside represents the absolute number. VAD = vitamin A deficiency; YLD = years lived with disability; MVL = moderate vision loss; SVL = severe vision loss; GBD = Global Burden of Disease. ![]() , Male;
, Male; ![]() , Female;
, Female; ![]() , Blindness;
, Blindness; ![]() , SVL;
, SVL; ![]() , MVL
, MVL
The age-standardised prevalence and YLD rates of vision loss due to VAD in GBD regions by sex and VI categories in 1990 and 2017 were listed in Fig. 3 and eTable in the Supplement. In Figure 3, Central Sub-Saharan Africa had the highest age-standardised prevalence rate of vision loss for both sexes (males 251·6; 95 % UI 202·2–311·2 and females 229·5; 95 % UI 185·5–282·0) in 2017, followed by South Asia and Southern Sub-Saharan Africa. Similarly, the top three highest age-standardised YLD rates for both sexes were in Central Sub-Saharan Africa (males 13·4; 95 % UI 8·5–19·9 and females 13·7; 95 % UI 8·4–19·9), South Asia and Southern Sub-Saharan Africa.
Age-standardised prevalence (a) and YLD rates (b) of total vision loss due to VAD by GBD regions and sex in 2017. VAD = vitamin A deficiency; YLD = years lived with disability; GBD = Global Burden of Disease. ![]() , Global;
, Global; ![]() , Southeast Asia, East Asia, and Oceania;
, Southeast Asia, East Asia, and Oceania; ![]() , Sub-Saharan Africa;
, Sub-Saharan Africa; ![]() , North Africa and Middle East;
, North Africa and Middle East; ![]() , South Asia;
, South Asia; ![]() , Latin America and Caribbean;
, Latin America and Caribbean; ![]() , Central Europe, Eastern Europe and Central Asia
, Central Europe, Eastern Europe and Central Asia

Geographical distribution and socio-economic disparities in vitamin A deficiency vision loss burden
Figure 4 maps the distribution of the health burden of VAD vision loss worldwide in 2017. The age-standardised prevalence rate (Fig. 4a) was highest in Congo (250·9; 95 % UI 201·0–306·5 per 100 000 population), followed by Democratic Republic of the Congo (242·2; 95 % UI 195·8–299·2 per 100 000 population) and Angola (240·1; 95 % UI 191·1–294·1 per 100 000 population) (Fig. 4a). The highest age-standardised YLD rate (Fig. 4b) was in Yemen (16·3; 95 % UI 10·2–23·7 per 100 000 population), followed by Oman (14·9; 95 %UI 9·5–22·3 per 100 000 population) and Congo (14·3; 95 % UI 8·9–21·1 per 100 000 population) (Fig. 4b).
Geographical distribution and socioeconomic disparities in VAD Vision Loss Burden. (a) Age-standardised prevalence rate maps. ![]() , 240-280;
, 240-280; ![]() , 200-240;
, 200-240; ![]() , 160-200;
, 160-200; ![]() , 120-160;
, 120-160; ![]() , 80-120;
, 80-120; ![]() , 40-80;
, 40-80; ![]() , 0-40;
, 0-40; ![]() , No data; (b) age-standardised YLD rate maps.
, No data; (b) age-standardised YLD rate maps. ![]() , 14-17;
, 14-17; ![]() , 10-14;
, 10-14; ![]() , 8-10;
, 8-10; ![]() , 6-8;
, 6-8; ![]() , 4-6;
, 4-6; ![]() , 2-4;
, 2-4; ![]() , 0-2;
, 0-2; ![]() , No data; (c) association between age-standardised YLD rate and HDI in 2017; (d) concentration index; (e) Gini coefficient. VAD = vitamin A deficiency; YLD = years lived with disability; HDI = human development index. *P < 0·05, **P < 0·01, ***P < 0·001
, No data; (c) association between age-standardised YLD rate and HDI in 2017; (d) concentration index; (e) Gini coefficient. VAD = vitamin A deficiency; YLD = years lived with disability; HDI = human development index. *P < 0·05, **P < 0·01, ***P < 0·001

HDI data in 2017 were available for 118 countries and territories, including thirty five in the low HDI group, thirty seven in medium HDI group, forty in high HDI group and six in very high HDI group. Pearson correlation (r = –0·2417, P = 0·0084) and linear regression analysis (Y = –5·913 × X + 9·088) indicated that age-standardised YLD rates and HDI had a negative correlation in 2017 (Fig. 4c). As shown in Figure 4d, the negative values of the CI also indicated that the vision loss burden of VAD was more concentrated in countries with lower socio-economic development between 1990 and 2017. The CI increased from 1990 (–0·032) to 2000 (–0·042) and declined from 2000 (–0·042) to 2017 (–0·032), indicating the socio-economic-related inequality decreasing from 2000 to 2017. The Gini coefficients of VAD vision loss burden across countries decreased from 0·295 in 1990 to 0·282 in 2017 in terms of age-standardised YLD rates (Fig. 4e). The results of the Gini coefficient indicated that the between-country inequality in the distribution of the VAD vision loss burden was declining from 2000 to 2017.
Leading causes of vision loss globally between 1990 and 2017
Figure 5 summarised the global burden of the top 15 leading causes of VI in 1990 and 2017. The red part represents eye diseases, while the green part represents non-ocular disease. VAD was the ninth leading cause of the age-standardised prevalence rate of vision loss in 1990 and became the eighth leading cause among fifteen causes in 2017. Between 1990 and 2017, the age-standardised prevalence rate of VAD increased by 9·2 %, just behind malaria (20·2 %) and diabetes mellitus (14·9 %) (Fig. 5a). Besides, VAD has emerged as the ninth leading cause of age-standardised YLD rates for vision loss in 1990 and 2017 globally. From 1990 to 2017, the age-standardised YLD rates of VAD rose by 12·8 %, the fourth highest increase just behind diabetes mellitus (23·1 %), neonatal disorders (19·4 %) and malaria (18·7 %) (Fig. 5b).
Rank of leading fifteen causes of global vision loss due to VAD in 1990 and 2017 and the percentage change of age-standardised prevalence (a) and YLD (b) rates between 1990 and 2017. VAD = vitamin A deficiency; YLD = years lived with disability. The solid lines indicate increases, and the dashed lines indicate decreases in rank between 1990 and 2017. The darker part in each column represents the proportion of age-standardised rates of corresponding causes. ![]() , eye diseases;
, eye diseases; ![]() , ascending order in rank;
, ascending order in rank; ![]() , non-ocular diseases;
, non-ocular diseases; ![]() , descending order in rank
, descending order in rank

Discussion
The current study presented the global patterns in vision loss burden attributable to VAD by year, age, sex, region and socio-economic status between 1990 and 2017. VAD has become one of the leading causes of vision loss worldwide. The global vision loss burden caused by VAD had an overall increasing trend over the past few decades but declined in recent years. The vision loss burden due to VAD was concentrated in the post-neonatal age group and decreased with increasing age. Besides, higher vision loss burden of VAD was observed in countries with lower levels of socio-economic development, although the socio-economic-related inequality was declining since 2000.
To the best of our knowledge, VAD has been a significant public health concern worldwide that causes severe visual impairment and blindness(Reference Wiseman, Bar-El Dadon and Reifen30). Xerophthalmia describes a spectrum of eye disease caused by VAD. VAD can be diagnosed by asking the medical history, inspecting conjunctiva and cornea and assessing for symptoms of VAD, such as poor bone growth and dermatologic problems. Apart from the supplementation of vitamin A, topical treatment of ocular manifestations is essential(Reference Sommer and Tarwotjo31). In order to prevent secondary bacterial infections, vitamin A and antibiotic eye drops are recommended for corneal and conjunctival lesions(Reference Sommer32). Ono et al. reported that the global burden of visual impairment due to vitamin A deficiency was 0·6 million DALY in GBD 2004 study(Reference Ono, Hiratsuka and Murakami33). Some studies have confirmed in detail the increasing burden of vision loss due to eye diseases such as cataract, glaucoma and age-related macular degeneration(Reference Wang, Congdon and Bourne18,Reference Hassan, Ahmed and Li34) . Among the fifteen common leading causes of vision loss in the GBD 2017 study, the increase of vision loss due to VAD between 1990 and 2017 ranked third in age-standardised prevalence and YLD rates. According to our findings, the total vision loss burden in age-standardised prevalence and YLD rates showed a rising trend from 1990 to 2014 and a slight downward trend since 2014. Sherwin et al. reported a globally declining trend of the prevalence of VAD in at-risk populations(Reference Sherwin, Reacher and Dean17). The decreasing trend might be associated with the vitamin A supplementation of the UNICEF for more than two-thirds of children in the developing countries in 2007(35).
VAD and xerophthalmia are prevalent in neonates and pregnant women(Reference Imdad, Mayo-Wilson and Herzer12,Reference Arlappa, Laxmaiah and Balakrishna36,Reference Imdad, Ahmed and Bhutta37) . In our study, the prevalence and YLD rates of all VI categories peaked in the post-neonatal age group and decreased with increasing age in 2017, probably due to the rapid growth of infants and relatively low body stores of vitamin A in breast milk(Reference Smith and Steinemann9). Globally, the prevalence of VAD was approximately 30 % among children under the age of 5 years(Reference Imdad, Mayo-Wilson and Herzer12). Twenty million pregnant women in developing countries were vulnerable to VAD and xerophthalmia(Reference West38). Song et al. reported that the prevalence of VAD and marginal VAD both decreased with increasing age in Chinese children(Reference Song, Wang and Wei39). The importance of sufficient nutrients and maternal education in times of increased growth should be realised. The WHO reported that an estimated 250 000 to 500 000 children with VAD become blind every year, and half of them die within 12 months of being blind(4). The universal vitamin A supplementation programme has always targeted to children aged 6 to 59 months to prevent morbidity and mortality in more than eighty countries(Reference Wirth, Petry and Tanumihardjo1,Reference Imdad, Mayo-Wilson and Herzer12,Reference Mayo-Wilson, Imdad and Herzer40) . It is worth noting that VAD leads to delayed recovery and high rate of post-measles complications. In addition, measles infection may contribute to acute VAD and xerophthalmia(Reference Huiming, Chaomin and Meng41). Supplementation of vitamin A has been proved to reduce the severity of measles(Reference West42). Since few studies investigated the sex differences of vision loss due to VAD, we analysed the sex disparities in the vision loss burden of VAD in our study in Fig. 1. Paired Wilcoxon test indicated no significant sex differences for each year and age group. From a perspective of vision loss, vitamin A supplementation should be comprehensive for both sexes.
Lower socio-economic status was identified as a risk factor for the visual difficulty in the World Health Survey(Reference Freeman, Roy-Gagnon and Samson43). More than 90 % of eye disease burden occurs in low- and middle-income countries(Reference Ono, Hiratsuka and Murakami33). Approximately 127 million preschool-age children and 7 million pregnant women were vitamin A deficient in the developing world(Reference West42,Reference Whatham, Bartlett and Eperjesi44) . Children in rural areas of China had a higher prevalence of VAD than those in urban areas(Reference Song, Wang and Wei39). In our research, the vision loss burden due to VAD was concentrated in countries with lower socio-economic status, such as Sub-Saharan Africa, South Asia, North Africa and Middle East. Moreover, we had noticed a negative relationship between age-standardised YLD rates and national socio-economic status. Children in lower income areas were more likely to suffer from xerophthalmia in some African countries like Ethiopia(Reference Belete, Fenta and Hussen45) and Mali(Reference Schémann, Malvy and Zefack46). The higher vision loss burden is probably because people living in low-HDI countries always experience economic stress and lacking dietary intake of vitamin A(Reference Sherwin, Reacher and Dean17). The limited consumption of animal foods caused a lower serum retinol concentration(Reference Jiang, Toschke and von Kries47). Inadequate eye health care resources may also be a contributing factor for the higher vision loss burden of VAD. The average number of ophthalmologists varied according to economic development as defined by the World Bank varied from 9, 29, 62 and 79 per million in low-, lower middle-, upper middle- and high-income countries, respectively(Reference Resnikoff, Felch and Gauthier48). Early diagnosis by ophthalmologists could correct and prevent blindness caused by VAD in adolescents(Reference Couroucli49). Our study provides evidence for vitamin A supplementation programmes targeted in the developing countries for WHO and UNICEF. The Gini coefficient and CI demonstrated that the between-country and socio-economic-related inequalities in vision loss burden due to VAD were declining since 2000. People benefited from vitamin A supplementation programmes in Southeast Asia result in better ocular health(Reference Bailey, West and Black50). The WHO recommended that there should be one paediatric eye centre per 10 million population. Besides, the VISION 2020 programme encouraged vitamin A supplementation and created adequate eye-care facilities to reduce visual impairment in children, particularly in resource-poor countries.
The limitations of our study should be considered. First, the current study has the same GBD methodological limitations as the GBD 2017 study, which has already been reported in many studies(19,21,22) . The GBD 2017 study used representative population-based studies to provide estimates through hierarchical models. The selection bias and confounding bias regarding the literature included in the GBD 2017 study were inevitable. The accuracy of our findings depends on the quality and quantity of data in the GBD study. Diagnosis of corneal ulceration occurs in many conditions including xerophthalmia, infectious and inflammatory disorders and trauma(Reference Whitcher, Srinivasan and Upadhyay51). It is often difficult to ascribe the true pathogenesis to VAD in prevalence investigation. Moreover, younger children are less mobile after dark making recognition of altered behaviour consistent with night blindness harder to ascertain. Difficulty exists in measuring the vision (night blindness and corneal scarring) of young children, especially in children younger than 2 years of age(Reference Smith and Steinemann9). In children younger than 2 to 3 years of age, visual behaviour can be assessed rather than visual acuity. Visual behaviour varies with the age of the child. Another significant limitation of the GBD study was the lack of data on vision loss burden due to VAD in many high-income countries. More epidemiological studies on the vision loss burden of VAD in the high-income countries are needed. Third, in our research, the vision loss burden was analysed at the global, regional and national levels. We need a sub-national analysis to estimate the vision loss burden of VAD. Further research should be conducted on the influence of race and the vision loss burden of VAD in specific areas. Furthermore, the lack of prevalence and YLD rates of early- and late-neonatal age group may be because it is difficult to calculate the vision loss of young children due to language problems and reduced educational attainment. There are inevitable limits and biases of the vision loss due to VAD in these results of GBD study. In addition to vision loss, VAD may contribute to morbidity of other ocular manifestations, such as painful, itchy and watery eyes, due to conjunctival and corneal xerosis. Future research could focus on this aspect of manifestations.
Conclusions
In this international and comparative study, the results indicate that VAD has become one of the significant leading causes of vision loss globally. The overall trend of the age-standardised prevalence and YLD rates of VAD vision loss fell in recent years, and VAD resulted in a higher vision loss burden in the post-neonatal age group and low-HDI countries. Reassuringly, the between-country inequality in the distribution of the VAD vision loss burden was declining from 2000 to 2017. Hopefully, the current study will provide a more reasonable basis for improving the nutritional adequacy and establishing effective public health policies of VAD, especially for children in the developing world.
Acknowledgements
Financial support: The current study was supported by grants from the National Natural Science Foundation of China (Nos. 81900853 and 81870635) and China Postdoctoral Science Foundation (2019M652107). Conflict of interest: There are no conflicts of interest. Authorship: Literature search: YX, YS and XL. Data collection: YX, YS and XL. Analysis and interpretation: YX, YS, XL and QM. Drafting of manuscript: YX, YS, XL, QM, LL and YW. Final revision of manuscript: YX, YS, XL, QM, LL, YW and JY. Ethics of human subject participation: Not required.
Supplementary material
For supplementary material accompanying this paper visit https://doi.org/10.1017/S1368980021001324


