


1. Introduction
The Richtmyer–Meshkov instability (RMI) (Richtmyer Reference Richtmyer1960; Meshkov Reference Meshkov1969) is commonly described as the impulsive limit of the Rayleigh–Taylor instability (RTI) (Rayleigh Reference Rayleigh1882; Taylor Reference Taylor1950). At a fluid interface of different densities, RTI will occur when there is an acceleration or potential force causing the lighter fluid to be a higher pressure than the heavier fluid. At a corrugated interface, the misalignment of the density and pressure gradients will deposit vorticity which will cause the interface perturbations to grow. RMI is similar except it is caused by an impulsive acceleration, such as shock wave passing through the interface, as opposed to a continual acceleration. Unlike RTI which is dependent upon acceleration direction, RMI is unstable whether it is heavy-to-light or light-to-heavy acceleration. Alongside the Kelvin–Helmholtz instability which applies to sheared interface layers and helps play a role in the transition to turbulence for RMI and RTI, these instabilities are collectively known as hydrodynamic instabilities. These instabilities play a role in the dynamics of supernova stars (Arnett Reference Arnett2000) and are responsible for a degradation of the performance in inertial confinement fusion (ICF) (Lindl et al. Reference Lindl, Landen, Edwards and Moses2014).
In the linear limit, where amplitudes of sinusoidal perturbations are small compared with their wavelength, RMI will grow with a constant velocity (Richtmyer Reference Richtmyer1960; Meyer & Blewett Reference Meyer and Blewett1972; Vandenboomgaerde, Mügler & Gauthier Reference Vandenboomgaerde, Mügler and Gauthier1998). Eventually the amplitudes saturate, decreasing the growth rate. Asymmetries in the mixing layer begin to form, developing into bubble and spike structures, representing the penetration of the light fluid and heavy fluid into one another, respectively. The structures begin to roll-up due to the shearing motion across the interface which induces the Kelvin–Helmholtz instability (Brouillette Reference Brouillette2002). The mixing layer between the two fluids will develop into a turbulent mixing zone of some width. The mixing layer width in late time RMI is governed by a sub-linear power-law formula,  $W\sim t^\theta$. The value of $\theta$ is dependent upon initial conditions (Thornber et al. Reference Thornber, Drikakis, Youngs and Williams2010; Groom & Thornber Reference Groom and Thornber2020), and Atwood number ( $\textit {At}$) (Youngs & Thornber Reference Youngs and Thornber2020a), where the Atwood number is a measure of the density ratio of the two fluids,
 \begin{equation} At = \frac{\rho_2 - \rho_1}{\rho_2 + \rho_1}. \end{equation}
The bubbles and spike heights also grow according to  $\theta$ and achieve a self-similar ratio (Youngs & Thornber Reference Youngs and Thornber2020a). Experimentally, this is hard to observe as in the early time the heights will grow at different rates (Dimonte & Schneider Reference Dimonte and Schneider2000; Groom & Thornber Reference Groom and Thornber2023). A detailed review of RMI can be found in the works of Zhou (Reference Zhou2017a,Reference Zhoub) and Zhou et al. (Reference Zhou2021).
Whilst most commonly analysed in planar or non-convergent geometry, it is notable that in applications such as ICF and supernova the geometry is spherical. It is of interest then to analyse these instabilities in convergent geometry, a term used to encompass both cylindrical and spherical geometries. Some of the first research into the effects of the convergent geometry on the linear regime were done by Bell (Reference Bell1951) and Plesset (Reference Plesset1954). The model of Bell (Reference Bell1951) allowed for uniform compressibility, but was limited to  $\textit {At} = 1$, whilst the model of Plesset (Reference Plesset1954) was incompressible but for all Atwood numbers. Epstein (Reference Epstein2004) combined and recast the equations to derive model equations for convergent geometry which is suitable for all Atwood numbers and uniform compression. The model showed dependence upon two fluid parameters, the compression rate of the fluid, $\dot {\rho }/\rho$, and the convergence rate of the mean interface radius, $\dot {R}/R$. The additional dependence upon these parameters modifies the growth rate of RMI and RTI in convergent geometry as compared with planar geometry.
There have been many experimental set-ups that have been able to create RMI in either a converging or diverging geometry. Cylindrically converging shocks have been produced in annular vertical coaxial shock tubes to analyse RMI (Hosseini, Ogawa & Takayama Reference Hosseini, Ogawa and Takayama2000), for both single-mode perturbations (Lei et al. Reference Lei, Ding, Si, Zhai and Luo2017) as well as polygonal shapes (Si et al. Reference Si, Long, Zhai and Luo2015). Dimotakis & Samtaney (Reference Dimotakis and Samtaney2006) used a gas lens technique to convert a planar shock to a converging cylindrical shock, which has been applied to investigating single-mode RMI (Biamino et al. Reference Biamino, Jourdan, Mariani, Houas, Vandenboomgaerde and Souffland2015). This method has been extended to create a converging spherical shock wave (Brasseur et al. Reference Brasseur, Vandenboomgaerde, Mariani, Barros, Souffland and Jourdan2021). An alternate approach has been to design the curvature of the shock tube to create a convergent shock wave (Zhai et al. Reference Zhai, Liu, Qin, Yang and Luo2010), which has been used to study single-mode interfaces (Luo et al. Reference Luo, Zhang, Ding, Si, Yang, Zhai and Wen2018). Luo et al. (Reference Luo, Li, Ding, Zhai and Si2019) modified the design so that the transmitted shock exits through the tube as a planar wave, preventing re-shock and interface deceleration. Divergent cylindrical shock wave are also possible with this approach and have been applied to single-mode interfaces (Li et al. Reference Li, Ding, Zhai, Si, Liu, Huang and Luo2020), as well as a two interface system with a single-mode perturbation of the inner interface (Zhang et al. Reference Zhang, Ding, Si and Luo2023). Musci et al. (Reference Musci, Petter, Pathikonda, Ochs and Ranjan2020) utilised detonations to create repeatable blast waves and investigated the blast-driven instability, a mixture of RMI and RTI, on a multi-mode interface in cylindrical geometry.
Simulations have been the prominent method to examine multi-mode convergent geometries, as well as to analyse to a later non-dimensional time. Many simulations utilise a Cartesian mesh to simulate the spherical or cylindrical geometries, however the mesh topology can affect the numerics of the simulation. Investigations into the impacts of using Cartesian geometry have been conducted by Joggerst et al. (Reference Joggerst, Nelson, Woodward, Lovekin, Masser, Fryer, Ramaprabhu, Francois and Rockefeller2014) and Woodward et al. (Reference Woodward2013), showing that increasing the Cartesian mesh resolution can reduce the symmetry breaking in implicit large eddy simulations (ILES), however these cases still observe a mesh imprint on the small-scale mixing. A common approach to modelling implosions is to simulate a system with an external time-varying high-pressure region to help drive the implosion (Youngs & Williams Reference Youngs and Williams2008), and this has been applied to spherical two-dimensional (2-D) single-mode (Flaig et al. Reference Flaig, Clark, Weber, Youngs and Thornber2018) as well as three-dimensional (3-D) multi-mode simulations (El Rafei & Thornber Reference El Rafei and Thornber2020). Bell–Plesset models are able to describe the initial growth, with accuracy decreasing once the modes begin to saturate (El Rafei et al. Reference El Rafei, Flaig, Youngs and Thornber2019). Lombardini, Pullin & Meiron (Reference Lombardini, Pullin and Meiron2014) used a Bell–Plesset model for a 3-D spherical implosion with a Cartesian mesh, and separates the effects into three terms: Rayleigh–Taylor/Richtmyer–Meshkov-like, convergence and compression contributions. Of these contributions, convergence was found to have had the smallest contribution, followed by compression.
In convergent geometry the instability growth is modified by both radial (axial) strain rate and angular (transverse) strain rate and these effects are taken into account in the Bell–Plesset linear perturbation theory. In planar shock tube experiments, RMI and RTI may be influenced by compression/expansion of the mixing zone due to axial strain rates from transient waves (Vetter & Sturtevant Reference Vetter and Sturtevant1995; Li et al. Reference Li, He, Zhang and Tian2019, Reference Li, Tian, He and Zhang2021). For the bulk overturning motion seen in the RTI tilted-rig case (Read Reference Read1984; Youngs Reference Youngs1989; Andrews et al. Reference Andrews, Youngs, Livescu and Wei2014; Ferguson, Wang & Morgan Reference Ferguson, Wang and Morgan2023) the interface is stretched in the transverse direction and thinned in the axial direction. The absence of a persevering mean strain rate normal to the interface is one of the key differences between planar RMI and converging RMI. Simulations have been performed on RMI in cylindrical geometry which show that the velocity difference between the edges of the mixing layer, labelled the stretching/compression effect, is a significant contributor to the growth rate of the instability (Ge et al. Reference Ge, Zhang, Li and Tian2020, Reference Ge, Li, Zhang and Tian2022). An analysis of the mean mass fraction profile by Ge et al. (Reference Ge, Li, Zhang and Tian2022) shows that a mixing layer's width will grow due to three contributions: the velocity difference across the mixing layer, the turbulent/penetrative growth from the fluctuating field and molecular diffusion of the fluids.
In general multi-dimensional compressible flows, Richtmyer–Meshkov/Rayleigh–Taylor mixing layers are influenced by both axial and transverse strain rates. The purpose of the present paper is to focus on the effect of axial strain rate and study this in detail for simple test cases. This is performed by conducting simulations of planar geometry RMI-induced mixing layers with an applied mean axial strain rate. By isolating the axial strain rate, the geometric convergence component of the Bell–Plesset effect is removed. In convergent geometry the radial and angular strain rates are not easily decoupled. This planar configuration is therefore unique in its ability to be able to isolate the effect of a mean strain rate normal to the interface and determine how it affects the development of RMI and the transition to a self-similar mixing layer. This method may also be employed to investigate the effects of convergence on the mixing layer by applying a transverse strain rate, however that topic is outside the scope of the current paper.
In § 2 the method used to apply a uniform axial strain rate to the simulation is outlined, as well as the governing equations utilised. Section 3 analyses the linear regime of a 2-D single-mode instability using resolved numerical simulations, and compares the results with the corresponding linear potential flow model. Section 4 looks at strained ILES of multi-modal narrowband RMI, and assesses the ability of a buoyancy-drag model to capture the growth rate. In § 5 the main conclusions of the paper are presented, summarising the ability of the different models to predict the effects of a mean axial strain rate on RMI.
2. Problem formulation
2.1. Axial strain rate
In order to evaluate the effects of axial strain on the growth of the instability, two different strain-rate profiles are utilised in a planar configuration. Both strain-rate profiles ensure a linear mean axial velocity profile through time, given by
 \begin{equation} \bar{u}_1(x,t) = \bar{S}(t) x_1, \end{equation}
where  $\bar {S}(t) = \partial \bar {u}_1/\partial x_1$ is the mean strain rate of the background flow, which is designed to be uniform through the domain at a given time. By convention here, positive $\bar {S}$ represents expansion. The expansion factor, which represents the ratio of the domain length at time $t$ to the original domain length in the axial direction is given by
 \begin{equation} \varLambda(t) = \exp\left[\int^t_0 \bar{S}(t')\,{\rm d} t'\right]. \end{equation}
In an expansion or compression process the mass within the strained domain should be conserved. If the process is isentropic, with negligible dissipative heating, then the density and pressure can be calculated using the expansion factor in (2.2) (Durbin & Zeman Reference Durbin and Zeman1992):
 \begin{gather} \rho(t) = \rho_0 \varLambda^{{-}1}(t), \end{gather}
 \begin{gather}p(t) = p_0 \varLambda^{-\gamma}(t). \end{gather}
For two different fluids in a strained domain, the fluid densities will change at the same rate, maintaining the density ratio and Atwood number, as long as the fluids have the same specific heat ratio,  $\gamma$. If the specific heat ratios are different, the pressure of the two fluids will be different, generating waves and causing one fluid to compress and the other to expand to achieve a pressure equilibrium. A uniform pressure profile is important to avoid any unnecessary Rayleigh–Taylor effects, whereby vorticity is generated through baroclinicity. To ensure that the background expansion process does not generate a mean pressure gradient, the momentum equation in one dimension can be solved for a uniform velocity gradient:
 \begin{equation} \rho \frac{\partial u}{\partial t} + \rho u \frac{\partial u}{\partial x} ={-}\frac{\partial p}{\partial x} + \rho g. \end{equation}
With the substitution of (2.1) and  $\partial p/\partial x=0$, the solution requires
 \begin{equation} g = \left( \frac{{\rm d} \bar{S}}{{\rm d} t} + \bar{S}^2 \right) x \end{equation}
for the potential force,  $g$. Typically in rapid-distortion theory, the expression ${\rm d} \bar {S}/{\rm d} t + \bar {S}^2$ is set to be zero (Durbin & Zeman Reference Durbin and Zeman1992; Cambon, Coleman & Mansour Reference Cambon, Coleman and Mansour1993). This constrains the systems being modelled to what is labelled the constant velocity case in § 2.1.1. By including this potential term, different mean velocity gradient profiles are able to be modelled (Yu & Girimaji Reference Yu and Girimaji2007).
2.1.1. Constant velocity
The first strain-rate profile arises from a domain growing or shrinking with a constant boundary velocity, denoted  $V_0$. Likewise, any unperturbed packet of fluid will maintain its original velocity throughout the strain profile. For a domain with an initial length of $L_0$, the domain length as a function time varies linearly by
 \begin{equation} L(t) = L_0 + V_0 R(t-t_0), \end{equation}
where  $R(\phi )=\max (0,\phi )$ is the ramp function, $t_0$ is the initial time at which strain is applied and $t-t_0$ indicates the time since strain is initially applied. Initialised with a linear velocity profile, the mean strain rate is initially given by $\bar {S}_{0}= V_0/L_0$. The mean strain rate will change as the length of the domain changes. The time-varying strain rate may be expressed as a function of the initial strain rate:
 \begin{align} \bar{S}(t) &=\frac{V_0}{L(t)} \end{align}
 \begin{align} &= \frac{\bar{S}_{0}}{1+\bar{S}_{0} R(t-t_0)} . \end{align}
The expansion factor for the constant velocity case is simply given by
 \begin{equation} \varLambda(t) = 1 + \bar{S}_0 R(t-t_0).\end{equation}
As mentioned previously, the constant velocity case is the default case used in rapid-distortion theory as it maintains homogeneity in the flow without any potential forcing.
2.1.2. Constant strain rate
The second strain-rate profile used is designed for a constant strain rate. For the system with strain applied at time  $t_0$, the strain rate is defined by
 \begin{equation} \bar{S}(t) = \bar{S} H(t-t_0), \end{equation}
where  $H(\phi )$ is the Heaviside step function, equal to unity for $\phi \ge 0$ and zero otherwise. For a constant strain rate the domain will grow exponentially as the expansion factor only requires integrating a constant:
 \begin{equation} \varLambda(t) = \exp[\bar{S} R(t-t_0)] .\end{equation}
In this configuration the flow must accelerate in order for the domain to grow exponentially. To accelerate the flow without a pressure differential, thereby isolating the strain-rate effects from Rayleigh–Taylor effects, a potential forcing is required. Using a constant strain rate in (2.5) reduces the required potential term to
 \begin{equation} g = \bar{S}^2 x. \end{equation}
2.2. Strain-rate non-dimensionalisation
The magnitude of strain rates observed will vary depending upon the application, hence the necessity for non-dimensionalisation. In rapid-distortion theory, the strain rate is normalised by using the turbulence to mean-shear timescale ratio,  $\mathcal {S}k/\epsilon$, where $\mathcal {S} = (2\bar {S}_{ij}\bar {S}_{ij})^{1/2}$ (Pope Reference Pope2000). For the investigation of RMI in the linear regime, an alternative turbulent timescale is used, which is the initial eddy turnover time for the instability, $\lambda /\dot {h}_0$, where $\dot {h}_0$ is the initial growth rate of the mixing layer and $\lambda$ is the effective initial wavelength. The strain rate is then non-dimensionalised as
 \begin{equation} \hat{S}(t) = \frac{\bar{S}(t) \lambda}{\dot{h}_0}, \end{equation}
representing the ratio of the initial eddy turnover time to the strain timescale. For the constant-velocity cases, which has a time-varying strain rate, the initial strain rate will be utilised,  $\hat {S}_0 = \hat {S}(t=t_0)$. The unstrained case corresponds to $\hat {S}=0$, with the strain contribution increasing with the magnitude of $\hat {S}$. The benefit of this non-dimensionalisation is that it couples nicely with the common dimensionalisation of time for RMI,
 \begin{equation} \tau = \frac{t \dot{h}_0}{\lambda}. \end{equation}
Which allows for the substitution,  $\bar {S} t = \hat {S} \tau$, which commonly occurs as observed in the expansion factor in (2.8) and (2.10). As a result, the expansion factor is proportional to $\hat {S}\tau$. Therefore, to simulate large values of $\hat {S}$ until late time (large $\tau$) will require a mesh that is suitable for the resulting large change in domain size.
It is possible to estimate values of  $\hat {S}$ for a variety of problems. The Taylor–Sedov blast wave has a post-shock velocity profile that is roughly linear, with an approximate strain rate of $\bar {S}\approx 4/(5(\gamma +1)t)$, which is inversely proportional to time. Including an interface that interacts with the blast wave at time $t_0$ (and ignoring any alterations to the profile as a result), the non-dimensional strain rate across the interface is given by
 \begin{equation} \hat{S}_{TS} = \frac{t_0}{t} \frac{2{\rm \pi}}{ak l At}. \end{equation}
The wavelength is replaced with the effective wavelength of the spherical harmonic mode  $l$, and the initial growth rate has been decomposed into the impulsive contribution of Richtmyer (Reference Richtmyer1960). Assuming initial linearity of $ak=0.01$, Atwood number $At=0.5$ and a dominant mode of $l=60$, the peak non-dimensional strain-rate contribution is 20.9 at $t = t_0$, but this rapidly decreases with time. By the time the shock wave has reached a radius of twice the initial interface radius, the value of $\hat {S}$ reduces to 3.7. In ICF, the fuel–ablator interface may reach speeds of 200 km s $^{-1}$ at a radius of $200\,\mathrm {\mu }$m, around a $4.5\times$ convergence. Assuming a linear velocity profile, or isotropic strain rates, this gives an axial strain rate of $-1$ ns $^{-1}$. Using the initial conditions of $\lambda =2\,\mathrm {\mu }$m and $\dot {h}_0/h_0 = -63$ ns $^{-1}$ (Weber et al. Reference Weber, Clark, Casey, Hall, Jones, Landen, Pak and Smalyuk2023), along with an initial perturbation size of 20 nm (Marinak et al. Reference Marinak, Kerbel, Gentile, Jones, Munro, Pollaine, Dittrich and Haan2001) gives $\hat {S} = -1.6$. Implosion simulations of El Rafei et al. (Reference El Rafei, Flaig, Youngs and Thornber2019) have the interface move at an almost constant velocity between the initial shock and the re-shock. Prior to re-shock, at a convergence factor of $2.7$, the strain rate may be estimated to be $-$1.2 ns $^{-1}$, which for the two narrowband cases gives $\hat {S}=-0.54$ and $\hat {S}=-0.27$. In these applications, it is evident that the timescales of the turbulence and strain are of a similar order of magnitude, and the strain contribution should not be ignored.
2.3. Governing equations
2.3.1. Five-equation model
For the direct numerical simulation and ILES cases, the five-equation, quasi-conservative system of equations of Thornber, Groom & Youngs (Reference Thornber, Groom and Youngs2018) is used. This augments the standard conservative, four-equation mass fraction model with a non-conservative equation for the volume fraction. In the limit of zero diffusivity, conductivity and viscosity the model reduces to the inviscid volume fraction model of Allaire, Clerc & Kokh (Reference Allaire, Clerc and Kokh2002) and Massoni et al. (Reference Massoni, Saurel, Nkonga and Abgrall2002):
 \begin{gather} \frac{\partial \rho}{\partial t} + \frac{\partial}{\partial x_j} (\rho u_j) =0, \end{gather}
 \begin{gather}\frac{\partial \rho u_i}{\partial t} + \frac{\partial}{\partial x_j} (\rho u_i u_j + p\delta_{ij}) = \frac{\partial \sigma_{ij}}{\partial x_j} + \rho g_i, \end{gather}
 \begin{gather}\frac{\partial \rho E}{\partial t} + \frac{\partial}{\partial x_j} ((\rho E + p)u_j) = \frac{\partial }{\partial x_j} (\sigma_{ij} u_i + q_i + {q_d}_i) + \rho g_k u_k, \end{gather}
 \begin{gather}\frac{\partial \rho Y_a}{\partial t} + \frac{\partial}{\partial x_j} (\rho Y_a u_j) = \frac{\partial}{\partial x_j} \left(D_{12} \rho \frac{\partial Y_a}{\partial x_j}\right), \end{gather}
 \begin{gather}\frac{\partial f_a}{\partial t} + u_j \frac{\partial f_a}{\partial x_j} = \frac{\partial}{\partial x_j} \left(D_{12} \frac{\partial f_a}{\partial x_j}\right) - \mathcal{M}D_{12} \frac{\partial f_1}{\partial x_j}\frac{\partial f_a}{\partial x_j} + D_{12} \frac{\partial f_a}{\partial x_j} \frac{\partial N}{\partial x_j} \frac{1}{N}. \end{gather}
The viscous stress tensor, heat flux and enthalpy flux are given by
 \begin{gather} \sigma_{ij} = \bar{\mu} \left(\frac{\partial u_i}{\partial x_j} + \frac{\partial u_j}{\partial x_k} -\frac{2}{3} \frac{\partial u_k}{\partial x_k} \delta_{ij}\right), \end{gather}
 \begin{gather}q_j = \bar{\kappa} \frac{\partial T}{\partial x_j}, \end{gather}
 \begin{gather}{q_d}_j = \rho D_{12} \frac{\partial Y_a h_a}{\partial x_j}. \end{gather}
The thermal conductivity of each species is calculated using kinetic theory,
 \begin{equation} \kappa_a = \mu_a \left(\frac{5 \mathcal{R}}{4 W_a} + c_{p,a}\right), \end{equation}
in terms of the molecular weight of each species,  $W_a$, and the specific heat capacity at constant pressure, $c_{p,a}$. The mixture quantities for viscosity, $\bar {\mu }$, and thermal conductivity, $\bar {\kappa }$, are calculated from the species’ values using Wilke's rule. The binary diffusion coefficient, $D_{12}$, is calculated using the Lewis number which is assumed to be equal for both species:
 \begin{equation} D_{12} = \frac{\bar{\kappa}}{Le \rho \bar{c}_p} .\end{equation}
All simulations are performed using an ideal gas which defines the internal energy and enthalpy by
 \begin{gather} e = \frac{p}{\rho (\gamma -1)}, \end{gather}
 \begin{gather}h = c_p T, \end{gather}
where for multi-species closure within a cell, an isobaric approximation is used,
 \begin{equation} \frac{1}{\gamma -1} = \frac{f_a}{\gamma_a-1}, \end{equation}
where the right-hand side is summated for all species as per tensor notation. The model also uses the number density,  $N=p/k_b T$, and the value $\mathcal {M}=(W_1-W_2)/(W_1 f_1 + W_2 f_2)$.
2.4. Numerical methods
The governing equations are implemented and solved by the multi-block structured, finite-volume code FLAMENCO. FLAMENCO calculates the inviscid fluxes using a method of lines Godunov scheme, with a fifth-order scheme to reconstruct the variables at the interface (Kim & Kim Reference Kim and Kim2005). These values are modified using a low-Mach-number correction to ensure the correct dissipation rate at low Mach numbers (Thornber et al. Reference Thornber, Drikakis, Williams and Youngs2008a,Reference Thornber, Mosedale, Drikakis, Youngs and Williamsb), from which the flux is then calculated using a HLLC Riemann solver (Toro, Spruce & Speares Reference Toro, Spruce and Speares1994). The viscous and diffusion terms are calculated using centred second-order finite differences. The time-stepping is performed with a second-order total variation diminishing Runge–Kutta method (Spiteri & Ruuth Reference Spiteri and Ruuth2002).
As there is a linear velocity profile, the fluid domain will grow or shrink according to the strain rate and strain profile. In order to accurately capture the instability growth, the mesh of the simulated domain is moved with the fluid. A moving mesh with FLAMENCO has previously been used (El Rafei & Thornber Reference El Rafei and Thornber2020), and has been validated in a similar code employing volume fraction governing equations (Probyn et al. Reference Probyn, Thornber, Drikakis, Youngs and Williams2014).
To maintain the linear velocity profile during strain application, the boundary conditions in the direction of strain are inviscid moving walls. The ghost cells are calculated by copying the cell symmetrically opposite the wall. The velocity of the ghosts cells is mirrored relative to the wall velocity, as opposed to zero. For example, at the upper boundary, the normal velocity for the first ghost cell ( $nx+1$) is calculated by
 \begin{equation} u_{nx+1} = 2u_{Wall} - u_{nx}. \end{equation}
The wall velocity,  $u_{Wall}$, is given by the expected velocity as per the strain profile.
3. Two-dimensional single mode
3.1. Potential flow
A potential flow model for an axially strained system needs to incorporate the velocity gradient of the flow as well as the change in density. The linearised potential flow model by Epstein (Reference Epstein2004) includes the consideration of a compression ratio for the planar geometry model. The compression rate,  $\gamma _\rho = \dot {\rho }/{\rho }$, is considered uniform in both fluids about the interface and creates a background fluid velocity given by
 \begin{equation} \bar{u}_1(x,t) = \dot{x}_0 (t) - \gamma_{\rho} (t) (x - x_0(t)), \end{equation}
where  $x_0(t)$ is the mean interface position and $\dot {x}_0(t)$ is the mean interface velocity. This rate of compression is related to the mean strain rate by $\sum \bar {S}_{ii} = -\gamma _\rho$. For the case of only an axial strain rate, $\gamma _\rho = -\bar {S}(t)$, the background fluid velocity is
 \begin{equation} \bar{u}_1(x,t) = \dot{x}_0 (t) + \bar{S} (t) (x - x_0(t)), \end{equation}
which matches the velocity profile expected for a uniform velocity gradient of  $\bar {S} (t)$. The resulting solution provided by Epstein (Reference Epstein2004) for this case is given by
 \begin{equation} \left(\bar{S} (t) + \frac{{\rm d}}{{\rm d} t}\right) \frac{{\rm d}}{{\rm d} t}(a_k \rho) = k \frac{\rho_2 - \rho_1}{\rho_2+\rho_1} g_p a_k \rho, \end{equation}
where  $a_k$ is the amplitude of the mode with wavenumber $k$ and $g_p = -(1/\rho ) [\partial p(x_0,t)]/\partial x$ represents the fluid acceleration at the unperturbed interface due to the pressure gradient, and not the acceleration from external potential. Equation (3.3) can be written more clearly as
 \begin{equation} \ddot{a}_k - \frac{{\rm d}}{{\rm d} t}(\bar{S} a_k) = k \frac{\rho_2 - \rho_1}{\rho_2+\rho_1} g_p a_k. \end{equation}
Now considering the impulsive limit for a single-mode RMI with  $g_p = \Delta u \delta (t)$, where $\Delta u$ is the change in interface velocity, (3.4) will integrate to
 \begin{equation} \dot{a} = a \bar{S} (t) + U_0 ,\end{equation}
with
 \begin{equation} U_0 = a_{0} k \frac{\rho_2 - \rho_1}{\rho_2+\rho_1} \Delta u \end{equation}
as prescribed by Richtmyer (Reference Richtmyer1960). This solution suggests a new growth rate that is the sum of the RMI velocity as well as the background velocity from the strain rate. As such, for the case of  $\bar {S}(t)=0$, (3.5) will reduce to the linear growth rate expected for RMI. For the case with no RMI velocity, the amplitude will grow with the domain as determined by the expansion factor. Solutions where both terms are presented will depend upon the strain-rate profile. It is possible to write a generalised solution using a form similar to Flaig et al. (Reference Flaig, Clark, Weber, Youngs and Thornber2018) and Lombardini et al. (Reference Lombardini, Pullin and Meiron2014) by introducing the intermediate variable $\alpha (t)$,
 \begin{equation} a(t) = \alpha(t) \exp\left[\int^t_0 \bar{S}(t')\,{\rm d} t'\right]. \end{equation}
The exponential component is identical to the expansion factor,  $\varLambda (t)$, as defined in (2.2). The resulting differential equation is
 \begin{equation} \dot{\alpha}(t) = U_0 \varLambda(t)^{{-}1}, \end{equation}
which, in turn, provides the general solution,
 \begin{equation} a(t) = a_{0} \varLambda(t) + U_0 \varLambda(t) \int_0^t \varLambda^{{-}1}(t')\,{\rm d} t', \end{equation}
where  $a_0 = a(0)=\alpha (0)$. This general solution has two distinct terms. The first term of the solution corresponds to the initial amplitude that is expanding/compressing with the domain due to the strain rate. The second term represents a more complicated relationship between the RMI velocity and the strain rate. In the absence of a strain rate, the expansion factor will remain one, and the expression will collapse to the standard RMI impulsive solution of $a_0+U_0 t$. For the two prescribed strain-rate profiles in § 2.1, an exact solution can be obtained. For constant strain rate applied from time $t_0$, the expansion factor is an exponential after the time of strain offset. The solution for the system is
 \begin{equation} a(t>t_0) = (a_{0}+U_0 t_0) \exp({\bar{S} (t-t_0)}) + \frac{U_0}{\bar{S}} (\exp({\bar{S} (t-t_0)})-1). \end{equation}
For the constant velocity profile, it is easier to characterise the flow in terms of the initial strain rate,  $\bar {S}_{0}$, see (2.7b). The expansion factor for this case is a linear expression, which gives the resulting equation,
 \begin{gather} a(t>t_0) = (a_0+U_0
t_0) (1+\bar{S}_{0} (t-t_0)) +
\frac{U_0}{\bar{S}_{0}}(1+\bar{S}_{0}
(t-t_0))\ln(1+\bar{S}_{0} (t-t_0)).
\end{gather}
\begin{gather} a(t>t_0) = (a_0+U_0
t_0) (1+\bar{S}_{0} (t-t_0)) +
\frac{U_0}{\bar{S}_{0}}(1+\bar{S}_{0}
(t-t_0))\ln(1+\bar{S}_{0} (t-t_0)).
\end{gather}In both equations the solutions are not defined for a mean strain rate of zero due to its presence in the denominator. Taking the Taylor series of the expressions will show that the solutions collapse down to the linear growth rate as the strain rate approaches zero.
Equations (3.10) and (3.11) can be non-dimensionalised by dividing by the wavelength and introducing the non-dimensional time,  $\tau = t U_0 /\lambda$, and the non-dimensionalised strain rate, $\hat {S} = \bar {S} \lambda /U_0$. Substituting the non-dimensionalisations and setting the initial strain time $t_0=0$ for simplicity gives the non-dimensionalised equations,
 \begin{equation} \frac{a(t)}{\lambda} = \frac{a_0}{\lambda} {\rm e}^{\hat{S} \tau} + \frac{1}{\hat{S}} ({\rm e}^{\hat{S} \tau} -1) \end{equation}
for constant strain rate, and
 \begin{equation} \frac{a(t)}{\lambda} = \frac{a_0}{\lambda} (1+\hat{S}_{0} \tau) + \frac{1+\hat{S}_{0} \tau}{\hat{S}_{0}} \ln(1+\hat{S}_{0} \tau) \end{equation}
for constant velocity. The amplitude growth rate for a specific strain-rate profile is therefore dependent upon the initial linearity ( $a_0/\lambda$) and the non-dimensional strain rate value, $\hat {S}$. A more complicated non-dimensionalisation can be done using the general solution layout provided by (3.9). The resulting equation takes the form
 \begin{equation} \frac{a(t)}{\lambda \varLambda(t)} = a_0 + \hat{\tau}, \end{equation}
where  $\hat {\tau } = U_0 \hat {t}/\lambda$ and
 \begin{equation} \hat{t} = \int_0^t \varLambda^{{-}1}(t')\,{\rm d} t'. \end{equation}
This solution normalises the amplitude with respect to the domain expansion, collapsing the solution down to a straight line in the linear regime. The alternate time  $\hat {t}$ hides the complexities of the strain rate, however for the unstrained case it will reduce to standard time.
3.2. Initial conditions
The simulations were conducted on a 2-D domain, with inviscid walls in the  $x$-direction and periodic boundary conditions in the $y$-direction. The fluids were set up in a heavy-to-light configuration at a 3:1 density ratio, resulting in a Atwood number of 0.5. Instead of a shock wave and amplitude perturbation, a velocity perturbation was used to replicate the linear growth rate of RMI (Thornber et al. Reference Thornber, Drikakis, Youngs and Williams2010). The velocity potential is given by
 \begin{equation} \phi(x,t) = \text{sgn}(x_1-x_0) \frac{U_0}{k} \cos(k x_2) \exp({-k|x_1-x_0|}), \end{equation}
about the mean interface position,  $x_0$. The analytic perturbation is made divergence free by using the vector potential, $A_i$:
 \begin{gather} u_1 ={-}\frac{\partial \phi}{\partial x_1} = \frac{\partial A_3}{\partial x_2} - \frac{\partial A_2}{\partial x_3}, \end{gather}
 \begin{gather}u_2 ={-}\frac{\partial \phi}{\partial x_2} ={-} \frac{\partial A_3}{\partial x_1}. \end{gather}
The vector potential is calculated by
 \begin{gather} \varPhi = \int \phi \,{\rm d}\kern 0.06em x_1 ={-}\frac{U_0}{k^2} \cos(k x_2) \exp({-k|x_1-x_0|}), \end{gather}
 \begin{gather}A_2 ={-} \frac{\partial \varPhi}{\partial z}, \end{gather}
 \begin{gather}A_3 = \frac{\partial \varPhi}{\partial y}. \end{gather}
Whilst the potential and perturbation decays to zero as  $x_1\to \pm \infty$, the vector potentials are multiplied by a factor to ensure that they decay to zero at the finite $x_1$ boundaries of the domain (Thornber et al. Reference Thornber, Drikakis, Youngs and Williams2010).
The initialisation allows a simple initial growth rate of 1 m s $^{-1}$ to be used and requires an initial amplitude of $a_0=0$. As the initial amplitude is zero, the growth of the instability will be entirely due to the second term of the derived equations that represent the coupling between the RMI growth rate and the strain rate. The flat interface is initialised with a diffuse interface of the form
 \begin{equation} f_1 = \frac{1}{2} \left(1 - \text{erf}\left(\frac{\sqrt{\rm \pi} (x_1-x_0)}{h}\right)\right), \end{equation}
where  $h$ is the initial diffusion width set to $\lambda /64$.
The pressure was initialised at a uniform value of 100 kPa throughout the domain. Using this pressure, the Mach number of the flow can reach up to 0.6 at the boundaries of the domain, however the turbulent Mach number remains around 0.004 throughout the simulation. The Reynolds number,  ${{Re}} = U_0\lambda /\nu$, was set to 2048, which is sufficiently high enough that the linear regime growth rate is not impacted by viscosity (Walchli & Thornber Reference Walchli and Thornber2017). The kinematic viscosity for the multi-species system was calculated by $\nu =(\mu _1+\mu _2)/(\rho _1+\rho _2)$, and the same dynamic viscosity was used for both fluids. The Prandtl and Schmidt numbers were set to unity for both fluids, ensuring a Lewis number of one for calculating the diffusivity (see (2.18)). The initial properties of each fluid are provided in table 1. This configuration with a non-zero Atwood number, diffusivity and a flat interface means that an initial asymmetry develops between the bubble and the spike due to the difference in the mass and volume fraction diffusive fluxes, caused by the density difference of the two fluids. This phenomenon does not affect the later time amplitudes or ratio.
Fluid properties for the linear regime cases.

For the specified fluid parameters and amplitude growth, it is difficult to ascribe a particular equivalent shock initialisation as the initial interface is flat, giving an amplitude and amplitude growth rate of zero for the equivalent problem. An analogous problem could be defined for a given shock strength by assuming some finite amplitude. With initial conditions of  $p=36.12$ kPa, $\rho _1=1.76$ kg m−3, $\rho _2=0.56$ kg m $^{-3}$ and $ak=0.015$, then the post-shock conditions and amplitude growth rate of $U_0=1$ m s $^{-1}$ would be achieved with a shock strength of $Ma=1.8439$.
As the domain is expected to grow or shrink depending upon the sign of the imposed mean strain rate, different grids are used for the compression and the expansion cases. For the compression cases, the simulation was conducted on a grid of size  $20\lambda \times \lambda$, to allow for the grid to compress by up to a factor of four without boundary effects inhibiting the growth of the instability. This grid is composed of initially square cells, which become rectangular as the simulation progress, shrinking with the domain in the $x$-direction. For the expansion and unstrained cases, a grid of size $5\lambda \times \lambda$ was used, however the cell density was four times higher in the $x$-direction to allow the domain to expand up to a factor of four and still maintain the desired resolution in all directions. In addition to the unstrained case, four cases were simulated for each strain profile. As listed in table 2, each profile has two expansion cases with positive strain rates, and two compression cases with negative strain rates.
The strain rates, total simulation time, initial domain size, grid resolution and final expansion factor for each of the linear regime cases.

3.3. Results
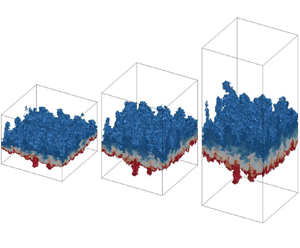
The final interfaces are plotted for the largest magnitude strain-rate cases in figure 1. The difference in amplitude is evident between the compression and expansion cases, with around a factor of three difference in size. The strain rate has also affected the diffusive thickness of the interface, making it thicker for the expansion cases, which may inhibit the roll-up of secondary instabilities. The diffuse thickness has not scaled proportionally with the expansion factor as the diffusion rate is modified by the change in species gradient from the strain rate, resulting a diffusive thickness that is proportionally less thick for the expansion cases when accounting for the expansion factor.
Visualisation of the volume fraction at  $\tau =0.1$ for the 2-D single-mode simulations. Heavy fluid ( $\,f_1=1$) is red, light fluid ( $\,f_1=0$) is blue. Major ticks indicate a distance of $\lambda /4$. (a) Constant boundary velocity, $\hat {S}_0 = -7.5$. (b) Unstrained case. (c) Constant boundary velocity, $\hat {S}_0 = 30$. (d) Constant strain rate, $\hat {S} = -14$. (e) Constant strain rate, $\hat {S} = 14$.

To measure the amplitude of the single-mode RMI, the interface position is taken to be along the isocontour line for the volume fraction where  $f_1=0.5$. The amplitude is calculated by taking the difference of the maximum and minimum $x$-position of the interface isocontour line,
 \begin{equation} a = 0.5[\max(x_{f_1=0.5}) - \min(x_{f_1=0.5})]. \end{equation}
The non-dimensionalised amplitude is plotted in figure 2, along with the theoretical solutions given in (3.12) and (3.13) as derived from the model by Epstein (Reference Epstein2004). All cases initially start off with a linear growth rate, aligned with the unstrained growth rate. This is expected as the RMI contribution is proportional to  $t$, whilst the strain is a higher-order correction which provides a smaller contribution for early time. The cases with a negative strain rate grow more slowly in time, and the positive strain rate cases grow much faster. For the most strongly compressed constant velocity case, the growth rate of the instability becomes negative, meaning the domain compression is reducing the amplitude faster than the instability is naturally growing. The theoretical model does manage to predict this behaviour in compression and matches the simulation result nicely. By $\tau = 0.1$, the theory tends to over-predict the amplitude of all the strained cases to some degree, as well as the unstrained case. At the final time the difference between the model and simulation increases with the strain-rate value, being larger for the expansion cases and smaller for the compression cases.
Amplitude of the single-mode linear regime for (a) constant boundary velocity and (b) constant strain rate. Solid lines indicate numerical results, dashed lines indicate linear model.

The percentage error is plotted in figure 3 as a function of the non-dimensional amplitude, showing the expansion cases reaching a larger percentage error than the compression. In this form it can be seen that the error follows a roughly linear relationship with the amplitude. The compression cases which use an initially coarser grid in the  $y$-direction show larger fluctuations in the early time due to the division of small values and the coarser grid. These oscillations in the error decrease as the grid becomes finer and as the amplitude values increase with time. Given the roughly linear dependence of the error on the amplitude, the cause of the error is likely due to the mode saturation, as even the unstrained case diverges from linear theory. The error remains under 10 % in magnitude whilst $a/\lambda < 0.1$, which is considered to be the cut-off for the linear regime (Brouillette Reference Brouillette2002). The actual growth rates simulated here are potentially slightly larger than what would be expected from a shock initialisation, as the vorticity deposited into the fluid due to the transmitted/reflected waves will inhibit the instability growth rate (Probyn et al. Reference Probyn, Williams, Thornber, Drikakis and Youngs2021).
Error in the amplitude for the linear regime under (a) constant velocity and (b) constant strain rate.

To see how the instabilities grow with respect to the domain size, it is possible to plot using the alternate non-dimensionalisaton listed in (3.14). Figure 4 shows the theoretical results all fall onto a single line, with the simulation results appearing close underneath. The simulation results are still expected to be below the theoretical growths due to the growth slowing down as the amplitude of the mode increases. It is interesting to see that when accounting for the domain growth, the  $\hat {S}_0=-7.5$ case shows approximately linear growth, suggesting it is still growing in the linear regime but the growth is also being continually offset by the domain compression, which resulted in the net negative growth rate seen in figure 2. With this non-dimensionalisation the saturation time does not correspond to a specific value of $\hat {\tau }$, with the results diverging from the linear trend at different points along the plot.
Amplitude of the single-mode linear regime for (a) constant velocity and (b) constant strain rate. Solid lines indicate numerical results, dashed lines indicate linear model.

4. Self-similar mixing layer
At late time, RMI can induce a self-similar mixing layer, as indicated by quantities such as the mean volume fraction collapsing down to a single curve when non-dimensionalised by the width of the mixing layer, and the molecular mixing fraction,  $\varTheta$, approaching an asymptotic value. The effect of axial strain on the development of multi-mode RMI has not been investigated, and it is unknown if the mixing layer reaches self-similarity. Using the quarter-scale narrowband case from the $\theta$-group collaboration (Thornber et al. Reference Thornber2017), the effects of axial strain rates on multi-mode RMI can be examined. Axial strain is added prior to the time at which the mixing layer achieves self-similarity, at a non-dimensional time of $\tau = 1$. This allows for stronger interaction between the strain rate and the turbulence in the anisotropic, homogeneous mixing layer than if the strain was applied at a later time. The original simulations were conducted using ILES, however additional simulations are performed using the buoyancy-drag model to determine the accuracy and any required corrections.
4.1. Models
4.1.1. Buoyancy-drag model
The buoyancy-drag mixing model is based on the work by Layzer (Reference Layzer1955) and Baker & Freeman (Reference Baker and Freeman1981). The model was extended to better describe turbulent mixing by Dimonte (Reference Dimonte2000), Hansom et al. (Reference Hansom, Rosen, Goldack, Oades, Fieldhouse, Cowperthwaite, Youngs, Mawhinney and Baxter1990), Oron et al. (Reference Oron, Arazi, Kartoon, Rikanati, Alon and Shvarts2001) and Ramshaw (Reference Ramshaw1998). A buoyancy-drag model was calibrated for the narrowband RMI case used in the  $\theta$-group collaboration (Thornber et al. Reference Thornber2017), which required a modification to the calculation of the effective length scale to prevent excessive drag at early time (Youngs & Thornber Reference Youngs and Thornber2020b). This buoyancy-drag model consisted of two coupled ordinary differential equations:
 \begin{equation} \frac{{\rm d} W}{{\rm d} t} = V,\\ \frac{{\rm d} V}{{\rm d} t} ={-} \frac{V^2}{l^{eff}(\bar{\lambda},W)}. \end{equation}
The model measures the mixing layer width using the integral width of the mixing layer,
 \begin{equation} W = \int_0^{L_x} \overline{f_1}\,\overline{f_2} \,{{\rm d}\kern 0.06em x}, \end{equation}
along with a corresponding growth rate or velocity measure,  $V$. The effective length scale in the drag term was fitted to the form,
 \begin{equation} \frac{l^{eff}}{\bar{\lambda}} = \max\left\{a-b(1-\exp({-cW/\bar{\lambda}})), \frac{\theta}{1-\theta} \left(\frac{W}{\bar{\lambda}}-d\right)\right\}.\end{equation}
This model is for the RMI-induced mixing layer and does not try to model shock transition. The resulting differential equation for the velocity component has no buoyancy contribution, only a drag contribution. The model for narrowband RMI was extended to model separate bubble and spike heights by Youngs & Thornber (Reference Youngs and Thornber2020a) for a similar case to the quarter-scale  $\theta$ group case:
 \begin{gather} \frac{{\rm d} h_b}{{\rm d} t} = V_b,\quad \frac{{\rm d} V_b}{{\rm d} t} ={-} \frac{V_b^2}{l^{eff}_b(\bar{\lambda},h_b)}, \end{gather}
 \begin{gather}\frac{{\rm d} h_s}{{\rm d} t} = V_s,\quad \frac{{\rm d} V_s}{{\rm d} t} ={-} \frac{V_s^2}{l^{eff}_s(\bar{\lambda},h_b)}, \end{gather}
where the effective length scales for the  $\textit {At}=0.5$ case were fitted according to
 \begin{gather} \frac{l^{eff}_b}{\bar{\lambda}} = \max\left\{a_b-b_s(1-\exp({-c_b h_b/\bar{\lambda}})), \frac{\theta}{1-\theta} \left(\frac{h_b}{\bar{\lambda}}-d_b\right) \right\} , \end{gather}
 \begin{gather}\frac{l^{eff}_s}{\bar{\lambda}} = \max\left\{a_s-b_s(1-\exp({-c_s h_b/\bar{\lambda}})), \frac{\theta}{1-\theta} R \left(\frac{h_b}{\bar{\lambda}}-d_s\right) \right\}. \end{gather}
For the  $\textit {At}=0.5$ case, the ILES data (as far as the calculations were conducted) were accurately modelled with a late-time growth rate of $\theta =1/3$, the theoretical value of Elbaz & Shvarts (Reference Elbaz and Shvarts2018), and this is the value of $\theta$ used in the models here. However, if the ILES calculations were continued to a much later time it is likely that the theoretical value of $\theta =1/4$ (Soulard et al. Reference Soulard, Guillois, Griffond, Sabelnikov and Simoëns2018) would be appropriate. The self-similar ratio of spike-to-bubble height for the spike drag length scale was fitted to the data with $R=1.1$. The remaining coefficients are listed in table 3. The coefficients are the same as those published previously (Youngs & Thornber Reference Youngs and Thornber2020a,Reference Youngs and Thornberb) except for $c_S$ and $d_S$ which have been modified to better capture the spike growth for this case.
Buoyancy-drag coefficients for  $\textit {At}=0.5$, narrowband RMI (Youngs & Thornber Reference Youngs and Thornber2020a,Reference Youngs and Thornberb).

The bubble and spike heights used in these equations are based on novel integral quantities, first defined in Youngs & Thornber (Reference Youngs and Thornber2020a). These bubble and spike heights are approximately equal to the bubble and spike values obtained by using the 1 % and 99 % cutoff of the mean volume fraction; however, by being integral quantities they are less sensitive to statistical fluctuations:
 \begin{gather} h_{b/s} = 1.1 h_{b/s}^{(2)}, \end{gather}
 \begin{gather}h_{s}^{(m)} = \left[\frac{(m+1)(m+2)}{2} \frac{\displaystyle\int_0^\infty x'^m \bar{f}_1 \,{{\rm d}\kern 0.06em x}'}{\displaystyle\int_0^\infty \bar{f}_1 \,{{\rm d}\kern 0.06em x}'} \right]^{1/m}, \end{gather}
 \begin{gather}h_{b}^{(m)} = \left[ \frac{(m+1)(m+2)}{2} \frac{\displaystyle\int_{-\infty}^0 |x'|^m \bar{f}_2 \,{{\rm d}\kern 0.06em x}'}{\displaystyle\int_{-\infty}^0 \bar{f}_2 \,{{\rm d}\kern 0.06em x}'} \right]^{1/m}. \end{gather}
These expressions are for when  $f_1$ corresponds to the denser fluid ( $\rho _1>\rho _2$) and is initially below the mean interface position ( $x'<0$). The integrals are taken with reference to the mean interface position ( $x' = x-x_C$), which is defined by position where there are equal bubble and spike volumes on either side,
 \begin{equation} \int_{-\infty}^{x_C} \bar{f}_2 \,{{\rm d}\kern 0.06em x} = \int^\infty_{x_C} \bar{f}_1 \,{{\rm d}\kern 0.06em x}. \end{equation}
 Buoyancy-drag models have been applied in spherical geometry in the works of Miles (Reference Miles2004, Reference Miles2009) and El Rafei & Thornber (Reference El Rafei and Thornber2020). The key modifications used to adjust the buoyancy-drag model were to use the time-varying wavelength for the drag calculation, as well as to incorporate the background velocity of the fluid into the growth of the instability. Using a uniform mean background velocity gradient,  $\bar {S}$, the velocity difference at the ends of a layer of width $W$ is given by $W \bar {S}$, giving the new ordinary differential equation for the width as
 \begin{equation} \frac{{\rm d} W}{{\rm d} t} = V + W \bar{S} .\end{equation}
This is the same correction that arises from the linear regime model in (3.5). As the quarter-scale narrowband case already has a calibrated buoyancy-drag model for the unstrained case, it is a great candidate to use to test the accuracy of the background strain-rate correction whilst using the same drag expression from the unstrained case. El Rafei & Thornber (Reference El Rafei and Thornber2020) calibrated a buoyancy-drag model for a narrowband perturbation in spherical geometry, however the effective length scales for the bubbles and spikes were different to the planar case of Youngs & Thornber (Reference Youngs and Thornber2020a). The initial buoyancy-drag simulations were conducted using equations with the inclusion of the background velocity correction:
 \begin{gather} \frac{{\rm d} W}{{\rm d} t} = V + W \bar{S},\quad \frac{{\rm d} V}{{\rm d} t} ={-} \frac{V^2}{l^{eff}(\bar{\lambda},W)}, \end{gather}
 \begin{gather}\frac{{\rm d} h_b}{{\rm d} t} = V_b + h_b\bar{S},\quad \frac{{\rm d} V_b}{{\rm d} t} ={-} \frac{V_b^2}{l^{eff}_b(\bar{\lambda},h_b)}, \end{gather}
 \begin{gather}\frac{{\rm d} h_s}{{\rm d} t} = V_s + h_s \bar{S},\quad \frac{{\rm d} V_s}{{\rm d} t} ={-} \frac{V_s^2}{l^{eff}_s(\bar{\lambda},h_b)} , \end{gather}
4.2. Initial conditions
4.2.1. ILES
The ILES cases use the same initialisation as the quarter-scale narrowband case from the  $\theta$-group collaboration (Thornber et al. Reference Thornber2017). Here ILES is conducted using the inviscid form of (2.15e), instead relying on the inherent numerical dissipation in the shock capturing scheme to approximate the cascade and removal of energy from the large scales to the small scales in the high-Reynolds-number limit. The original quarter-scale case used a domain given by $x\times y \times z =\mathcal {L}_x\times \mathcal {L}\times \mathcal {L}= 2.8{\rm \pi} \times 2{\rm \pi} \times 2{\rm \pi}$ m $^3$. In the $y$- and $z$-directions periodic boundary conditions were used, whilst outflow boundary conditions were applied in the $x$-direction. The quarter-scale case was set-up in a heavy-to-light configuration with unshocked densities of 3 and 1 kg m $^{-3}$, both with $\gamma =5/3$. The shock position was initialised in the heavy fluid at $x=3.0$ using a Mach 1.8439 shock. The initial Atwood number was $\textit {At}=0.5$ and the post-shock Atwood number is $\textit {A}^+ = 0.487$. The interface position was given by
 \begin{equation} S(y,z) = 3.5 + A(y,z). \end{equation}
The perturbation  $A(y,z)$ is the summation of Fourier modes in the range of $\lambda _{min} = \mathcal {L}/32$ and $\lambda _{max}=\mathcal {L}/16$, and a constant power spectrum is used for the perturbations. The desired overall amplitude of the initial perturbation is $0.1\lambda _{min}$, with the profile shown in figure 5. The amplitudes and phase for each mode are randomly generated from a Gaussian distribution using a Mersenne twister algorithm. The Mersenne twister algorithm is deterministic for a given seed, so the random coefficients are reproducible which allows for recreation of the interface. The amplitudes of each mode are scaled to achieve the desired power spectrum and amplitude. A detailed description of the generation of the perturbation can be found in Thornber et al. (Reference Thornber, Drikakis, Youngs and Williams2010, Reference Thornber2017). The interface is initially diffuse using a volume-fraction profile of
 \begin{equation} f_1 = \frac{1}{2} \left(1 - \text{erf}\left(\frac{\sqrt{\rm \pi}[x-S(y,z)]}{\delta}\right)\right), \end{equation}
where the initial diffuse thickness is  $\delta = \mathcal {L}/128$ for the quarter-scale case. The fluids are given a velocity offset of $\Delta u = -291.575$ to account for the change in velocity from the incident shock. This allows the interface to remain stationary after the passage of the shock.
(a) Isosurface for volume fraction  $f_1=0.5$ for the initial interface. (b) Isosurfaces for $f_1=0.01$ (blue) and $0.99$ (red) for the mixing layer at $\tau =1$.

As given in Thornber et al. (Reference Thornber2017), the variance  $\sigma ^2(t) = \sum _{k_x,k_y} a^2 /2 = \int ^\infty _0 P(k) \,{\rm d} k$ is the superposition of the individual modes and in the linear regime may be approximated as
 \begin{equation} \sigma^2(t) = (C \sigma_0 At^+ \Delta u \bar{k} t)^2 ,\end{equation}
using the initial variance  $\sigma _0$, and the weighted average wavenumber of perturbation,
 \begin{equation} \bar{k} = \sqrt{\frac{\displaystyle\int^\infty_0 k^2 P(k) \,{\rm d} k}{\displaystyle\int^\infty_0 P(k)\,{\rm d} k}}. \end{equation}
Given the narrowband, constant power spectrum, the mean wavenumber is equal to  $\bar {k}=\sqrt {7/12}k_{max}$. For the perturbation type, the plane-averaged volume fraction profile is given by
 \begin{equation} \bar{f}_1(x) = \frac{1}{2}\left( 1 - \text{erf}\left(\frac{x}{\sqrt{2}\sigma}\right)\right). \end{equation}
This can be related to the integral width through the definition in (4.2), which gives the relation  $W=0.564 \sigma$. The initial predicted growth rate for the integral width is obtained using the time derivative of the variance in (4.12):
 \begin{equation} \dot{W}_0 = 0.564 \bar{k} \textit{At}^+ C \sigma_0 \Delta u. \end{equation}
For the quarter-scale case the initial growth rate is  $\dot {W}_0 = 12.649$ m s $^{-1}$. Length scales are non-dimensionalised by the mean wavelength, $\bar {\lambda }=2{\rm \pi} /\bar {k}$, and time scales are non-dimensionalised by using the initial growth rate and mean wavelength, $\tau = t \dot {W}_0/\lambda$. This is the same approach used in § 3, which enables the usage of the same non-dimensionalisation for the strain rate, $\hat {S}=\bar {S} \lambda /\dot {W}_0$. Other quantities are non-dimensionalised using $\dot {W}_0$, $\bar {\lambda }$, the cross-sectional area $4{\rm \pi} ^2$, and the mean post-shock density, $\bar {\rho }^+=3.51$ kg m $^{-3}$.
The application of the strain rates is applied to the simulation at  $\tau =1$, at which time the system is in the nonlinear regime and bubble and spike structures have formed, as shown in figure 5. The strain rate is applied to the flow by adding a linear velocity gradient for the desired initial strain rate. As the main transmitted and reflected waves have left the domain, the outflow boundary conditions in the $x$-direction are replaced with moving inviscid walls which allows the domain to maintain the background velocity gradient according to the prescribed strain-rate profile. Four simulations were conducted for each strain profile, as listed in table 4, with two compressive strain rates and two expansive strain rates for each profile. The cases are run until a non-dimensional time of $\tau =10$ or $\tau =35$ depending upon the strain rate, such that the domain changes in length by a factor of two. For the expansion simulations, the solution at $\tau =1$ is interpolated onto a grid with double the cells in the $x$-direction. This is to ensure that the simulations are able to resolve the same length scales as the unstrained case during the expansion, until $\varLambda (t)=2$. The Appendix includes results that show the integral properties are unaffected by the introduction of walls for the unstrained simulation, and that the integral properties are converged for the expansion case using the base and refined mesh.
The strain cases, total simulation time, domain size, grid resolution and final expansion factor for each of the ILES cases.

4.2.2. Buoyancy-drag model
The buoyancy-drag model is initialised using the data provided in Youngs & Thornber (Reference Youngs and Thornber2020a). In this work, higher-resolution ILES were conducted to ensure convergence at the early time of the narrowband RMI. As the buoyancy-drag model does not seek to capture the effects of shock compression, the model begins with an offset of  $\tau = 0.08$. The initial conditions given are
 \begin{gather} W_0 = 0.5642 C \sigma_0, \end{gather}
 \begin{gather}{h_s}_0 = {h_b}_0 = 1.1 \times 2.0 C \sigma_0, \end{gather}
 \begin{gather}V_0 = 0.5642 C \bar{k} \sigma_0 \Delta u \textit{At} \times F_W^{nl}, \end{gather}
 \begin{gather}{V_b}_0 = 1.1 \times 2.0 C \bar{k} \sigma_0 \Delta u \textit{At} \times F_b^{nl}, \end{gather}
 \begin{gather}{V_s}_0 = 1.1 \times 2.0 C \bar{k} \sigma_0 \Delta u \textit{At} \times F_s^{nl}, \end{gather}
with compression factor  $C=0.576$, and nonlinearity factors $F_W^{nl} = 0.85$, $F_b^{nl} = 0.54$ and $F_s^{nl}=0.96$. The equations for the buoyancy-drag model are integrated without any strain rate applied until $\tau =1$, after which the applied mean strain rate is included in the calculation by using the background velocity correction for the length scales, as shown in (4.8).
4.3. Results
4.3.1. Visualisations
Slices of volume fraction contours of the  $x$–
$x$– $y$ plane for the constant velocity cases are shown in figure 6, with the solution at $\tau = 9.843$ shown in the left column and $\tau =34.451$ in the right column. The rows are organised by increasing strain rate such that the strongest compression case is displayed in the top row and the strongest expansion case is shown in the bottom row. For the same $\tau$, the effect of the strain rate on the width of the mixing layer is evident, with the expansion cases growing much larger than the compression cases. The expansion cases appear to show more mixing within the mixing layer, showing a larger amount of intermediate concentration, denoted by white in the images. The compression cases tend to show sharper transitions between regions of pure concentration, which may be expected as any diffusive widths are also being compressed.
Contours of the volume fraction for the constant velocity ILES cases at  $z=0$: (a,b,d,f,h) $\tau = 9.843$; (c,e,g) $\tau = 34.451$; (a) $\hat {S}_0=-0.051$; (b,c) $\hat {S}_0=-0.013$; (d,e) $\hat {S}_0 = 0$; (f,g) $\hat {S}_0 = 0.025$; (h) $\hat {S}_0 = 0.102$. Heavy fluid ( $\,f_1=1$) is red, light fluid ( $\,f_1=0$) is blue. Major ticks on the axes correspond to $\Delta x = \Delta y = 1$ m.

A comparison of the 3-D isosurfaces of the mixing layers for the same expansion factor is shown in figures 7 and 8. For the largest strain-rate magnitudes, this occurs at a much smaller non-dimensional time,  $\tau$, than for the moderate magnitude strain rates. The mixing layer widths for the higher magnitude strain-rate cases appear slightly smaller than the moderate strain-rate cases, which is a likely result as the mixing layer has had less time to develop naturally from entrainment and diffusion; in the rapid limit for expansion, the mixing layer will grow only by the factor of $\varLambda (t)$, whilst a slower strain rate will have the turbulent growth of the mixing layer in addition. The bubble and spike structures are larger for the expansion cases, with the compression cases showing less variation in the isosurface position. Part of this appears to be due to the merger of bubbles and spikes into larger structures for the expansion cases compared with the compression cases. A comparison between different strain profiles can be made by comparing adjacent figures. There are some slight visual differences of certain structures, however the overall morphology appears to be very similar between strain profiles for the same expansion factor.
Contour of volume fraction  $f_1$ for the expansion mixing layers at $\varLambda \approx 1.866$, bounded by $f_1=0.999$ (red) and $f_1=0.001$ (blue): (a) $\hat {S}_0=0.102$, $\tau = 9.55$; (b) $\hat {S}=0.081$, $\tau = 8.66$; (c) $\hat {S}_0=0.025$, $\tau = 35.0$; (d) $\hat {S}_0=0.020$, $\tau = 31.7$.

Contour of volume fraction  $f_1$ for the expansion mixing layers at $\varLambda \approx 0.567$, bounded by $f_1=0.999$ (red) and $f_1=0.001$ (blue): (a) $\hat {S}_0=-0.051$, $\tau = 9.55$; (b) $\hat {S}=-0.081$, $\tau = 7.97$; (c) $\hat {S}_0=-0.013$, $\tau = 35.0$; (d) $\hat {S}_0=-0.020$, $\tau = 28.9$.

4.3.2. Width and mix measures
The integral width of the mixing layer for both the ILES and buoyancy-drag cases is plotted in figure 9. Supporting the visualisations of the mixing layer, the expansion cases grow faster than the unstrained case, and the compression cases grow slower, even experiencing negative growth rate. It is possible to observe a difference in the trajectories of the integral width curves between the constant strain rate and the constant velocity. For the expansion cases, the constant velocity has a strain rate that decreases in magnitude with time. This can be observed as the constant-strain-rate expansion cases have steeper gradients at the end of their simulations compared with the constant velocity, due to the integral width growing more from the layer stretching with the domain. For the compression cases, the constant velocity simulations have a strain rate that increases in magnitude (becomes more negative), and so the trajectory appears to be slightly more negative than the constant-strain-rate cases. The buoyancy-drag model does used not align with the ILES, except for the unstrained case for which it was calibrated. The buoyancy-drag model appears to overestimate the influence of the strain rate on the mixing layer, predicting a larger integral width for the expansion cases and a smaller integral width for the compression cases compared to what is observed from the ILES.
Integral width for (a) constant velocity and (b) constant strain rate. Solid lines indicate ILES, dashed lines indicate buoyancy-drag model.

The alternate non-dimensionalisation for the system is presented in figure 10, which in the linear regime was able to collapse the theoretical growth rate down to a single straight line. The buoyancy-drag model results are included and show that with this non-dimensionalisation the buoyancy-drag predictions for all strain cases are almost equal to the unstrained ILES. There is a slight variation in the buoyancy-drag curves. This is due to the effective drag length scale not being self-similar under the transformation. The ILES strained results do not collapse down, instead the ILES compression cases grow at an increased rate compared with the unstrained and the ILES expansion cases have a decreased growth rate. The failure of the buoyancy-drag model to accurately capture the physics of this anisotropic strain case suggests further corrections to the buoyancy-drag model are required, which are explored in § 4.3.7.
Alternate non-dimensionalisation for integral width for (a) constant velocity and (b) constant strain rate. Solid lines indicate ILES, dashed lines indicate buoyancy-drag model.

The plots for the bubble and spike heights are shown in figures 11 and 12, respectively. The bubble and spike heights behave in the same manner as the integral width with both the bubble and spike heights increasing with positive strain rate and decrease with negative strain rate. The buoyancy-drag model again over-predicts the influence of the strain rate on the growth rate.
Bubble heights for (a) constant velocity and (b) constant strain rate. Solid lines indicate ILES, dashed lines indicate buoyancy-drag model.

Spike heights for (a) constant velocity and (b) constant strain rate. Solid lines indicate ILES, dashed lines indicate buoyancy-drag model.

The buoyancy-drag model for the spike height uses a drag term that is calculated from the bubble height, assuming the ratio of the two heights will achieve a self-similar ratio. For the quarter-scale narrowband case with Atwood 0.5, the value used in the model is  $R=1.1$ (Youngs & Thornber Reference Youngs and Thornber2020a). Looking at the spike-to-bubble ratio in figure 13 the strain rate causes the ratios to diverge, increasing for expansion and decreasing for compression. This suggests the spike height is more affected by the strain rate than the bubble height.
Ratio of spike-to-bubble height for (a) constant velocity and (b) constant strain rate.

The molecular mixing fraction, an integral mixing measure, is calculated by
 \begin{equation} \varTheta (t) = \frac{\displaystyle\int \overline{f_1\, f_2}\,{{\rm d}\kern 0.06em x}}{\displaystyle\int \bar{f}_1\, \bar{f}_2 \,{{\rm d}\kern 0.06em x}}, \end{equation}
where the overbar denotes a planar average in the homogeneous directions. The ILES result is plotted in figure 14, and included is FLAMENCO's value of  $\varTheta$ at the final time of $\tau =246$ from the $\theta$-group collaboration (Thornber et al. Reference Thornber2017). In the present simulations, the unstrained case does not yet achieve this value and is instead slowly decreasing towards it. Immediately after perturbation, the strained cases appear to follow the same trajectory until around $\tau =3$. Afterwards, the strain rates cause the molecular mixing fraction to change. The expansion cases surprisingly become more mixed, remaining above $\varTheta =0.85$. The compressed cases become less mixed, dropping below the steady-state value, and showing strong negative gradients at the end of their simulations, suggesting they would continue to decrease in mixedness. The deviations from the self-similar asymptote suggest that the strain rates changes the behaviour of the mixing layer beyond the effect of changing the mixing layer's size through expansion or compression. This is analysed through the self-similarity of the volume fraction profiles in the following section.
Integral mixing measures for the (a) constant velocity and (b) constant strain rate. Solid lines indicate ILES results, dashed line is FLAMENCO's final value from Thornber et al. (Reference Thornber2017).

4.3.3. Self-similarity
The denominator of the molecular mixing fraction is the integral width, computed from the mean volume fraction profile,  $\bar {f}_1$, whilst the numerator is an integral over the mean volume fraction product, $\overline {f_1\, f_2}$. The collapse of these two profiles is a key indication of when the mixing layer has reached a self-similar state. The spatial profiles for $\bar {f}_1$ and $\overline {f_1\,f_2}$ are plotted at the end times of the simulations, $\tau = 9.843$ and $34.451$, with constant velocity in figure 15 and constant strain rate in figure 16. The mean volume fraction profiles at the earlier time appear very similar, collapsing to the unstrained mean volume fraction profile. The profile for $\overline {f_1\, f_2}$ shows an observable difference. Whilst the edges of the mixing layer appear to be similar, the peak of the profiles vary noticeably. A peak value of 0.25 would occur if every cell along the plane was 50 % $f_1$ and 50 % $f_2$. An increase in the peak of $\overline {f_1\, f_2}$ for the expansion cases is indicative of greater homogeneity near the mixing layer centre. Likewise, the compression cases have a reduced maximum suggesting that less mixing has occurred.
Planar-averaged volume-fraction profiles for the constant velocity cases: (a,b)  $\tau =9.843$; (c,d) $\tau =34.451$.

Planar-averaged volume-fraction profiles for the constant-strain-rate cases: (a,b)  $\tau =9.843$; (c,d) $\tau =34.451$.

At late time where only the data for the weaker strain cases are available the effects of the strain rate on mixing becomes more prominent. There is some slight variation in the mean volume fraction profile on the bubble side. For the mean volume fraction product, the difference in the maxima at the centre of the mixing layer is evident, with the expansion case having a much larger peak than the unstrained and the compressed case. In the  $\theta$-group paper (Thornber et al. Reference Thornber2017), the peak of $\overline {f_1\, f_2}$ remains almost unchanged between $\tau =25$ and $\tau =196$. The difference observed in the mean volume fraction product reinforces the observation of the increased mixing (i.e. higher value of $\varTheta$) observed for the expansion case compared with the unstrained case, and suggests the axial strain rate causes the mixing layer to no longer collapse down to a self-similar profile.
4.3.4. Turbulent kinetic energy
The total turbulent kinetic energy in the domain, defined by
 \begin{equation} TKE = \iiint \frac{1}{2} \rho u_i'' u_i'' \,{{\rm d}\kern 0.06em x} \,{{\rm d}y}\,{\rm d} z, \end{equation}
is plotted in figure 17. For all cases the turbulent kinetic energy is decreasing due to dissipation. At late time the unstrained case can be expected to fit a power-law spectrum of the form  $t^{3\theta -2}$ (Thornber et al. Reference Thornber, Drikakis, Youngs and Williams2010). Whilst the unstrained case is heading towards this trend, the strained cases make a deviation. The compression cases show a larger amount of $TKE$ compared with the unstrained domain, whilst the expansion cases show a decrease in the total turbulent kinetic energy. This is to be expected from the Reynolds stress transport equation, where the shear production contributes to the Reynolds stress as
 \begin{equation} \frac{{\rm D} \overline{\rho u''_i u''_j}}{{\rm D} t} \propto{-}\overline{\rho u''_i u''_k} \frac{\partial \tilde{u}_j}{\partial x_k}-\overline{\rho u''_k u''_j} \frac{\partial \tilde{u}_i}{\partial x_k}. \end{equation}
Total turbulent kinetic energy for (a) constant velocity and (b) constant strain rate.

In rapid-distortion theory, the primary contributions to the Reynolds stress are shear production and pressure scrambling. These simulations are not in the rapid-distortion limit, evident by the dominating role of dissipation on the turbulent kinetic energy. With applied axial strain rates, there is a strong contribution from  $\partial \bar {u}_1/\partial x_1$ which will only directly contribute to the $x$-turbulent kinetic energy. The directional components for the domain integrated turbulent kinetic energy can be calculated by
 \begin{equation} TKX = \iiint \frac{1}{2} \rho u_1'' u_1'' \,{{\rm d}\kern 0.06em x} \,{{\rm d}y} \,{\rm d} z,\quad TKY = \iiint \frac{1}{2} \rho u_2'' u_2'' \,{{\rm d}\kern 0.06em x} \,{{\rm d}y} \,{\rm d} z. \end{equation}
The value of  $TKX$ is plotted in figure 18 and shows the same trend as the total turbulent kinetic energy. Due to the negative sign in the Reynolds stress equation, a negative strain rate corresponds to an increase in the turbulent kinetic energy, which is what is observed in the simulation results. For the $y$- and $z$-directions, the production terms are not expected to make the same level of contribution as there is no applied mean strain rate to the flow. The $y$-turbulent kinetic energy is plotted in figure 19 and whilst it does show an increase in turbulent kinetic energy for the compression cases, and a decrease for the expansion, the contribution appears to be diminished compared with what is observed in the $x$-turbulent kinetic energy. It can be expected that some of the turbulent kinetic energy will be redistributed from $x$ to $y$ and $z$ due to the pressure scrambling. To see how the strain rates affect the distribution of the turbulent kinetic energy, it is possible to look at the level of anisotropy of the flow given by
 \begin{equation} TKR = \frac{2 TKX}{TKY + TKZ}. \end{equation}
For an isotropic flow, this value would collapse to one. As stated previously, RMI is observed to be persistently anisotropic both experimentally and in simulations, with FLAMENCO's anisotropy at  $\tau =246$ reaching $TKR=1.49$ (Thornber et al. Reference Thornber2017). The anisotropy is plotted in figure 20 and shows a strong divergence from the unstrained behaviour. This suggests that the pressure scrambling is not able to move the turbulent kinetic energy to/from the axial direction faster than it is removed/produced at the simulated strain rates. With insufficient turbulent kinetic energy redistribution the strained simulations will not achieve the unstrained self-similar anisotropy, instead becoming more anisotropic during strain application. For the compression cases, the turbulent kinetic energy becomes focused in the $x$-direction, reaching values above $TKR=2$. The expansion cases have decreasing $TKR$, heading towards isotropy. The highest constant-strain-rate case shows that the decreasing trend continues past isotropy, and the turbulent kinetic energy is becoming focused in the transverse directions due to the removal of the axial turbulent kinetic energy by the mean velocity gradients. The changes in turbulent kinetic energy can explain the changes in the mixing layer growth rate compared with the unstrained case. As the compression cases have increased axial velocity fluctuations, it is possible for the fluid to achieve greater entrainment of bulk pure fluid into the mixing layer, lowering $\varTheta$, whilst the expansion cases have lower entrainment thus increasing $\varTheta$.
Turbulent kinetic energy in the  $x$-direction for (a) constant velocity and (b) constant strain rate.

Turbulent kinetic energy in the  $y$-direction for (a) constant velocity and (b) constant strain rate.

Anisotropy of the turbulent kinetic energy for (a) constant velocity and (b) constant strain rate.

4.3.5. Vorticity
In compressible rapid-distortion theory, the vorticity equation has two linear contributions, the vortex stretching contribution for 3-D flows and the compressibility contribution (Blaisdell, Coleman & Mansour Reference Blaisdell, Coleman and Mansour1996):
 \begin{equation} \frac{{\rm D}\omega_i}{{\rm D} t} = \omega_j \frac{\partial u_i}{\partial x_j} - \omega_i \frac{\partial u_k}{\partial x_k}, \end{equation}
where  $\omega _i$ is the vorticity defined by
 \begin{equation} \omega_i = \epsilon_{ijk} \frac{\partial u_k}{\partial x_j}, \end{equation}
and  $\epsilon _{ijk}$ is the Levi-Civita symbol. If (4.22) is considered with only the mean axial strain rate, the contributions for the in-plane vorticity, $\omega _x$, will cancel out. The out-of-plane components do not experience vortex stretching directly from the mean strain rate, but will decrease from the compressibility term for expansion cases, and increase for the compression cases. In figure 21, the total enstrophy of the domain is plotted. The enstrophy is given by
 \begin{equation} \varOmega = \iiint \rho \omega_i \omega_i \,{{\rm d}\kern 0.06em x} \,{{\rm d}y} \,{\rm d} z. \end{equation}
Due to the interpolation process onto the finer grid for the expansion cases, the initial enstrophy is artificially increased in the direction of the cell-splitting. The total enstrophy decreases with time, dominated by the dissipation contribution like the turbulent kinetic energy. Compared with the unstrained case, the expansion cases decrease faster whilst the compression cases decrease at a slower rate. By including the dissipation, a rudimentary model can be created for the enstrophy components in each direction:
 \begin{equation} \frac{\partial}{\partial t} \left(\begin{array}{ccc} \varOmega_x \\ \varOmega_y \\ \varOmega_z \end{array}\right) ={-} 2 \bar{S}_{11} \left(\begin{array}{ccc} 0\\ \varOmega_y\\ \varOmega_z \end{array}\right) - \epsilon_\varOmega .\end{equation}
Total enstrophy for (a) constant velocity and (b) constant strain rate.

The dissipation rate,  $\epsilon _\varOmega$, is a function of the enstrophy component and is modelled using the unstrained strain-rate case. The unstrained vorticity components decay with a power-law exponent $n=1.4$,
 \begin{equation} \varOmega \propto \left(\frac{\tau}{\tau_0} \right)^{{-}n}. \end{equation}
Equating the derivative and the dissipation rate, and rearranging to remove time dependence gives the expression
 \begin{equation} -\epsilon_\varOmega ={-} \frac{n}{\tau_0 \varOmega_0^{1/n}} \varOmega^{(n+1)/n}. \end{equation}
 Assuming the strained cases maintain this quasi-equilibrium relationship between the enstrophy and enstrophy dissipation rate, the model in (4.25) is closed assuming some initial condition values,  $\tau _0$ and $\varOmega _0$.
Looking at the in-plane component of vorticity in figure 22, there is a small spread in the values. The derived enstrophy model suggests that the  $\varOmega _x$ should remain unchanged from the unstrained case (hence, the model's omission from the plot), however there is a slight variation in the direction consistent with the compressibility effects.
Enstrophy in the  $y$–
$y$– $z$ plane for (a) constant velocity and (b) constant strain rate.

An example of the out-of-plane contribution is shown in figure 23 for the  $\omega _y^2$ component. Also plotted is the enstrophy model for each case, solved using the values at $\tau =3$ for the initial conditions of the differential equation. The model is well aligned with the ILES results, accurately predicting the relative decrease in enstrophy for the expansion cases and relative increase for the compression cases as compared with the unstrained case. This out-of-plane vorticity can be considered responsible for moving fluid through the mixing layer, whilst the in-plane vorticity mixes the fluid within the layer. Whilst the in-plane vorticity is slightly decreased for the expansion cases, the decrease in the out-of-plane vorticity is larger. The expansion cases observe a relative increase in the in-plane vorticity as a result, and this aligns with the observed increase in the $\overline {f_1\, f_2}$ profile and mixedness of the layer. In contrast, the compression cases see a relative decrease in the in-plane vorticity compared with the out-of-plane vorticity. This phenomenon can also be explained simply by thinking of the axis of the effective mixing vortices being tilted in the direction of the strain rate. For expansion, the axis is tilted towards the $x$-axis, causing more mixing in the in-plane direction as opposed to the out-of-plane direction. For compression the vortex axis is tilted to point orthogonal to the $x$-axis, causing less in-plane mixing.
Enstrophy in the  $x$–
$x$– $z$ plane for (a) constant velocity and (b) constant strain rate. Solid lines indicate ILES results, dashed lines indicate the enstrophy model.

4.3.6. Turbulent mass flux
The turbulent mass flux is a quantity that only arises in variable-density and compressible flows, resulting from the velocity fluctuations that are correlated to the density fluctuations:
 \begin{equation} a_i = \frac{\overline{\rho' u_i'}}{\bar{\rho}} = \overline{-u_i''} = \tilde{u}_i-\bar{u}_i. \end{equation}
The turbulent mass flux is responsible for the conversion of potential energy to turbulent kinetic energy, and acts in source term for the density-specific-volume covariance. A transport equation for the turbulent mass flux is common in turbulence models for hydrodynamic instabilities, with the equation first derived by Besnard et al. (Reference Besnard, Harlow, Rauenzahn and Zemach1992). As the flow is primarily one-dimensional, the transverse components should be statistically zero, and analysis can focus on the axial component (Wong et al. Reference Wong, Baltzer, Livescu and Lele2022). The axial turbulent mass flux has a source term from the mean velocity gradient, similar to the Reynolds stress transport equation,
 \begin{equation} \frac{{\rm D} a_1}{{\rm D} t} \propto a_1 \frac{\partial \bar{u}_1}{\partial x_1}. \end{equation}
Whilst this source term is included in the Besnard et al. (Reference Besnard, Harlow, Rauenzahn and Zemach1992) k-S-a model (Banerjee et al. Reference Banerjee, Gore and Andrews2010), it is excluded in the k-L-a model (Morgan & Wickett Reference Morgan and Wickett2015) as it was deemed insignificant for the cases considered. The profile for the axial turbulent mass flux is plotted in figure 24 near the simulation end times. As expected from the transport equation, the compression cases maintain larger values of  $a_1$. The profiles are asymmetric for all cases, showing a greater skew to right, towards the lighter fluid, which was also observed in the work of Wong et al. (Reference Wong, Baltzer, Livescu and Lele2022) for RMI before and after re-shock. Wong et al. (Reference Wong, Baltzer, Livescu and Lele2022) also observed the peaks of the profiles tending towards the heavy fluid, however this was for plots of $\bar {\rho } a_1$. The same trend would be visible if $\bar {\rho } a_1$ were plotted for the strain cases, however the density scaling has been avoided as the density varies between the cases due to the compression or expansion, which further exacerbates the difference between the profiles.
Axial turbulent mass flux for (a,c) constant velocity cases and (b,d) constant-strain-rate cases: (a,b)  $\tau =9.843$; (c,d) $\tau =34.451$.

4.3.7. Buoyancy-drag
The results in figures 9, 11 and 12 show that the background velocity correction is not sufficient to predict the growth of RMI with axial strain. This is in part due to the vortex tilting that arises due to the axial strain rate, causing a change in the entrainment and mixing. Three correction terms are proposed for the velocity equation in the buoyancy-drag model, corresponding to the equivalent terms of  ${\rm d}/{\rm d} t(\bar {S}W)$. The corrections are chosen to take this form such that the strain-rate contributions are isolated and the same effective drag length scale can be used for all cases. For the three mixing layer length scales, the new equations are given by
 \begin{gather} \frac{{\rm d} W}{{\rm d} t} = V + W \bar{S},\quad \frac{{\rm d} V}{{\rm d} t} ={-} \frac{V^2}{l^{eff}(\bar{\lambda},W)} + C_1 \bar{S} V + C_2 \bar{S}^2 W + C_3 \dot{\bar{S}} W , \end{gather}
 \begin{gather}\frac{{\rm d} h_b}{{\rm d} t} = V_b + h_b\bar{S},\quad \frac{{\rm d} V_b}{{\rm d} t} ={-} \frac{V_b^2}{l^{eff}_b (\bar{\lambda},h_b)} + C_{b_1} \bar{S} V_b + C_{b_2} \bar{S}^2 h_b + C_{b_3} \dot{\bar{S}} h_b , \end{gather}
 \begin{gather}\frac{{\rm d} h_s}{{\rm d} t} = V_s + h_s \bar{S},\quad \frac{{\rm d} V_s}{{\rm d} t} ={-} \frac{V^2}{l^{eff}_s (\bar{\lambda},h_b)} + C_{s_1} \bar{S} V_s + C_{s_2} \bar{S}^2 h_s + C_{s_3} \dot{\bar{S}} h_s. \end{gather}
 The method used to calculate the optimum coefficients uses all strain cases for the optimisation process and uses the covariance matrix from the optimisation process to estimate the uncertainty in the coefficients. Each length scale coefficient set, denoted as  $\hat {\theta }$, was optimised separately by minimising the corresponding error, $S(\hat {\theta })$, between the ILES results and the corrected buoyancy-drag model for the strained cases. For a given set of coefficients, the buoyancy-drag equations were numerically integrated using an ordinary differential equation solver. The mean square residual for each strain case was calculated, and the total error was taken to be the sum of the mean square residuals. The minimisation process returns the inverse Hessian, $H_{\hat {\theta }}^{-1}$, for the coefficient set used. The covariance matrix, $\hat {V}$, is estimated by scaling the inverse Hessian by the reduced chi-squared statistic $\chi ^2$,
 \begin{gather} \hat{V} = \chi^2 H_{\hat{\theta}}^{{-}1}, \end{gather}
 \begin{gather}\chi^2 = S(\hat{\theta})/(n-p), \end{gather}
where  $n$ is the number of data points used, and $p$ is the degrees of freedom (Vugrin et al. Reference Vugrin, Swiler, Roberts, Stucky-Mack and Sullivan2007). The variance of each coefficient corresponds to the trace of the covariance matrix. The optimised coefficients and the standard deviations are listed in table 5.
Optimised coefficients for the buoyancy-drag model.

The  $C_1$ coefficient for all length scales has the largest magnitude and the smallest uncertainty. The range of values for $C_1$ are spread from $-$1.5 for the bubble to $-$1.86 for the integral width, suggesting the buoyancy-drag model requires a strain drag term that replicates the decreased growth from the vortex stretching in expansion cases, and increased growth for compression cases. The $C_2$ coefficients are all positive, showing a tighter spread but differing by up to a factor of two between length scales. Unlike the $C_1$ term which may be positive or negative depending upon the sign of the strain rate, the $C_2$ term is always positive causing the correction to increase the growth rate for all strained cases. The $C_3$ term only activates for the constant velocity cases, whereby it opposes the $C_2$ term. The optimised coefficients for $C_3$ were the smallest coefficients of the three. For all length scales, the two standard deviation confidence interval for $C_3$ includes zero, suggesting the coefficient is not statistically significant.
The corrected buoyancy-drag model for the integral width is presented in figure 25. The corrected model is well aligned to the ILES results. Likewise, the corrected model for the bubble height is plotted in figure 26, and also shows close agreement. The results for the spike height are plotted in figure 27 and it can be seen that this model does not perform as well as the others as it is not able to capture the compression cases. The reason that the corrected model does not work for the spikes could be due to the usage of the bubble height in the effective length scale for the spike drag. Whilst the effective length scales for the bubble and spike for the unstrained case were able to be approximated as a function of the bubble height in the work of Youngs & Thornber (Reference Youngs and Thornber2020a), this may not be the case for the strained cases presented here. This may be in part due to the changing spike-to-bubble ratio as shown in figure 13.
Corrected buoyancy-drag model for the integral width: (a) constant velocity and (b) constant strain rate. Solid lines indicate ILES results, dashed lines indicate the buoyancy-drag model.

Corrected buoyancy-drag model for bubbles: (a) constant velocity and (b) constant strain rate. Solid lines indicate ILES results, dashed lines indicate the buoyancy-drag model.

Corrected buoyancy-drag model for spikes: (a) constant velocity and (b) constant strain rate. Solid lines indicate ILES results, dashed lines indicate the buoyancy-drag model.

A physical meaning for the correction terms can be obtained by analysing the turbulent kinetic energy. A simplified one-dimensional equation for the mean turbulent kinetic energy may be considered, with the form
 \begin{equation} \bar{\rho} \frac{{\rm D} k}{{\rm D} t} ={-}\bar{\rho} \widetilde{u_1'' u_1''} \frac{\partial \tilde{u}_1}{\partial x_1} - \bar{\rho} \epsilon. \end{equation}
It is possible to adapt the equation for the evolution of the turbulent velocity,  $V = \sqrt {2k}$. Introducing a turbulent length scale $L$, the Reynolds stress is modelled using a Boussinesq eddy viscosity assumption,
 \begin{gather} \bar{\rho} \widetilde{u_i'' u_j''} = \frac{2}{3} \bar{\rho}k\delta_{ij} - \mu_T \left(\frac{\partial \tilde{u}_i}{\partial x_j} + \frac{\partial \tilde{u}_j}{\partial x_i} - \frac{2}{3} \frac{\partial \tilde{u}_k}{\partial x_k} \delta_{ij} \right), \end{gather}
 \begin{gather}\mu_T = C_\mu \bar{\rho} V L, \end{gather}
and the dissipation is given by
 \begin{equation} \epsilon = C_\epsilon \frac{V^3}{L}. \end{equation}
Assuming only the axial strain rate,  $\tilde {S}_{11} = \partial \tilde {u}_1/\partial x_1$, is non-negligible then the turbulent velocity evolves according to
 \begin{equation} \frac{{\rm D} V}{{\rm D} t} ={-} C_\epsilon \frac{V^2}{L} -\frac{1}{3} V \tilde{S}_{11} + \frac{4}{3} C_\mu L \tilde{S}_{11}^2. \end{equation}
This equation bears similarity to the corrected buoyancy-drag model. The first term ( ${\propto }V^2/L$) is the drag term, which originally corresponded to the dissipation of turbulent kinetic energy. The second and third terms are the results of the inclusion of the shear production for the turbulent kinetic energy, and have the same form as the two additional terms introduced into the buoyancy-drag model that were found to have statistically significant values. It is evident then that the introduced terms to the buoyancy-drag model correspond to the effects of shear production on the mixing layer.
5. Conclusion
The influence of axial strain rate on the RMI has been investigated by applying a mean velocity gradient to the flow. Two different strain-rate profiles were utilised, a constant velocity profile and a constant-strain-rate profile. These profiles were able to be enforced in the fluid domain by using a moving mesh, inviscid moving walls boundary conditions, and source terms for the constant-strain-rate profile. This method allows for the controlled application of strain rates in planar geometry, mimicking the strain rates observed in convergent geometry.
A linear potential flow model for RMI and RTI with an axial strain rate, as done by Epstein (Reference Epstein2004), predicts the RMI growth rate to be the sum of the impulsive velocity and the background velocity difference,  $\dot {a} = U_0 + a \bar {S}_{11}$. Resolved 2-D simulations of a single-mode RMI at ${{Re}} = 2048$ were conducted to investigate the model for the linear regime, and utilised a velocity perturbation initialisation. The simulation results showed agreement with the model, in particular with tracking the negative growth for compression cases. The error in the model was proportional to the amplitude, which indicated the error was associated with mode saturation, which is expected for RMI.
The effects of the strain rate on the development of a self-similar mixing layer were conducted by applying strain to the quarter-scale  $\theta$-group case (Thornber et al. Reference Thornber2017), a 3-D, multi-mode, narrowband RMI-induced mixing layer. The simulations were conducted using ILES, with axial strain applied from $\tau =1$, prior to the mixing layer achieving self-similarity. The axial strain increased the mixing layer width for expansion cases and decreased the width for compression cases, however the effect of the strain rate on the mixing growth was less than expected. Under strain, the mixing layer no longer converged to the same self-similar state. The mixedness of the mixing layer increased for the expansion cases and decreased for the compression cases, whilst the turbulent kinetic energy became more focused in the axial direction under compressive strain and shifted towards the transverse directions under the expansive strain. This is a result of the shear production of turbulent kinetic energy from the mean velocity gradients, adding axial turbulent kinetic energy for compressive strain and removing the axial turbulent kinetic energy for expansion cases. The shear production was not balanced out by pressure scrambling to re-balance the turbulent kinetic energy, which as a result caused the compression cases to achieve greater entrainment and decreased the mixedness, whilst the expansion cases had decreased entrainment and increased mixedness.
The buoyancy-drag model calibrated for the unstrained, narrowband RMI (Youngs & Thornber Reference Youngs and Thornber2020a,Reference Youngs and Thornberb) was modified to include the background velocity difference, as was done for the linear regime and has also been done previously for convergent buoyancy-drag models (Miles Reference Miles2009; El Rafei & Thornber Reference El Rafei and Thornber2020). This model was not accurate for the strained cases, and overestimated the influence of the strain rate as it did not take into account the shear production contribution which opposes the background stretching caused by the velocity gradient. Three correction terms were proposed to correct the velocity evolution under the axial strain rate. The coefficients for each term were calibrated to fit the strain cases. Whilst the third term was not found to be statistically significant, the optimised buoyancy-drag model was able to match the ILES results.
Acknowledgements
The authors acknowledge the Sydney Informatics Hub and the use of the University of Sydney's high-performance computing cluster, Artemis. This research was supported by the Australian Government's National Collaborative Research Infrastructure Strategy (NCRIS), with access to computational resources provided by the Setonix supercomputer (https://doi.org/10.48569/18sb-8s43) through the National Computational Merit Allocation Scheme. The authors would like to thank EPSRC for the computational time made available on the UK supercomputing facility ARCHER/ARCHER2 via the UK Turbulence Consortium (EP/R029326/1).
Funding
This research received no specific grant from any funding agency, commercial or not-for-profit sectors.
Declaration of interests
The authors report no conflict of interest.
Appendix. Convergence
The ILES are required to resolve the largest scales, leaving the smallest scales to be modelled by the numerical scheme of the code. Whilst the unstrained quarter-scale  $\theta$-group case is converged (Thornber et al. Reference Thornber2017), the simulations with expansion strain rates experience decreasing mesh resolution, which can increase the numerical dissipation. To mitigate this effect on the solution, the expansive cases use a solution interpolated onto a finer mesh with twice as many cells in the axial direction, ensuring the final expanded mesh size is not larger than the original mesh size. To show that the integral properties are converged, the unstrained and the constant-strain expansion case $\hat {S}=0.081$ were conducted with the original and refined mesh. The results in figure 28 show that the integral width and molecular mixing fraction are converged. The refined unstrained mesh also uses the wall boundary condition in the axial direction, showing that the inclusion of the walls in the $x$-direction does not affect the solution.
Effect of axial interpolation for (a) integral width and (b) molecular mixing fraction. Solid lines indicate original mesh, dashed lines indicate refined mesh with interpolated solution.


 Open access