1 Introduction
Glaciers have been recognized as an indicator of changing climate because their dimensions change in response to surrounding climatic conditions, and therefore monitoring of glaciers has been carried out worldwide. In the Nepal Himalaya, monitoring of terminus positions of small debris-free glaciers has been conducted since the 1970s. Higuchi and others (1978, 1980) compiled a glacier inventory for the Dudh Kosi region and compared the lowest elevations of glaciers with those compiled by Müller (1970). They concluded that 85% of the 110 glaciers retreated during the approximate period 1960–75. Fushimi and Ohata (1980) studied the fluctuations of 14 glaciers from 1970 to 1978 and showed that seven glaciers retreated, three were stationary, three advanced and one was irregular. Then it was observed that several of these glaciers retreated in the following decade (Yamada and others, 1992).
An investigation of the relation between terminus position and climatic variation is useful for the prediction of future glacier extent, as well as for the reconstruction of past climate. For the purposes of such an analysis, knowledge of the glacier regime, especially the mass balance and ice flow, is necessary. Of the glaciers monitored in the Nepal Himalaya, glacier AX010 in Shoroug Himal, east Nepal, is the most suitable for analysis because its mass balance, ice flow and surface profile were well studied in 1978–79 (Ageta and others, 1980; Ageta, 1983; Ikegami and Ageta, 1991).
Observations on this glacier have been carried out three times since 1979: in 1989,1991 and 1995. In 1989, only terminus position was measured. In 1991, a topographical mapping of almost the whole area of the glacier was carried out by means of a ground survey. In 1995, annual monitoring of this glacier was initiated by means of ground surveys, stake methods and topographical mapping in order to obtain its mass balance, surface velocity and areal extent, and then link them within a climatic context. In this paper, we describe some observational results since 1978, and discuss the glacier profile expected in the near future.
2 Observational Results
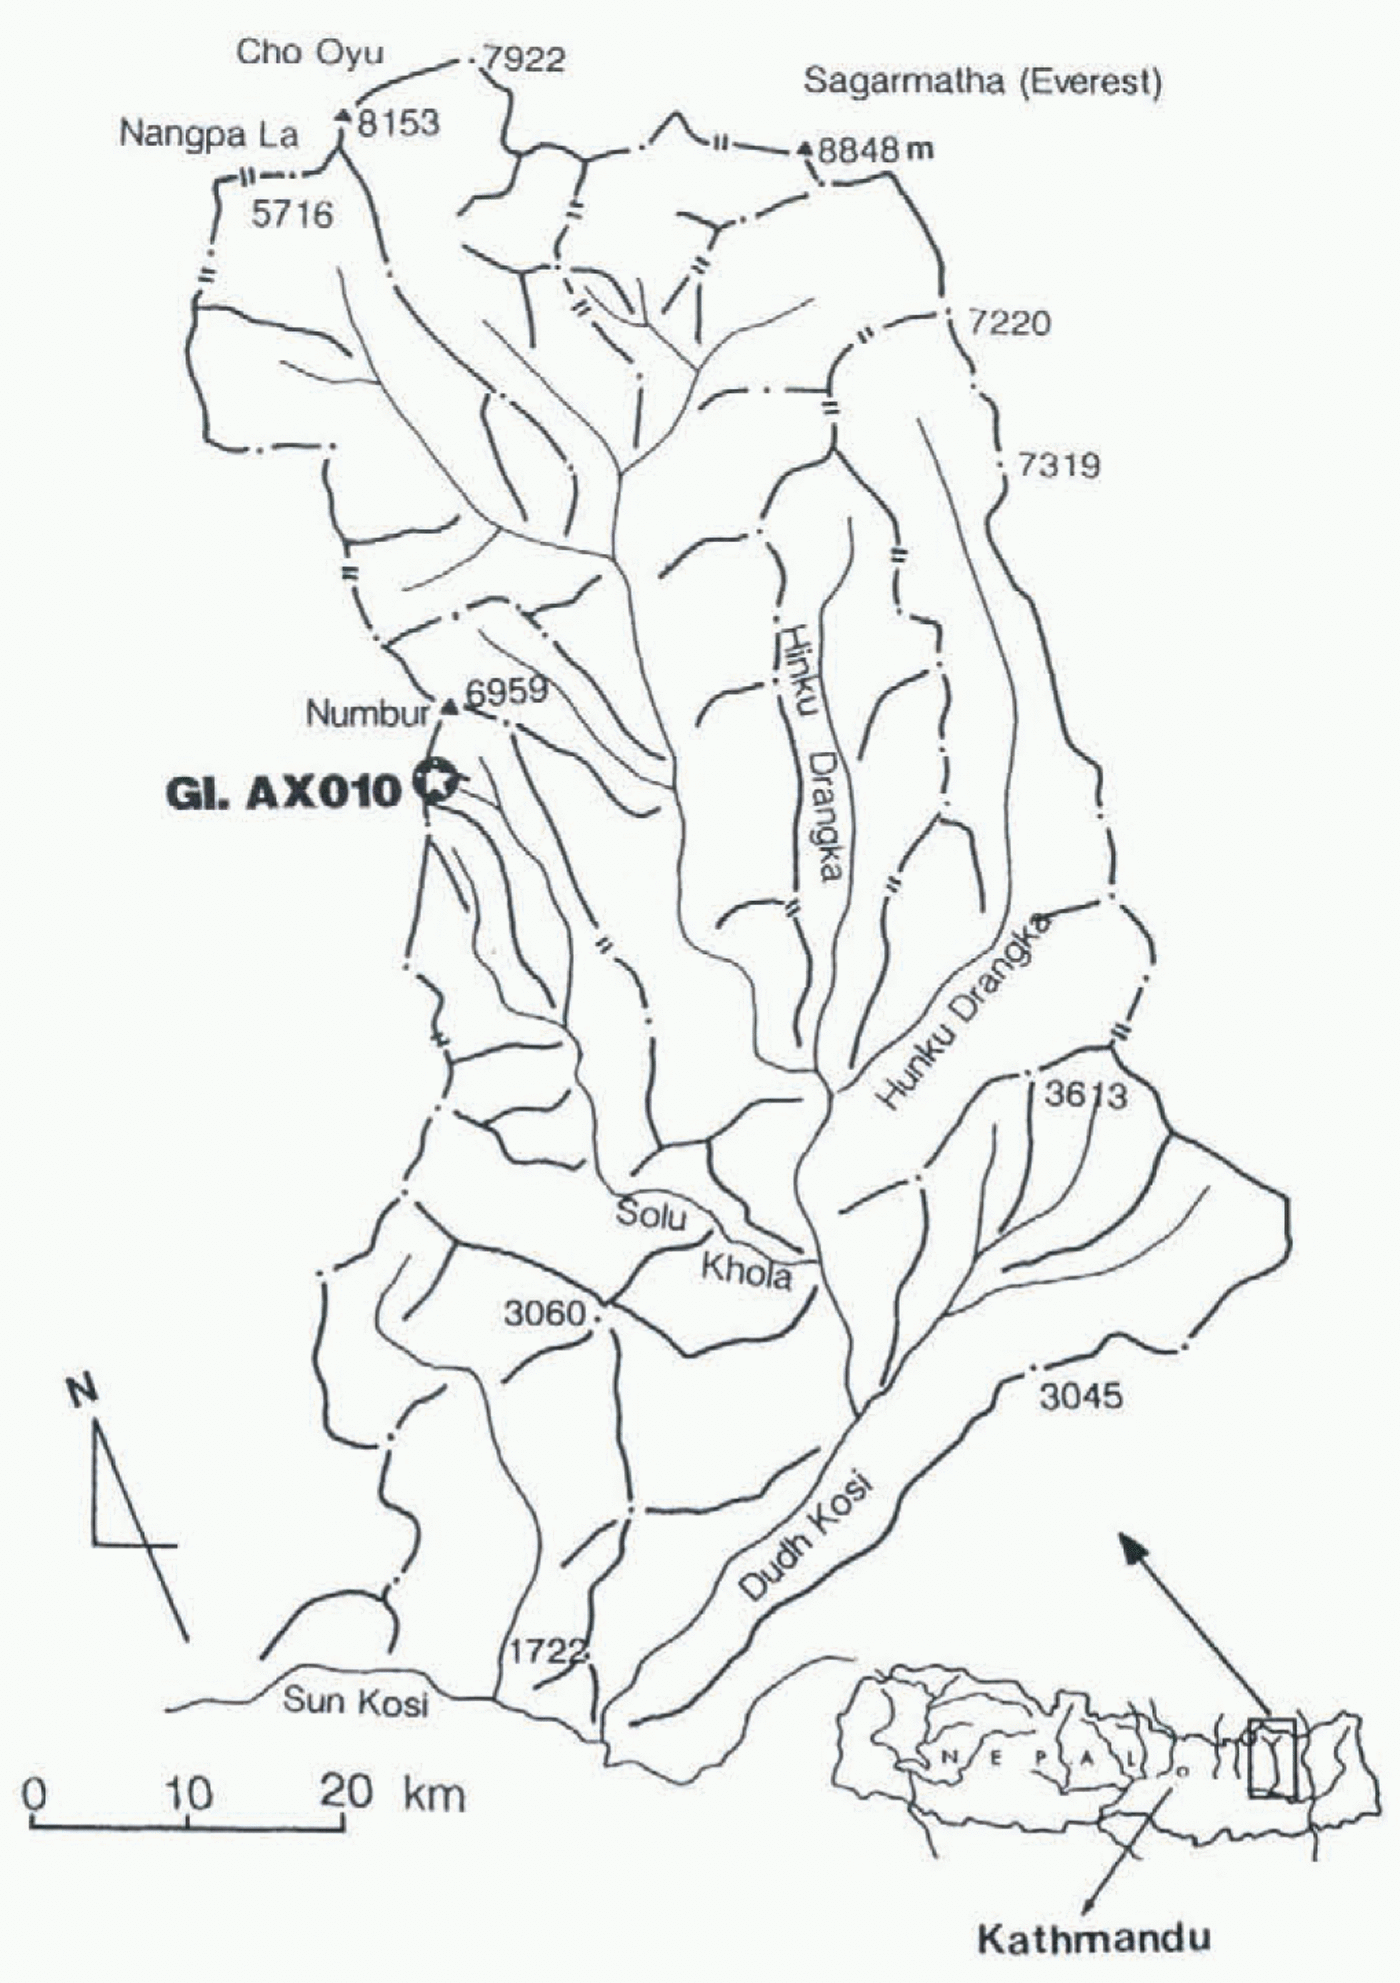
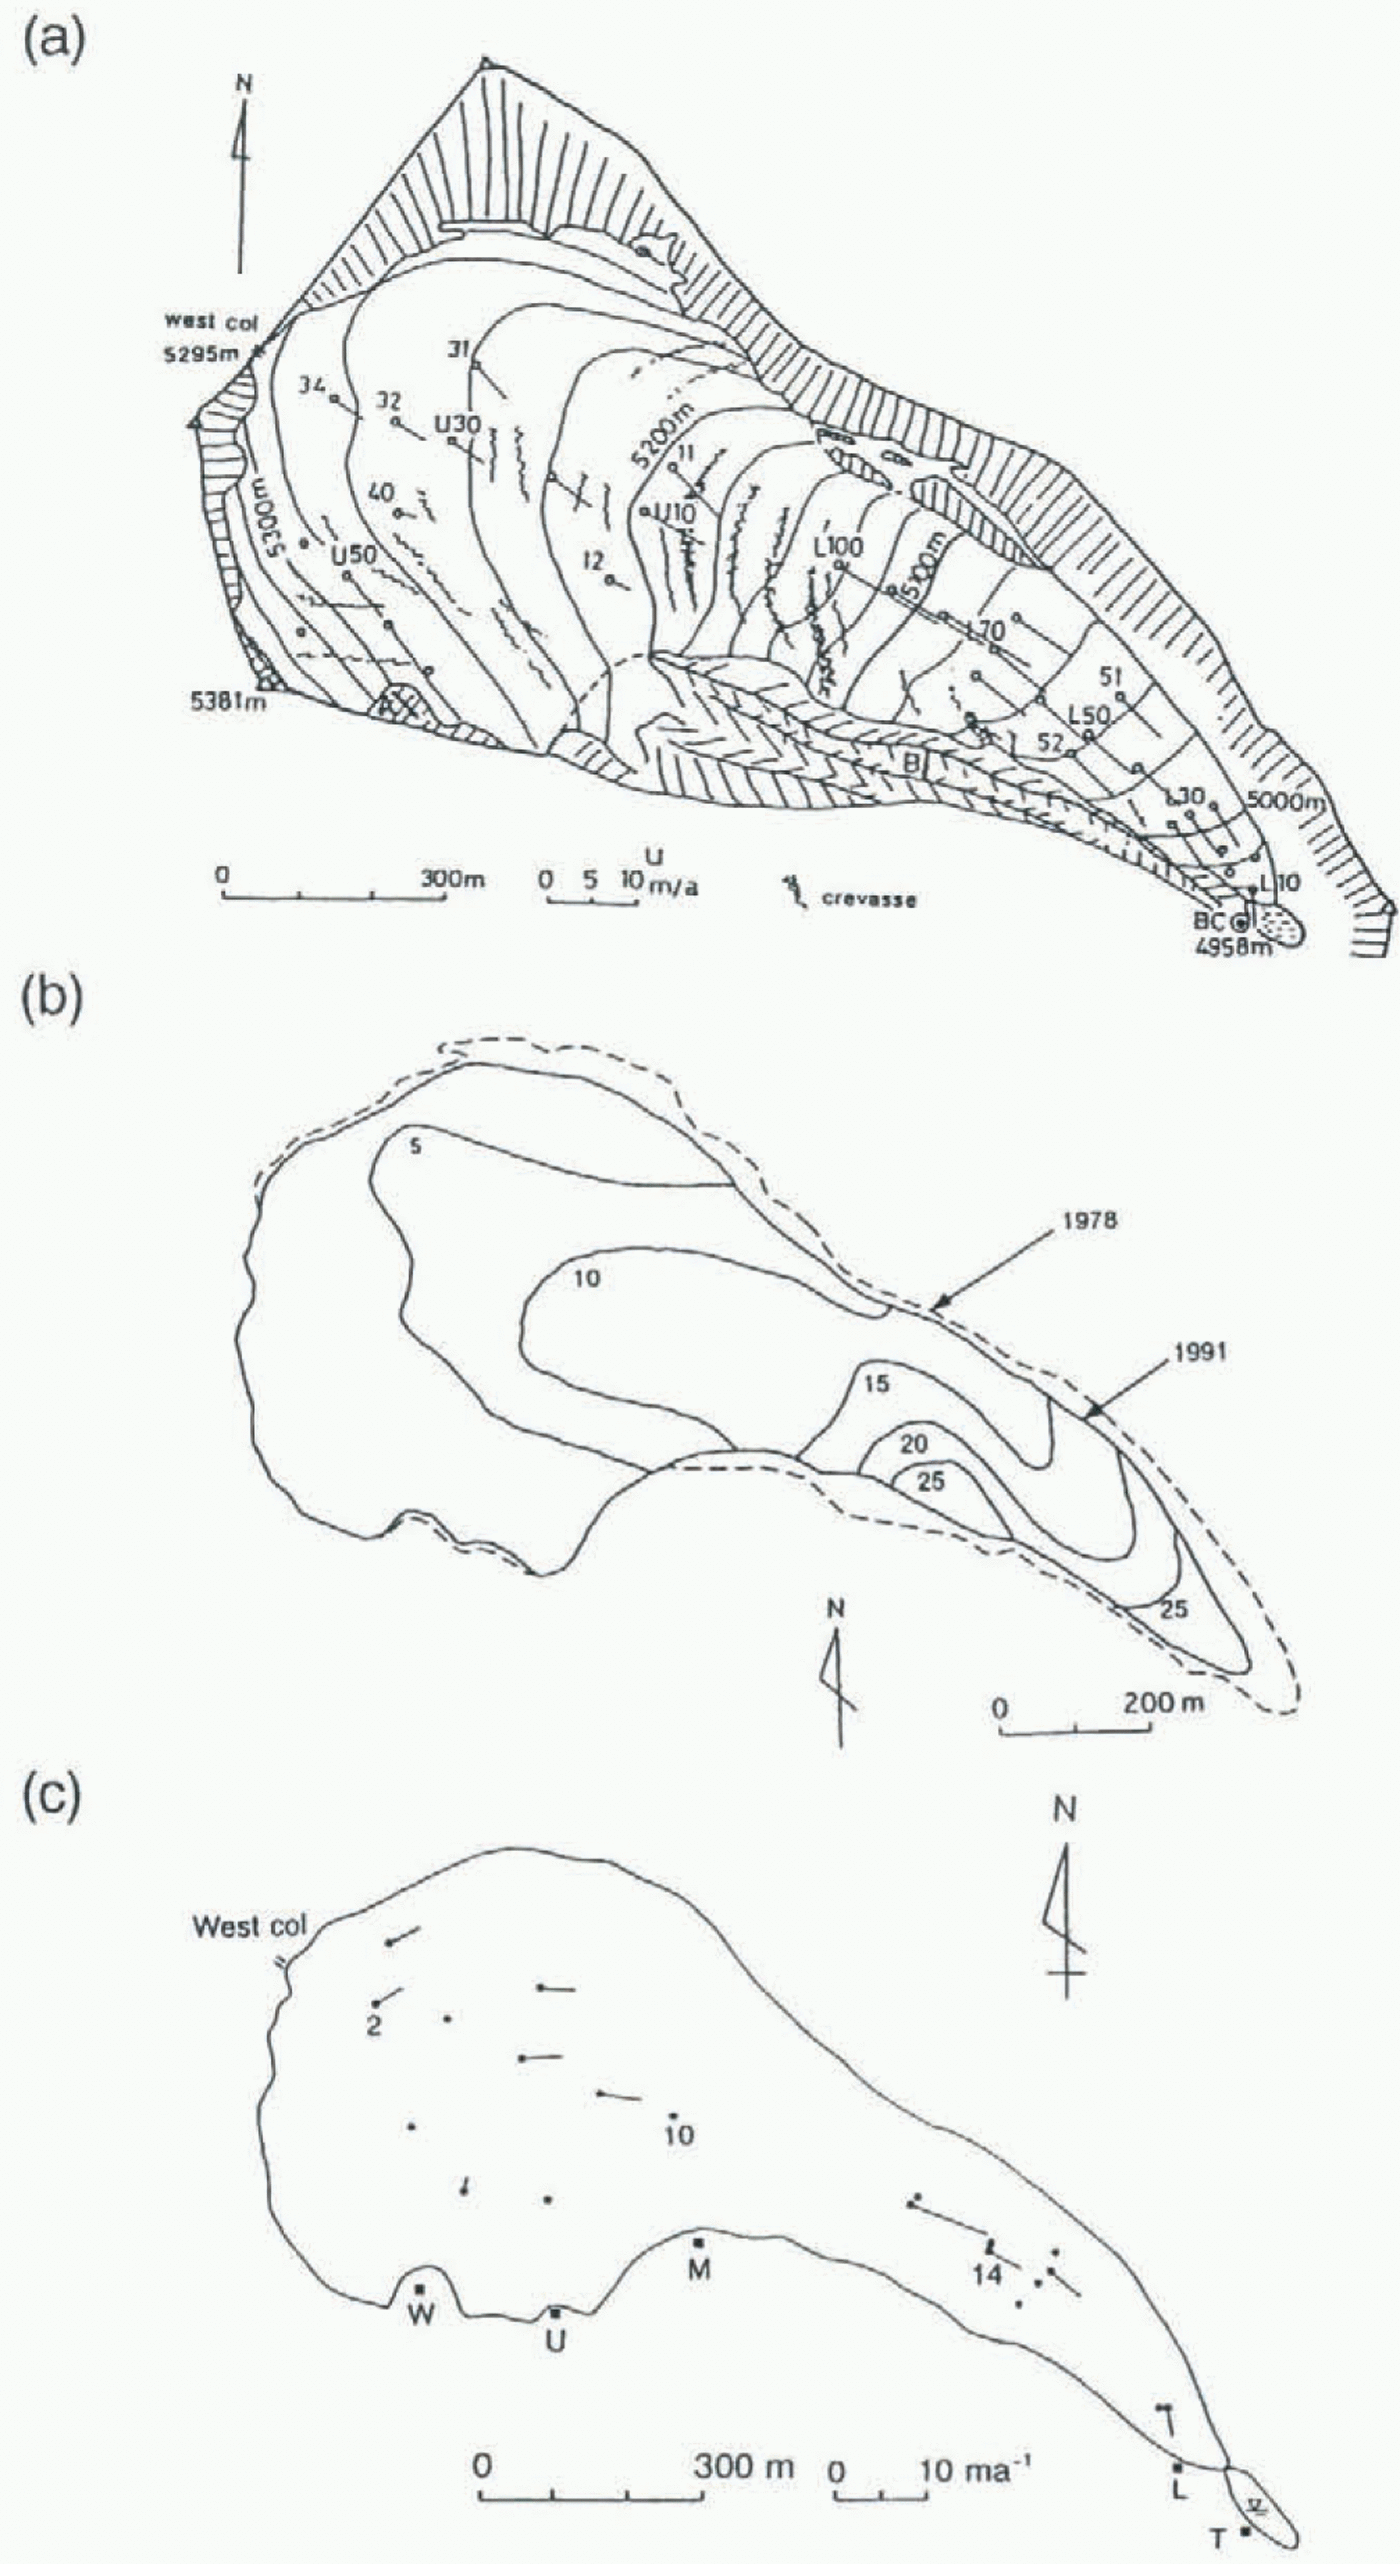
The location of glacier AX010 is shown in Figure 1. The length and area as of 1978 are 1.57 km and 0.57 km2 (Fig. 2a).
2.1. Position of the terminus
The glacier retreated by about 30, 28 and 12 m during the periods 1978–89, 1989–91 and 1991–95, respectively.
2.2. Surface level, area and volume (or mass balance)
figure 2b shows the change in surface level and area from 1978 to 1991 derived from the two maps obtained in those years. The surface area is reduced to about 90% of the extent in 1978. The surface level lowered more than 25 m around the terminus and about 20 m on average at the lower part of the glacier. Resulting volume loss is estimated to be about 4.8 × 10⁶ m3 (Kadota and others, 1993, revised). Assuming all the loss was in the form of ice and that the density
Location of glacier AX010.

of the ice is 850 kg m−3, the mean annual area-averaged mass balance for the period 1978–91 is calculated to be about −53 cm of water, which is comparable to that observed in 1978–79.
2.3. Horizontal surface velocity
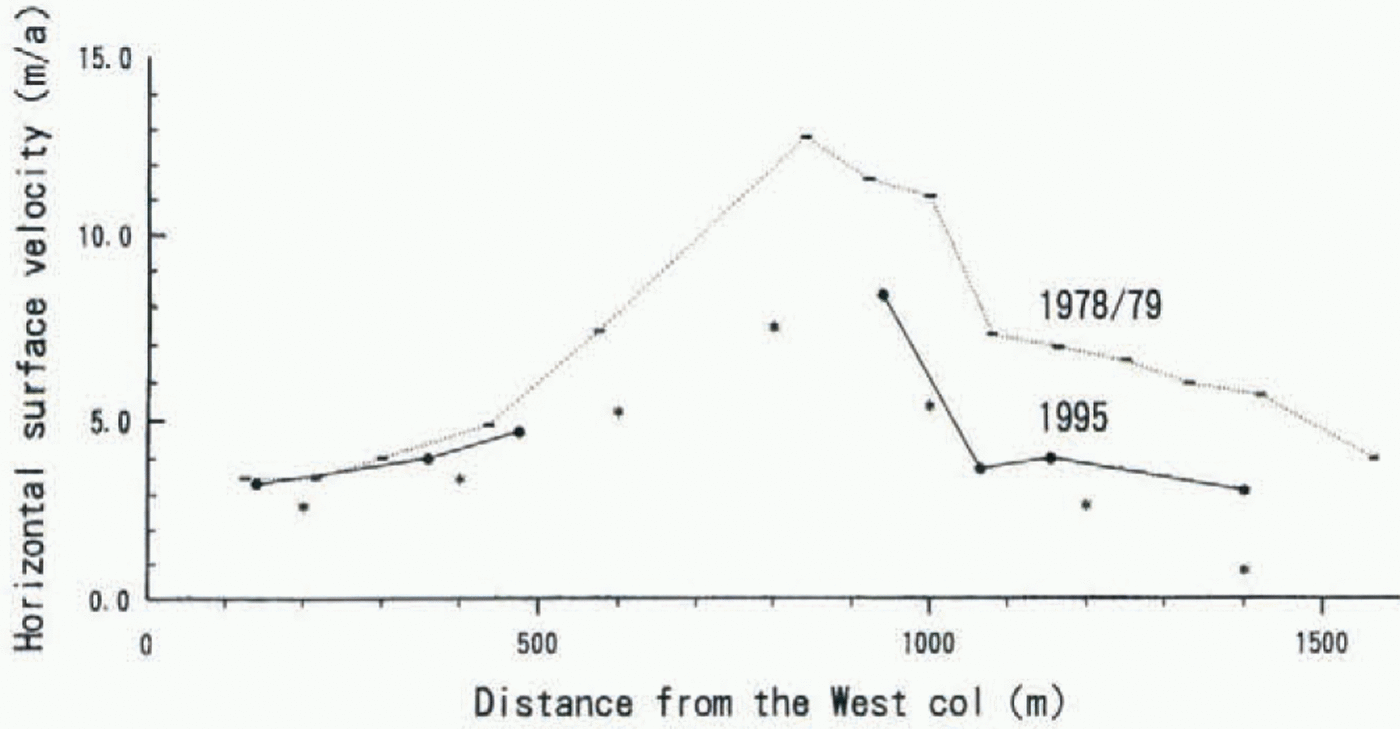
In June 1995, we set 11 stakes (increased to 20 in October) on the glacier and measured their positions. Remeasuring their positions in October, we obtained the surface ice velocities shown in figure 2c. (One of eleven velocities is omitted due to measurement error.) Figure 3 shows horizontal surface velocities along the center line of the glacier in 1978–79 (September–September, 357 d; after Ikegami and Ageta, 1991) and in 1995 (20 June–10 October, 112 d). Although the season and duration of measurements are different, there is a noticeable decrease of about 50% at the lower part in 1995.
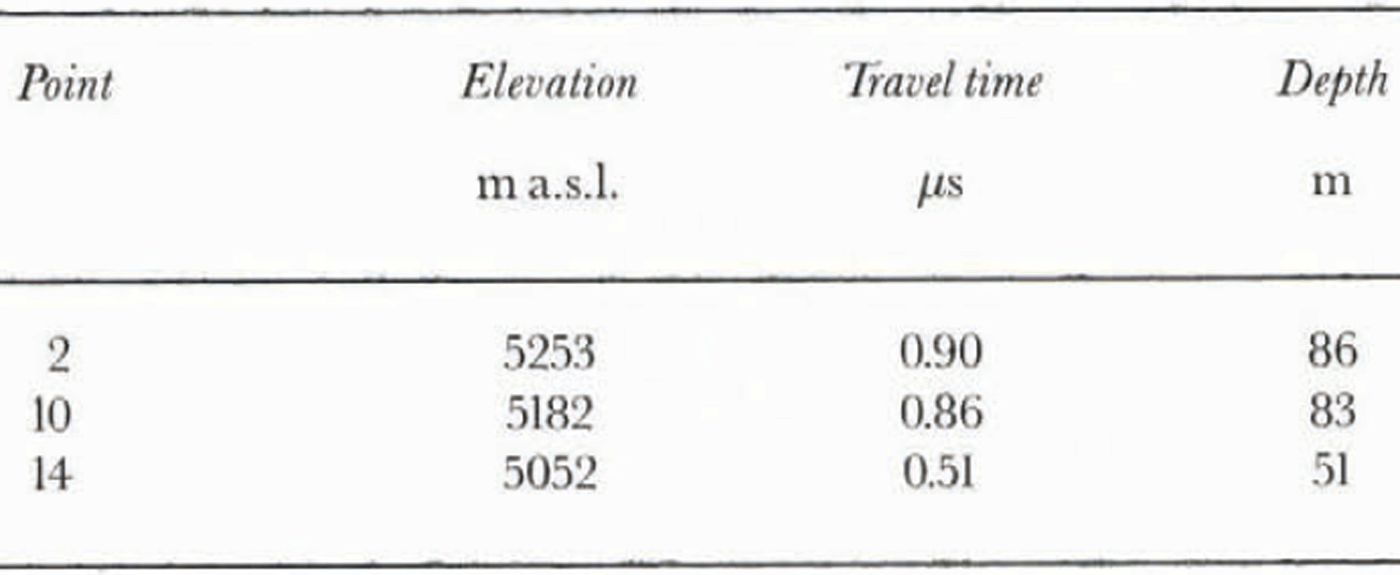
2.4. Ice thickness
We carried out radio-echo sounding at three points of the glacier in June 1995, indicated in figure 2c. The transmitter was constructed at the Ohio State University, powered by 12 V battery, and produces a short pulse signal of a few hundred volts in amplitude which is radiated using a resistively loaded dipole antenna. The center frequency of the transmitted signal was about 5 MHz. An identical dipole antenna to the transmitter was used with a receiver. The transmitted and returned signals were recorded by the oscilloscope (Tektronix Digital Storage Oscilloscope) and photographed,
(a) Topography and distribution of horizontal ice velocities of glacier AX010, 1978–79 (A, baseline of survey for upper stakes; B, that for lower stakes), after Ikegami and Ageta (1991). (b) The extent of glacier AX010 in 1978 (broken line) and 1991 (solid line). Lowering of surface elevations during the period 1978–91 is shown by isolines with 5 m interval. (c) The stake positions (solid circles) set in 1995 on glacier AX010 and distribution of surface velocities. The solid squares indicate the benchmarks for surveying. Radio-echo sounding was executed at Nos. 2, 10 and 14. The extent of the glacier is approximately drawn base on the 1991 map.
then travel time was measured. The ice thicknesses were calculated by the following equation.

where t is travel time (μS), s is antenna separation (50 m), c is the speed of light in a vacuum (300 m μS−1), ξi is the relative dielectric constant of ice (3.17), and D is depth (m).
The results are given ill Table 1.
Results of ice thickness observations at three points on glacier AX010

Horizontal surface flow velocities along the center line of glacier AX010 in 1978–79 (dotted line) and 1995 (solid line). Marks on the lines indicate the data points. Asterisks indicate the calculated ones for 1995 (see text for details).

3 Prediction Of Future Surface Profile
3.1. Model for glacial flow and mass balance
In previous papers, we introduced a model of flow and mass balance for this glacier and then discussed the relation between the obtained changes in the glacier and climate (Kadota and Ageta, 1992; Kadota and others, 1993). The ice thicknesses obtained by radio-echo sounding in 1995, however, are different from those estimated by the previous flow model: the former are greater than the latter. We examined the previous model on the basis of the observed ice thicknesses.
In the previous model, we used the following empirical equation (after Paterson, 1970) to calculate basal sliding velocity:
where U b is basal sliding velocity (m a−1), α is the surface slope of the glacier, and Z is ice thickness measured vertically (m).
If we input Z (83, 86, 51) to Equation (2), the calculated basal sliding velocities exceed the observed surface velocities. This means that the above empirical equation giving basal sliding velocity is not applicable to this glacier. Therefore we use an alternative one (after Budd and others, 1979), as described below.
where U is surface velocity parallel to the glacier surface, U d is deformational velocity (m a−1), U b, is basal sliding velocity (m a−1), Z is ice thickness measured vertically (m), τ is basal shear stress, c 1 is a constant (0.06 Pa−15 a−1), and c 2 is a constant (1800 m2 a−1 Pa−l5).
From the above equations, we can get the following equation.

If we have surface velocity and ice thickness, Equation (6) gives basal sliding velocity. Assuming that year-to-year change in Equation (5) is only ice thickness (i.e. U b α Z 2), we get the following equation.

where ![]() is basal sliding velocity in the next year, and ΔZ is ice thickness change in the next year. Then, if we know ice thickness change in the next year, we can get surface velocity in the next year from Equations (7) and (6).
is basal sliding velocity in the next year, and ΔZ is ice thickness change in the next year. Then, if we know ice thickness change in the next year, we can get surface velocity in the next year from Equations (7) and (6).
The mass-balance model is unchanged. Ageta (1983) presented empirical formulae to estimate specific mass balance of this glacier based on the observational data obtained in 1978 and 1979. Summer (June–September) balance is given by functions of mean summer air temperature (hereafter T s) and summer precipitation (hereafter P s). As glacier AX010 is under the influence of the summer monsoon, both accumulation and ablation concentrate in this season. Further, summer balance can be considered to be almost equivalent to the annual one (Ageta and others, 1980). The equations are as follows (Ageta, 1983):


where C s is accumulation in summer (cm water), a s is ablation in summer (cm water), b s is balance in summer (cm water), T s is mean summer air temperature (°C), and P s is summer precipitation (cm water).
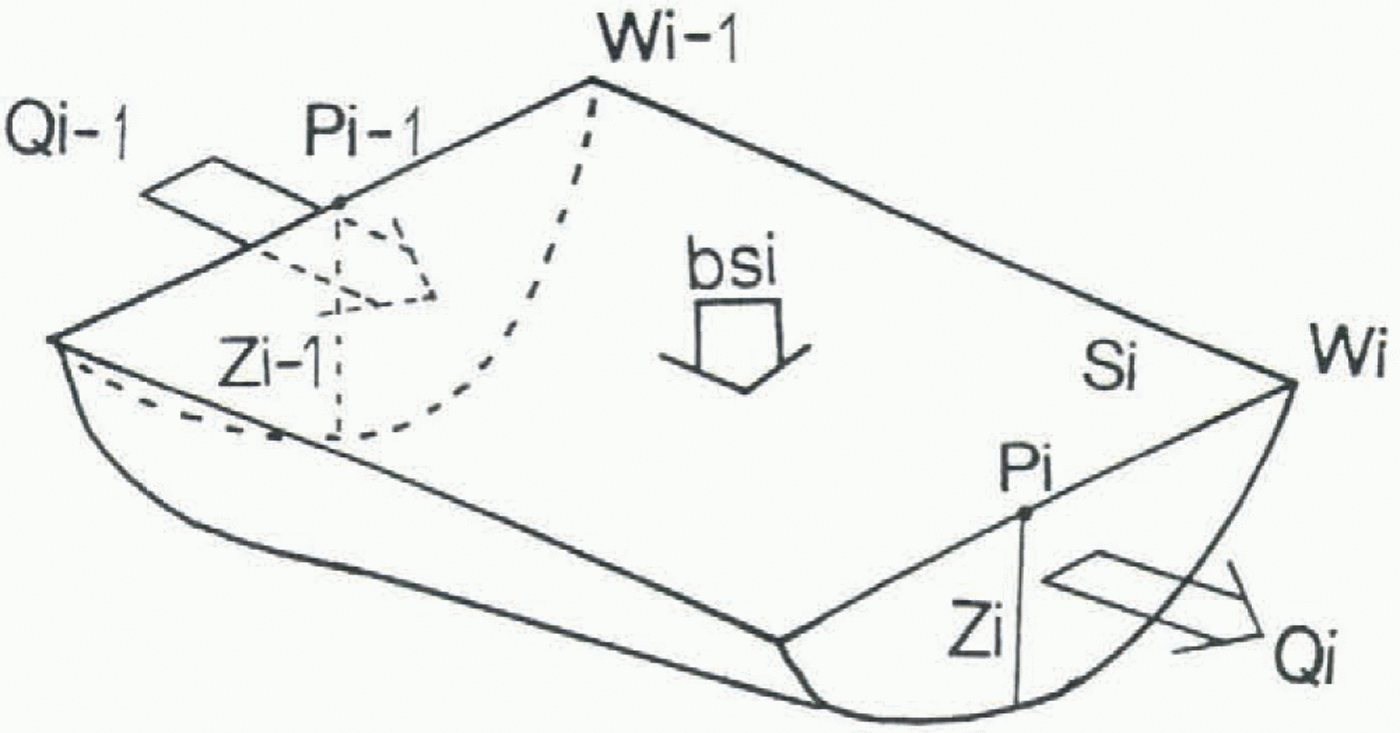
The glacier was divided into eight sections (200 m intervals in horizontal length) along the center flowline. Figure 4 shows a schematic chart of a section of the glacier. Here Q i = f iU siZ iW i, then the flow model is combined with the mass-balance model through b si by the following equation:

where Q i is ice flux through the cross-section at P i, f i is the shape factor which relates the mean cross-section velocity/ area to the ice thickness Z and the surface width W, W i is surface width measured along the contour line through grid point, ΔZ i is area-averaged ice-thickness change rate for each section, b si is area-averaged mass balance for each section,
A section of the glacier, as defined by the model with the symbols in the text Glacier AX010 is divided into eight such sections (i: 1–8).

S i is surface area of segment i, and i is 1–8, number of grid point/section.
3.2. Prediction of future surface profile
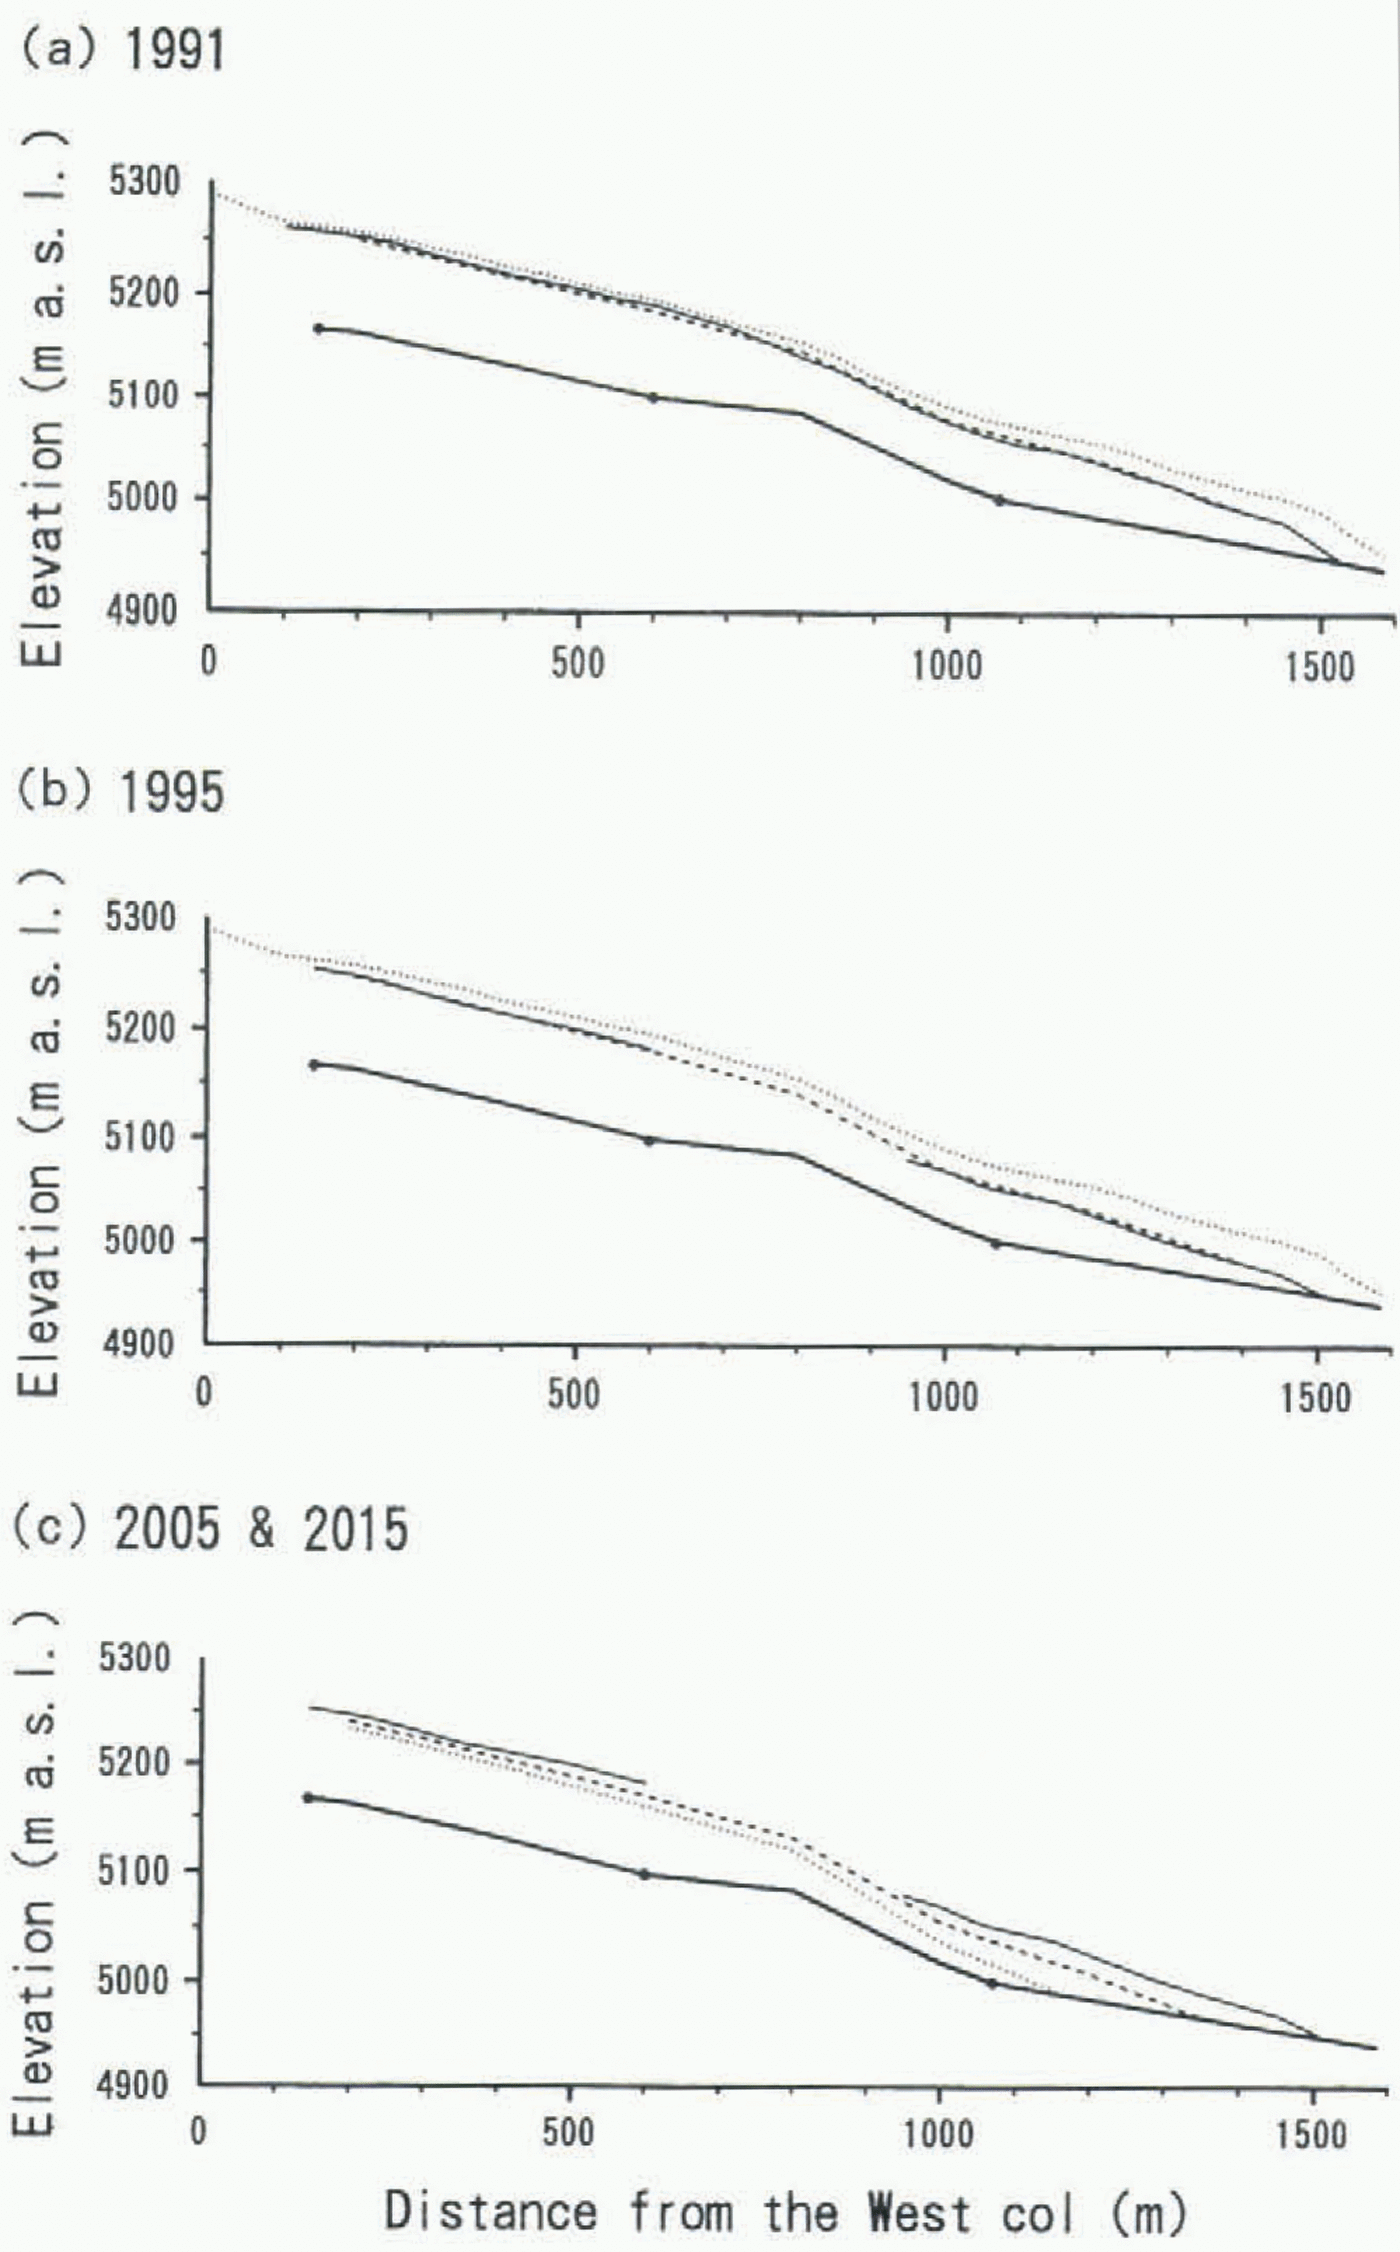
Using the annual surface velocities/profile in 1978/79 and bed profile estimated from the radio-echo sounding data as the initial conditions, preferable parameters (T s, P a and f i) which give similar surface profiles to those in 1991 and 1995 were examined. T s on the glacier were calculated using a lapse rate (−0.6°C per 100 m), and P s was fixed as 140, a value closely observed in 1978 and uniform on the glacier (after Ageta and others, 1980). A good fit was obtained as shown in figure 5a and b, by setting T s (elevation 4960 m a.s.l.) at 2.5, 3.9 and 2.9 in 1978–79, 1989–91 and 1991–95, respectively.
Hence, we examined future surface profiles in the next 10 and 20 years for the ease that T s and P s remain unchanged from 1995 onward. Because the whole area of the glacier undergoes ablation, the glacier never reaches its equilibrium state under these climatic conditions. figure 5c shows surface profiles obtained from the model run for the years 2005 and 2015. Accompanied by further shrinkage in the tongue of the glacier, terminus retreat rate is predicted to accelerate as shown in figure 5c (about 17 ma−1 on average).
4 Discussion
4.1. Climatic conditions and the state of the glacier since 1978
In the previous study, we derived T s (2.5) and P& s (140) at the terminus (about 4960 m a.s.l.) as mean values for the period 1978–89 (Kadota and Ageta, 1992). The present study upholds this conclusion. The rate of terminus retreat from 1989 to 1991 (14.1 m a−1) is far larger than that from 1978 to 1989 (2.8 m a−1), then decreases to nearly the same level after 1991 (3.1 m a−1). Consequently, the present model gives higher T s than that for the period 1978–89, +1.4 and +0.4 for the periods 1989–91 and 1991–95, respectively. Mean air temperature during the period 21 June–30 September 1995 obtained at an elevation of 5308 m (near the W in figure 2c) was 0.9° C, which gives 3.0° C at the terminus (assuming the same lapse rate of −0.6° C per 100 m). This value compares well to the model result. Increase of summer air temperature raises the ratio of rain to summer precipitation. This
Longitudinal surface profiles along the center line of glacier AX010. (a, b) measured (solid hue) and calculated (broken line) in l99l (a) and 1995 (b), the dotted line indicating the measured profile in 1978. and (c) calculated for the years 2005 (broken line) and 2015 (dotted line). The measured profile in 1995 (thin solid line) is also shown for comparison. The thick solid line shows an estimated bed profile based on the radio-echo sounding data in 1995 (solid circles).
reduces the albedo of the glacier surface, then accelerates ablation of the glacier as well as decrease of accumulation. Under such air-temperature conditions, variation in the amount of precipitation does not affect the model results.
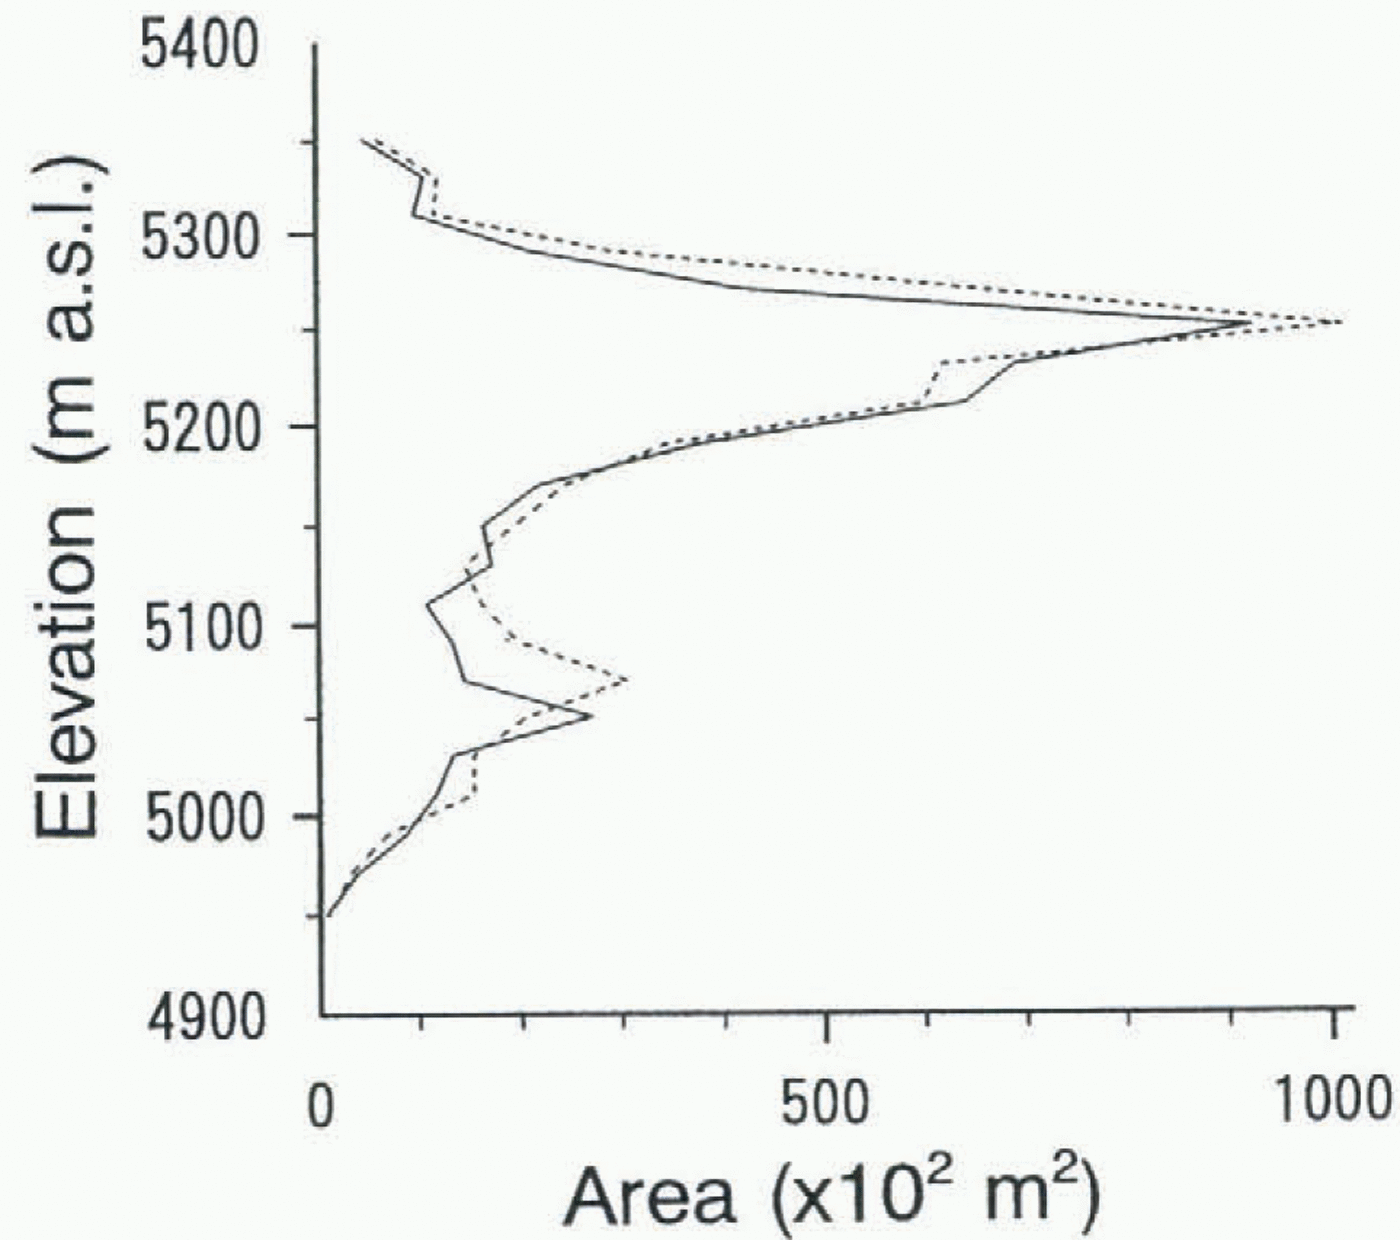
In addition to the above, decrease of surface level of the glacier due to ice loss causes change in its area–altitude distributions. Figure 6 shows the area–altitude distributions of the glacier in 1978–79 and 1991, obtained from maps made during those years (area was measured with an elevation interval of 20 m). The downward shift of the lower peak can be seen in the figure. This means that the lower part of the glacier tends to be located in lower elevations and results in further shrinkage. Under present climatic conditions. shrinkage of the glacier will continue.
4.2. Evaluation of the model
(a) Flow velocity Ice-velocity change in the model is controlled by the ratio of ice thickness change to the original thickness (Equation (7)). A high ratio at the tongue results in a large reduction of
The area–altitude distributions (20 m interval) of glacier AX010 in 1978 (dotted line) and 1991 (solid line). Downward shift of lower peak can be seen.
speed in the calculation. The calculated velocity for 1995 is 0.8 m a−1, whereas the measured one is 3 m a−1. The difference is rather large even if seasonal variation of velocity is considered. This discrepancy would arise mainly from uniform application of the flow model to the whole of the glacier or, in other words, would show the limitations of the model. The empirical formula applied in this study shows that basal sliding is dominant in this glacier (>80% of the total). Therefore, basal conditions such as water pressure, which would vary from place to place, would play an important role in the ice flow regime. No such information, however, has been obtained on this or on any other glacier in the Nepal Himalaya. Furthermore, efforts to obtain a time-dependent empirical formula, including basal condition, for basal sliding velocity have not been successful so far. The velocities calculated by the model, however, are considered to compare well with the measured ones, except for the lowermost part (see Fig. 3).
(b) Prediction As discussed in section 4.1, the climatic conditions, which govern the mass balance of the glacier, derived from the model are considered to be quite plausible. In addition, model tunings in reconstructing surface profiles were successfully performed for two periods, 1978–91 and 1978–95. Although some problems remain unsolved in the model, we believe that these may not apply so much to profile calculation. Therefore, it can be concluded that, based on present understanding of this glacier, the future surface profiles were properly predicted.
5 Concluding Remark
Glacier AX010 in Shorong Himal, east Nepal, has been shrinking since the end of the 1970s. A prediction from a simple model shows this shrinking tendency will continue and accelerate in the near future even if climatic conditions remain unchanged from 1995.
Both the mass-balance and flow models may still be incomplete and should be improved by reducing assumptions/estimations such as those concerning the bed profile of the glacier. The monitoring started in 1995 will accumulate and provide useful information for improving and/or developing the model to study the relation between glacier and climate.
Acknowledgements
We would like to express our gratitude to the staffs of the Department of Hydrology and Meteorology, Ministry of Water Resources, His Majesty’s Government of Nepal, for their cooperation in our research. We are also indebted to Mr J. P. Lama Sherpa and his staffs for their logistical support and their help in our fieldwork. We greatly thank Mr F. Huffman of The Ohio State University, Columbus, U.S.A., who constructed the ice radar system for us. We are also grateful to two reviewers, Dr J. O. Hagen and Prof. W. D. Harrison, whose comments improved the manuscript. This study was supported by a grant of the International Scientific Research Program, sponsored by the Ministry of Education, Science, Sports and Culture of Japan (No. 06041051).