

Se is an essential trace element( Reference Rotruck, Pope and Ganther 1 – Reference Schwarz and Foltz 3 ) present in foods in a multitude of chemical species( Reference Dumont, Vanhaecke and Cornelis 4 ). Inorganic Se species, including selenite and selenate, are commonly used in dietary supplements and experimental diets. Organic Se species, such as the protein-incorporated amino acid selenomethionine (SeMet), predominate in the natural food chain( Reference Dumont, Vanhaecke and Cornelis 4 ) and in commercially produced Se-enriched yeast (Se-yeast)( Reference Polatajko, Jakubowski and Szpunar 5 ). Both inorganic and organic Se sources can be utilised for de novo synthesis of selenocysteine (Sec)( Reference Papp, Lu and Holmgren 6 ), which is utilised in, and essential for, the translation of Se-dependent proteins termed selenoproteins( Reference Brigelius-Flohé 7 ). While it is clear that Se per se is important for health, the Se status range for positive health benefits in humans appears to be small( Reference Papp, Lu and Holmgren 6 ). Furthermore, it is unclear how much of the positive health effects of Se are a direct result of selenoprotein-incorporated Se or from non-protein-incorporated Se, particularly in relation to the carcinostatic activity of Se( Reference Spallholz 8 – Reference Sunde and Raines 10 ). With regard to Se status, mammalian selenoproteins can be broadly classified into two main groups. The first group contains stress-related selenoproteins and includes glutathione peroxidase 1 (GPX1), GPX3 and selenoprotein P1 (SEPP1). The second group contains housekeeping selenoproteins including deiodinases and GPX4( Reference Brigelius-Flohé 7 , Reference Sunde, Raines and Barnes 11 , Reference Mariotti, Ridge and Zhang 12 ). The GPX family are intra- and extracellular antioxidant proteins, which couple H2O2 reduction with oxidation of glutathione (GSH) to glutathione disulphide (GSSG), while SEPP1 is the putative primary blood Se transport protein( Reference Kohrle, Jakob and Contempre 13 , Reference Burk and Hill 14 ). Cellular Se deficiency reduces mRNA and protein levels of the stress-related selenoproteins to a far greater degree than the housekeeping selenoproteins. This preferential allocation of Se to housekeeping over stress-related selenoproteins when cellular Se is limited is termed the selenoprotein hierarchy( Reference Brigelius-Flohé 7 , Reference Kohrle, Jakob and Contempre 13 ). Consequently, the activity( Reference Hilton, Hodson and Slinger 15 ) and mRNA expression( Reference Sunde, Raines and Barnes 11 , Reference Weiss, Evenson and Thompson 16 , Reference Weiss, Evenson and Thompson 17 ) of stress-related selenoproteins, such as GPX1, have been used as biomarkers of Se requirements in vertebrates, as they normally respond to changes in Se status.
Zebrafish (Danio rerio; ZF) is a model species whose short generation time, genetic traceability and transparent embryos allow the study of early vertebrate development( Reference Kahn 18 ). A total of thirty-eight Sec-containing proteins are putative in ZF( Reference Mariotti, Ridge and Zhang 12 ), compared with twenty-five and twenty-four in humans and rats, respectively( Reference Kryukov, Castellano and Novoselov 19 ). This difference appears to be due mainly to a genome duplication that occurred in a common ancestor of ray-finned fish( Reference Meyer and Schartl 20 ). Thus, the genome of ZF differs from that of mammals, as it often contains paralogues of the mammalian gene orthologue. For example, ZF have paralogues (a and b) of the gpx1 and sepp1 genes found as single copies in rodents and humans( Reference Mariotti, Ridge and Zhang 12 , Reference Kryukov and Gladyshev 21 ). It is unclear whether the gene paralogues of ZF respond to changes in Se status in a similar manner, or whether they conform to the selenoprotein hierarchy identified in mammals.
Most of the nutritional requirements of ZF, including Se, remain unknown, and the ZF community currently uses various diets of relatively unknown nutrient composition( Reference Penglase, Moren and Hamre 22 ) and nutritional intake can affect experimental outcomes( Reference Kozul, Nomikos and Hampton 23 , Reference Wang, Tranguch and Xie 24 ). There is thus a growing awareness of the need to identify the nutritional requirements to subsequently standardise ZF diets in order to minimise unintended variability between experiments( Reference Penglase, Moren and Hamre 22 ).
Therefore, the present study investigated how Se status affects GPX activity, oxidative status, the mRNA expression of gpx1a, gpx1b, sepp1a and sepp1b, reproduction and F1 generation locomotor activity. From 27 to 254 d post-fertilisation (dpf), ZF were fed diets with Se levels ranging from 0·09 to 30 mg/kg dry mass to cover the known Se requirements of fish( 25 ), using Se-yeast as the Se source. We found that the ZF paralogues of gpx1 were co-regulated and responded to changes in Se status, while the paralogues of sepp1 were not co-regulated and only sepp1a responded to changes in Se status. We also show that a relationship exists between Se intake and fertility, and between offspring activity and parental Se intake.
Materials and methods
Diets
For the present study, seven isometric diets were formulated (Table 1) and substituted with increasing levels of Se-yeast (Sel-Plex® 2000, 2000 mg Se/kg; Alltech) in place of yeast to obtain Se levels covering the known Se requirements of fish (0·25–0·7 mg/kg DM( 25 )), and including putative deficient and toxic levels. The small particle size required for ZF feed represents a technical challenge, as the high ratios of surface area:volume of ZF feeds can result in rapid leaching of water-soluble nutrients such as free amino acids( Reference Kvåle, Yúfera and Nygård 26 ). Se-yeast retains a high percentage of Se after immersion in water( Reference Penglase, Hamre and Sweetman 27 ), as the largest Se fraction in Se-yeast is protein-incorporated SeMet( Reference Encinar, Sliwka-Kaszynska and Polatajko 28 ). Therefore, instead of using chemically pure free SeMet, which may readily leach from the feed before ingestion, the use of Se-yeast in experimental ZF diets allows for the ingestion of a controlled level of SeMet, aiding scientists to more accurately link the intake level of Se with the effects observed. The levels of added Se-yeast and measured Se concentrations in each diet were as follows: treatment 1 – 0 Se-yeast g/kg diet DM, mean 0·09 (sem 0·001) mg Se/kg diet DM; treatment 2 – 0·03 Se-yeast g/kg diet DM; mean 0·18 (sem 0·03) mg Se/kg diet DM; treatment 3 – 0·09 Se-yeast g/kg diet DM, mean 0·30 (sem 0·006) mg Se/kg diet DM; treatment 4–0·16 Se-yeast g/kg diet DM, mean 0·50 (sem 0·004) mg Se/kg diet DM; treatment 5–0·23 Se-yeast g/kg diet DM, mean 0·65 (sem 0·10) mg Se/kg diet DM; treatment 6 – 0·4 Se-yeast g/kg diet DM, mean 1·0 (sem 0·02) mg Se/kg diet DM; treatment 7–15 Se-yeast g/kg diet DM, mean 30 (sem 0·6) mg Se/kg diet DM (all n 2–3). Further details of dietary element concentrations can be found in Supplementary Table S1 (available online). The diets were prepared in a similar manner as stated previously( Reference Halver 29 ), to meet or exceed the nutrient requirements of fish with the exception of Se( 25 ). Briefly, gelatin and astaxanthin were dissolved in hot water, lecithin was dissolved in oil and the two solutions were mixed with dry ingredients using a food mixer. The diets were then dried for 48 h at 42°C, ground, sieved and stored at − 20°C until feeding. Diet sizes (S1–3) at the age of feeding were as follows: S1, 315–560 μm fed 27–53 dpf; S2, 560–850 μm fed 53–86 dpf; S3, 850–1600 μm fed 86+ dpf.
Dietary composition
* MP Biomedical (catalogue no. 02901293).
† Fluka Chemie (catalogue no. 48722, 31400).
‡ Idun.
§ Mollers Tran.
∥ Eldorado.
¶ Merck.
** mg/kg of diet: CaHPO4.2H2O, 15 000; CoCl2.6H2O, 2; CuSO4.5H2O, 10; FeSO4.7H2O, 400; KCl, 15 000; KI, 10; MgSO4·7H2O, 5000; MnSO4.H2O, 80; NaCl, 4298; ZnSO4.7H2O, 200.
†† Sigma-Aldrich.
‡‡ mg/kg of diet: retinol, 1·5; calciferol, 4; α-tocopherol, 65; menadione nicotinamide bisulphate, 5; ascorbic acid, 123; choline, 4000; thiamin mononitrate, 15; riboflavin, 15; pyridoxine.HCl, 20; niacin, 200; inositol, 400; folic acid, 5; calcium pantothenate, 60; biotin, 1; cobalamin, 0·03.
§§ g/kg of diet: betaine, 0·5; Gly, 3; Ala, 0·8; Arg, 5; Met, 5; Val, 3; Tau, 0·2; Glu, 0·3; Asp, 0·3; Ser, 0·3; Lys, 8·1; His, 3; Trp, 4·5; Ile, 5; Leu, 5; Phe, 4; Thr, 2.
∥∥ Carophyll Pink, Hoffmann-La Roche.
¶¶ Alfa Aesar (catalogue no. 036486).
Several commercial ZF diets were analysed for Se concentration (see the ‘Element concentration analysis’ section) and found to contain 2·36 (sem 0·07) mg Se/kg DM (Schwarz diet; Aqua Schwarz GmbH), 1·11 (sem 0·05) mg Se/kg DM (Sera Micron; Sera) and 0·91 (sem 0·02) mg Se/kg DM (Tetra min; Tetra) mg Se/kg DM (all n 2).
Zebrafish
ZF (wild-type AB strain) were maintained, raised and bred as described previously( Reference Westerfield 30 ). Larvae were fed daily in excess (two to three times) from 5 dpf. Between 5 and 8 dpf, larvae were fed dry feed (Sera Micron). From 9 dpf onwards, larvae were fed first-instar Artemia nauplii (Silver Star Artemia; Inter Ryba GmbH) in addition to dry feed. At 10 dpf, larvae were transferred into tanks (3 litres) in a closed recirculation system where they were kept for the trial (Aquatic Habitats). The system was maintained under standard conditions (28·5°C, 500 μS electrical conductivity, pH 7·6, 10 % daily water exchange and 14 h light–10 h dark photoperiod). Between 15 and 26 dpf, larvae were fed twice daily using a mixture of Artemia nauplii and Schwarz diet (size no. 1). At 27 dpf, forty-five larvae (average weight 10·3 (sem 0·7) mg and length 8·9 (sem 0·2) mm, n 30) were randomly stocked per 3-litre tank (three tanks/treatment, twenty-one tanks in total), and feeding of the treatment diets commenced.
From 27 dpf, ZF were fed in excess twice daily (dry weight feed: 5–10 % of tank wet weight (WW) biomass/d, amount adjusted weekly) using diets that were prepared as described in the ‘Diets’ section. At 97 dpf, fish became sexually dimorphic and were pooled into two tanks/treatment containing either males or females. It was found that the sex ratio was heavily skewed towards males, irrespective of treatment (average sex ratio (male:female): 4:1). Treatment 6 was removed at this stage, as preliminary data suggested that Se requirements were obtained within the treatment levels 1 to 5. Fish were reared in sex × treatment tanks (3 litres) for the remainder of the trial. Water samples (filtered 0·45 μm) were taken randomly from tanks at five time points spanning the length of the trial and analysed for element concentrations, as described in the ‘Element concentration analysis’ section, to assess possible contributions of water-borne Se to fish Se status (Table 2). Homogeneous water quality throughout the recirculation system due to rapid water exchange within the tanks (approximately ten to fifteen water exchanges/h) negated the requirement to assess water-borne Se concentrations between the treatments.
Element concentrations in zebrafish-rearing water (Mean values with their standard errors; n 5)
ND, not determined.
Sampling
ZF were sampled for measurements of weight, length, element concentrations, GSH/GSSG, Se-dependent GPX, catalase (Cat) and superoxide dismutase (Sod) activity, thiobarbituric acid-reactive substances (TBARS) and relative mRNA levels of Se-dependent proteins at 27 (0 weeks) and 62 (5 weeks) dpf. Samples for histological assessment and analysis of spleen element content were taken from male fish at 254 dpf. Feed was withheld from fish for 24 h before sampling. All fish were euthanised with tricaine methane sulphonate (MS 222) upon sampling. Immediately upon cessation of gill movements, fish were patted dry with paper towel, measured for weight and standard length, and then placed whole into tubes and immediately frozen on dry ice, except for histological samples (see the ‘Histology and assessment of visual skeletal deformities’ section). At 27 dpf, ZF were sampled similar to fish larvae sampled in Penglase et al. ( Reference Penglase, Nordgreen and van der Meeren 31 ). The samples were stored at − 80°C until analysis. At 62 dpf, fifteen to twenty fish were sampled from each tank, and the remaining fish were sampled at 254 dpf. Frozen fish were pooled and ground with mortar and pestle under liquid N2 before analysis. Subsequent analyses were performed on pooled material from five fish per tank for mRNA analysis and ten to fifteen fish per tank for all the other analyses.
Mating and F1-generation locomotor activity
From 154 dpf, the F0 generation was randomised and pairwise mated within treatments. Treatment males (TM) were also randomised and pairwise mated with non-treatment females (NTF). In the present study, the NTF were standard in-house broodstock wild-type AB line fish maintained under identical conditions, except that they were fed the standard in-house diet (Schwarz/Artemia nauplii, twice daily). The eggs from these crosses were incubated as described previously( Reference Westerfield 30 ). The number of eggs was counted after a 3–4 h mating window, and embryo survival was recorded after 24 h incubation. Successful matings were defined as the crosses that resulted in twenty or more fertilised eggs. To study locomotor activity, 5 dpf larvae from within the treatment crosses were used. Larvae were pippetted into individual wells of ninety-six-well flat bottom plates (Nunc, item no. 269787; Thermo Scientific), and the wells filled with E2 water (400 μl). The plates were then placed into an automated video-tracking system (Viewpoint; ZebraLab), and individual larval movements were recorded using the videotrack quantisation mode for a period of 24 h/plate. An empty plate was used to adjust for background, before measuring larval movements. Within the ZebraLab system, the user sets arbitrary units to define the following parameters: low (fredur), medium (middur) or high (burdur) activity level; light percentage (ranging from 0, darkness to 100 % and full white light); binning time. The settings used were as follows: low:medium:high activity, 7:15:40; light:dark:light, 7:10:7 h, with instant change between light conditions; data were binned into 1 h lots. Within these settings, low activity level is the level at which no movement occurs, so data were further grouped into either no (fredur) or active (middur+burdur) locomotor activity for statistical analyses. After the 24 h experiment, larvae were euthanised with MS 222, rinsed with double-distilled water and frozen at − 20°C until lyophilisation and analyses for element concentrations.
Analytical methods
Element concentration analysis
Element concentrations were determined by wet digesting the samples (100–200 mg DM) with 65 % HNO3 (Suprapur®; Merck) and 30 % H2O2 (Merck) in a microwave system (ETHOS 1600; Milestone), and analysing with ICP-MS (7500 series; Agilent Technologies) along with blanks and controls (Oyster tissue, SRM 1566 b; NIST; lobster hepatopancreas, TORT-2; NRC; mussel tissue, SRM 2977; NIST) as described previously by Julshamn et al. ( Reference Julshamn, Lundebye and Heggstad 32 ). This method was modified for samples with low weights as follows. Freeze-dried larval samples (fifty to eighty larvae: weight 2–4 mg sample) from the locomotor activity study (see the ‘Mating and F1-generation locomotor activity’ section), or WW-fixed spleen samples (0·5–1·6 mg each) from fish fixed for histological assessment were wet digested, and then diluted to 10 ml (instead of 25 ml) with double-distilled water. For spleen samples, low extraction efficiencies for Fe were normalised against the reference material. Low sample weights prevented the quantification of Co in larval samples, plus Cu, Zn and Mn in spleen samples.
Analyses of enzyme activity, reduced/oxidised glutathione and thiobarbituric acid-reactive substances levels
Previously homogenised samples (see the ‘Sampling’ section) were weighed (117 (sem 7) mg, n 23) and transferred into ice-cold 2 ml tubes containing a metal homogenisation ball, diluted 6-fold with ice-cold homogenisation buffer (50 mm-potassium phosphate and 0·5 mm-ethylene glycol tetraacetic acid, pH 7·2) and then milled at thirty shakes/s for 1 min. Samples were spun (1500 g , 5 min, 4°C, Eppendorf Centrifuge 5810 R), and 100 μl of clear supernatant were removed and added to 100 μl of ice-cold buffer (50 mm-potassium phosphate, pH 7·2, 400 mm-mannitol, 130 mm-sucrose and 0·95 mm-ethylene glycol tetraacetic acid) for analysis of Sod activity. The remaining homogenate was spun further (10 000 g , 15 min, 4°C), and 100 μl of clear supernatant (2 × ) were removed and used without further modification for analysis of Cat activity, or added to 100 μl of ice-cold buffer (50 mm-potassium phosphate, pH 7·6, 8 mm-EDTA and 1·6 mm-dithiothreitol) for analysis of GPX activity. A further 50 μl of the clear supernatant were added to 150 μl of 5 % metaphosphoric acid (Oxford Biomedical Research), shaken by hand, centrifuged (20 000 g , 10 min, 4°C), and the clear supernatant removed and used for analysis of total glutathione (tGSH) levels. All extracts were frozen on dry ice immediately upon preparation and stored at − 80°C until analysis.
For analysis of GSSG levels, previously homogenised samples (see the ‘Sampling’ section) were weighed (32 (sem 3) mg, n 23) and added into ice-cold 2 ml tubes containing a metal homogenisation ball and extracted as described previously( Reference Penglase, Nordgreen and van der Meeren 31 ).
Enzyme activities in the extracts were analysed with commercial kits (item no. 706002 (Sod), 703102 (GPX), 707002 (Cat); Cayman Chemical Company). Total GPX activity was corrected for non-Se-dependent GPX activity using blanks without cumene hydroperoxide. GSH/GSSG concentrations were also analysed with a commercial kit (item no. GT35; Oxford Biomedical Research). Protein concentrations in the homogenates were measured with a Coomassie Brilliant Blue reagent kit (Bio-Rad Laboratories). Samples were analysed spectrometrically for absorbance in ELISA plates with a microplate reader (wavelengths: Sod, 450 nm; GPX, 340 nm; Cat, 531 nm; GSH/GSSG, 405 nm; protein, 531 nm; iEMS Reader MS; Labsystems). All reagents used were from Sigma-Aldrich, unless otherwise stated.
TBARS levels were determined as described by Hamre et al. ( Reference Hamre, Næss and Espe 33 ) using a method modified from Schmedes & Hølmer( Reference Schmedes and Hølmer 34 ).
RNA extraction and real-time quantitative RT-PCR
RNA was extracted and isolated with an EZ1 robot and RNA Tissue Mini Kit (Qiagen), and assessed for quality and integrity with the NanoDrop ND-1000 UV–Vis Spectrophotometer (NanoDrop Technologies) and the Agilent 2100 Bioanalyzer using an RNA 6000 Nano LabChip® kit (Agilent Technologies), according to the manufacturer's instructions. The 260/280 and 260/230 nm ratios were 2·12 (sem 0·01) and 2·01 (sem 0·04) (n 21). The RNA integrity number of eight random samples taken from a pool of twenty-one samples was 8·8 (sem 0·2). PCR primer sequences used for quantifying the transcription levels of the target genes gpx1a/gpx1b and sepp1a/sepp1b as well as the reference genes ubiquitin a-52 (uba52), ribosomal protein l13a (rpl13a) and tubulin α1 (tuba1) are shown in Table 3.
Gene symbols, GenBank accession numbers, PCR primer sequences, primer amplicon sizes and RT-quantitative PCR efficiencies for target and analysed reference genes
gpx, Glutathione peroxidase; sepp1, selenoprotein P; uba52, ubiquitin A-52; rpl13a, ribosomal protein l13a; tuba1, tubulin α1.
A two-step real-time RT-PCR protocol was used to quantify the transcriptional levels of the target genes. RT-PCR were run in triplicate on ninety-six-well reaction plates with the GeneAmp PCR 9700 machine using TaqMan Reverse Transcription Reagent containing Multiscribe RT (50 U/μl) (Applied Biosystems). Serial dilutions (2-fold) of total RNA were made for calculation of efficiency. A total of six serial dilutions (1000–31 ng) in triplicate were analysed in separate sample wells. The total RNA input was 500 ng in each reaction for all the genes studied. No template control and RT control were run for quality control. Reverse transcription was performed at 48°C for 60 min using oligo(dT) primers (2·5 μm) for all the genes studied in a total volume of 30 μl. Other chemical concentrations used in the RT reaction were MgCl2 (5·5 mm), dNTP (500 mm each), 10 × TaqMan RT buffer (1 × ), RNase inhibitor (0·02 μl) and Multiscribe RT (0·03 μl).
Diluted complementary DNA (1·0 μl from each RT reaction) was transferred to a 384-well reaction plate, and quantitative PCR run in 10 μl reactions on the LightCycler 480 Real-Time PCR System (Roche Applied Sciences). The real-time PCR was performed by using the SYBR Green Master Mix containing FastStart DNA polymerase (LightCycler 480 SYBR Green Master Mix Kit; Roche Applied Sciences) and gene-specific primers (500 nm). The PCR was achieved with a 5 min activation and denaturation step at 95°C, followed by forty-five cycles of a denaturing step at 95°C, a 10 s annealing step at 60°C and a 10 s synthesis step at 72°C according to Olsvik et al. ( Reference Olsvik, Lie and Goksoyr 35 ). The mean normalised expression of the target genes was determined using a normalisation factor calculated in geNorm software (Ghent University) using the reference genes( Reference Vandesompele, De Preter and Pattyn 36 ).
PCR products for the four target genes were sequenced with Big-Dye version 3.1 (Applied Biosystems) to verify gene identity using a standard procedure, which was performed by the University of Bergen Sequencing Facility (https://www.uib.no/seqlab).
Histology and assessment of visual skeletal deformities
Euthanised male fish (254 dpf) from the deficient (0·09 mg Se/kg diet), replete (0·65 mg Se/kg diet) and excessive (30 mg Se/kg diet) groups (n 5 fish/treatment) had their tails removed and abdominal cavities opened before fixing in 4 % formaldehyde in PBS for 48 h. Male fish were used for histological assessment primarily due to the heavily skewed sex ratio (see the ‘Zebrafish’ section), resulting in a greater availability of males in the present study. Fish were then dehydrated with ethanol in PBS, organs removed and weighed (heart, spleen, liver, testis and head kidneys) and spleen was analysed for element concentrations (see the ‘Element concentration analysis’ section). Spleen element concentrations and organ weights (with the exception of testes) are presented in Supplementary Table S6 (available online) and are not discussed in the main text. Whole fish sampled for analysis of growth and molecular levels at 62 dpf were also visually assessed for skeletal deformities (scoliosis, lordosis, kyphosis, bent neck, jaw deformities and compressed spines).
Calculations
Specific growth rates (SGR) were calculated using the following formula:
 $$\begin{eqnarray} SGR = \left (exp^{((ln\, W _{1} - \,ln\, W _{0})/( t _{2} - t _{1})) - 1}\right )\times 100, \end{eqnarray}$$
where W 0 and W 1 are the initial and final dry weights, respectively, and t 2− t 1 is the time interval (d) between the age t 1 and t 2 ( Reference Ricker 37 ). The redox potential was calculated using the Nernst equation:
 $$\begin{eqnarray} Volts = E _{0}\times - RT / nF \times Ln(GSH^{2}/GSSG), \end{eqnarray}$$
where E 0 is the standard redox couple of GSH/GSSG at pH 7 and 25°C ( − 240 mV), − RT/nF ( = − 0·0299) is the correction factor for non-standard conditions (calculated based on the ZF-rearing temperature of 28·5°C), and both GSH and GSSG concentrations are expressed as mol/g WW (for further details, see Schafer & Buettner( Reference Schafer and Buettner 38 )).
Data analyses
GraphPad Prism (version 5; GraphPad software) and Statistica (version 10; StatSoft, Inc.) were used for statistical analyses. Models were fitted in GraphPad, and data were tested for the following factors: the null hypothesis; whether dietary Se had any effect on outcome; normality of residuals (D'Agostino and Pearson); curve deviation from data points (replicate test). Non-normal residual data were modelled with weighting (1/Y 2) to minimise the relative distance square of plot from data when required, and more complex models were chosen when the replicate test demonstrated that a simple model did not explain the data adequately (P< 0·05). Unless otherwise stated, models were fitted to data within the range of diets containing the known Se requirements of fish (treatments 1–6). A one-way ANOVA followed by Tukey's honestly significant difference post hoc test was used to compare the high-Se group (treatment 7) with the other groups, and to determine maximum GPX activity using Statistica. Locomotor activity data were normalised to remove plate variation. To confirm activity findings from normalised data, raw activity data from within the nutritionally relevant range (0·09–0·65 mg Se/kg DM) were analysed with a second method (logistic regression models, glmmPQL, library: Mass; R (http://www.R-project.org, version 2.11.1)). Correlations were performed using Spearman's rank order in Statistica. Data were checked for homogeneity of variances using Levene's test (P< 0·05). Heteroscedastic data were log or arctan transformed. Differences among means were considered significant at P< 0·05. Data are presented as means with their standard errors, while Se concentrations are given on a DM basis, unless otherwise stated.
Results
Dietary selenium affects the growth and survival of zebrafish
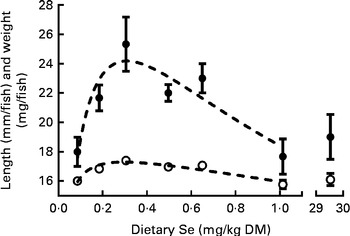
Growth, survival and skeletal deformity rates of ZF were measured at 62 dpf, by which stage they had received the treatment diets for 5 weeks. Each replicate is the average of fifteen to nineteen fish measured per tank. Significant differences in the growth of ZF were observed between the treatments. Modelling of the data predicted that maximum growth occurred at the dietary Se levels of 0·30 and 0·31 mg/kg for length and dry mass, respectively (Fig. 1). Treatment had no effect on DM percentage (23 (sem 1) %) or survival (96 (sem 2) % (n 21) (Supplementary Table S2, available online). Fish fed the highest rate of dietary Se (30 mg/kg diet) weighed less ( − 22 %, P= 0·02) and were shorter ( − 8 %, P= 0·04) than the 0·3 mg Se/kg diet-fed group (Fig. 1). The total rate of externally visible skeletal deformities was not different between the treatments (11 (sem 2) %, n 21). However, a specific skeletal deformity phenotype, with fish having a short body (compressed spine), was observed in the 30 mg Se/kg diet-fed group (5·6 (sem 3·1) %) but not in the other groups (0 %, P< 0·05; Supplementary Table S2, available online). Significant differences were observed in specific growth rates (WW percentage increase/d) between 27 and 62 dpf (curve fitting: second-order polynomial, R 2 0·60, maximum response at 0·46 mg Se/kg corresponding to 6·27 %/d; Supplementary Table S2, available online). The average specific growth rate (n 21) between 27 and 62 dpf was 5·9 (sem 0·1)%/d.
Length (○) and dry mass (●) of zebrafish at 62 d post-fertilisation (dpf) that were fed the graded levels of dietary selenium from 27 dpf. Values are means (n 3), with their standard errors represented by vertical bars. ![]() represent the best-fit models of the data (substrate inhibition: length, R
2 0·71; weight, R
2 0·62). The X-axis is segmented.
represent the best-fit models of the data (substrate inhibition: length, R
2 0·71; weight, R
2 0·62). The X-axis is segmented.
Selenium concentrations in the whole body of zebrafish increase linearly in dose response to dietary selenium
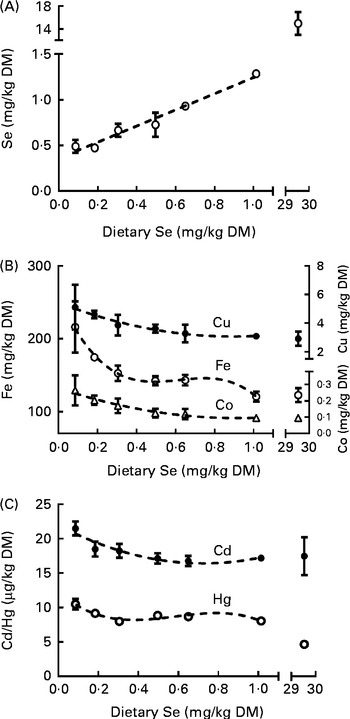
The concentration of Se in the whole body of ZF at 62 dpf increased linearly from 0·5> to 1·3 mg Se/kg DM as dietary Se levels increased from 0·09 to 1·0 mg Se/kg DM (Fig. 2(A)), while the 30 mg Se/kg diet-fed group (treatment 7) had whole body levels of 15·0 (sem 1·2) mg Se/kg. Furthermore, as dietary Se intake levels of ZF increased from 0·09 to 1 mg/kg diet, the whole-body concentrations of several elements decreased (Fe, − 44 %; Cu, − 40 %; Co, − 64 %; Cd, − 20 %; Hg, − 23 %; Fig. 2(B) and (C)). The level of Hg further decreased ( − 42 %) in fish fed the 30 v. 1 mg Se/kg diet, while no further decrease in the concentrations of the other elements was observed between the 1 and 30 mg Se/kg diet-fed groups (P> 0·05; Fig. 2(B) and (C)). Treatment had no effect on the levels of V, Zn, Mn, As, Sr, Ag, Sn, Ba or Pb in the whole body of ZF. The averages for analysed essential elements in the whole body of ZF are given in Table 4. Raw data for element concentrations of fish can be found in Supplementary Table S3 (available online).
(A) Selenium, (B) iron, copper and cobalt (essential elements) and (C) mercury and cadmium (non-essential elements) levels in whole zebrafish at 62 d post-fertilisation (dpf) that were fed the graded levels of dietary selenium from 27 dpf. Values are means (n 3), with their standard errors represented by vertical bars. ![]() represent the best-fit models of the data (first-order polynomial: selenium, R
2 0·93; second-order polynomial: cadmium, R
2 0·55, copper, R
2 0·65 and cobalt, R
2 0·75; third-order polynomial: iron, R
2 0·76 and mercury, R
2 0·64). The X-axes are segmented. The Y-axis is segmented in (A).
represent the best-fit models of the data (first-order polynomial: selenium, R
2 0·93; second-order polynomial: cadmium, R
2 0·55, copper, R
2 0·65 and cobalt, R
2 0·75; third-order polynomial: iron, R
2 0·76 and mercury, R
2 0·64). The X-axes are segmented. The Y-axis is segmented in (A).
Essential element concentrations in the whole body of zebrafish at 62 d post-fertilisation (dpf) (F0 generation) and 6 dpf (F1 generation) (Mean values with their standard errors; n 18–21)
< LOQ, below the limit of quantification; ND, not determined.
a,bMean values within a row with unlike superscript letters were significantly different (P< 0·05; one-way ANOVA).
Dietary selenium levels do not affect the general oxidative status of zebrafish
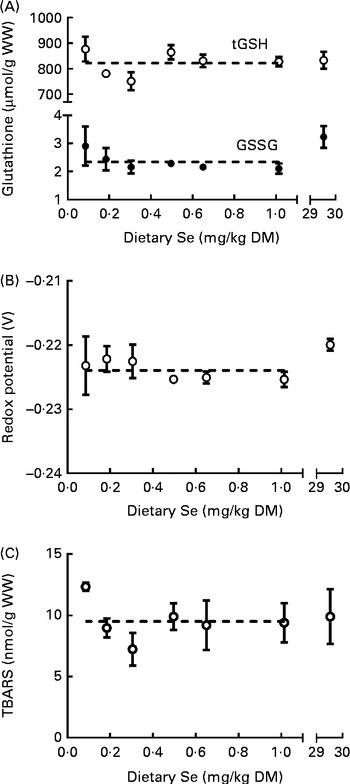
The levels of tGSH, GSSG and TBARS were measured, and the redox potential was calculated (see the ‘Calculations’ section) in the whole body of ZF at 62 dpf to assess the effect of dietary Se levels on oxidative status. Dietary Se levels had no effect (P>0·05) on the levels of tGSH (average 824 (sem 13) μmol/g WW), GSSG (average 2·5 (sem 0·1) μmol/g WW) or TBARS (average 9·6 (sem 0·6) nmol/g WW), or the redox potential (average − 0·223 (sem 0·001) V, n 21) in the whole body of ZF (Fig. 3(A)–(C)). As tGSH is composed of both GSSG and GSH, the low GSSG levels in ZF indicate that tGSH closely reflects the levels of reduced GSH (Fig. 3(A)). A weak positive correlation occurred between the TBARS (Fig. 3(C)) and tGSH (Fig. 3(A)) concentrations at 62 dpf (0·46, P= 0·04, Spearman's rank-order correlation). Raw data can be found in Supplementary Table S4 (available online).
(A) Total glutathione (tGSH, ○) and oxidised glutathione (GSSG, ●), (B) redox potential and (C) thiobarbituric acid-reactive substance (TBARS) levels in whole zebrafish at 62 d post-fertilisation (dpf) that were fed the graded levels of dietary selenium from 27 dpf. Values are means (n 3), with their standard errors represented by vertical bars. ![]() represent the best-fit models of the data (no effect of treatment, horizontal line). The X-axes are segmented. The Y-axis is segmented in (A). WW, wet weight.
represent the best-fit models of the data (no effect of treatment, horizontal line). The X-axes are segmented. The Y-axis is segmented in (A). WW, wet weight.
Dietary selenium levels affect the activity of both selenium-dependent and selenium-independent antioxidant enzymes
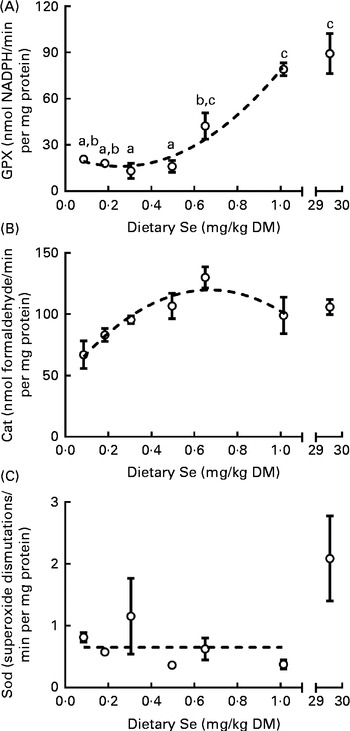
GPX activity was measured in the whole body of ZF at 62 dpf to assess the effect of dietary Se directly on a Se-dependent protein family. Sod and Cat activities were measured to assess the effect of dietary Se on non-Se dependent proteins within the same antioxidant system as GPX. Dietary Se levels had a non-linear affect on the GPX activity of ZF, with the minimum activity occurring at the 0·25 mg Se/kg diet and the maximum activity at or above the 1 mg Se/kg diet, as predicted from the fitted model (Fig. 4(A)). Commonly, studies exploring the Se requirements of fish use ANOVA to statistically evaluate the response of GPX activity to Se status( Reference Hilton, Hodson and Slinger 15 , Reference Gatlin and Wilson 39 ), but concerns have been raised that this may underestimate requirements compared with when data are evaluated with response curves( Reference Shearer 40 ). However, to provide a measure of comparison with ANOVA-based studies, GPX data were also analysed with ANOVA to determine dietary Se levels at which no further statistical increase in GPX activity occurred (0·65 mg Se/kg; Fig. 4(A)). Modelled data predicted Cat activity peaked at the 0·67 mg Se/kg diet (Fig. 4(B)). No differences were observed in total (CuZn+Mn) Sod activity in treatments 1 to 6 (Fig. 4(C)). However, total Sod activity was 3·2-fold higher in the 30 v. 0·09 to 1 mg Se/kg diet-fed groups (2·1 (sem 0·7) (n 3) v. 0·7 (sem 0·1) (n 18) units/min per mg protein; one-way ANOVA; P< 0·01; Fig. 4(C)). Raw data can be found in Supplementary Table S4 (available online).
(A) Glutathione peroxidase (GPX), (B) catalase (Cat) and (C) total superoxide dismutase (Sod) activity in whole zebrafish at 62 d post-fertilisation (dpf) that were fed the graded levels of dietary selenium from 27 dpf. ![]() represent the best-fit models of the data (second-order polynomial: GPX activity, R
2 0·89 and Cat activity, R
2 0·61; no effect, horizontal line, Sod activity). The X-axes are segmented. Values are means (n 3), with their standard errors represented by vertical bars. a,b,cMean values with unlike letters were significantly different between the treatments (P< 0·05; one-way ANOVA, Tukey's HSD post hoc).
represent the best-fit models of the data (second-order polynomial: GPX activity, R
2 0·89 and Cat activity, R
2 0·61; no effect, horizontal line, Sod activity). The X-axes are segmented. Values are means (n 3), with their standard errors represented by vertical bars. a,b,cMean values with unlike letters were significantly different between the treatments (P< 0·05; one-way ANOVA, Tukey's HSD post hoc).
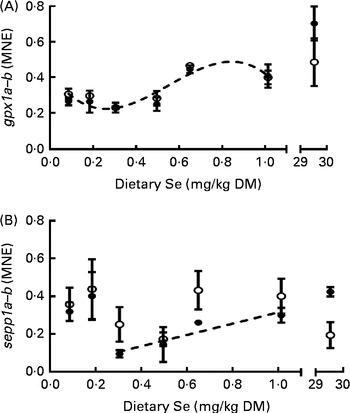
Dietary selenium levels affect the mRNA expression of gpx1a, gpx1b and sepp1a
The relative mRNA levels of genes coding for the Se-dependent proteins gpx1a, gpx1b, sepp1a and sepp1b were determined in the whole body of fish at 62 dpf. The mRNA levels of the gpx1 paralogues (Fig. 5(A)) decreased slightly as dietary Se level increased from 0·09 to 0·3 mg/kg diet (predicted fitted model: minimum 0·26 mg Se/kg diet), and then increased to a maximum after the 0·65 mg/kg diet (predicted fitted model: maximum 0·85 mg Se/kg diet), following a similar pattern to that of GPX activity (Fig. 4(A)). Meanwhile, sepp1b was not affected by changes in dietary Se levels, while sepp1a was only affected above the 0·3 mg Se/kg dietary level at which a positive linear response to dietary Se was observed (Fig. 5(B)). ZF fed the 30 mg Se/kg diet had higher mRNA levels of gpx1a (3-fold) and sepp1a (2-fold) than the groups fed diets ≤ 0·5 mg Se/kg and 0·3 mg Se/kg, respectively (P< 0·05; Fig. 5). As GPX activity (Fig. 4(A)) and selenoprotein gene expression (Fig. 5) had visually similar responses to dietary Se level, correlation analysis was performed for data over the entire dietary Se range. Moderate to strong correlations were found between GPX activity and the relative mRNA expression levels of gpx1a and gpx1b (Table 5), and also for the relative mRNA levels between these gpx1 paralogues (Table 5). Meanwhile, sepp1b did not correlate with other factors, and sepp1a correlated only with GPX activity (Table 5). Correlation analyses were then performed separately on data subsets from either below ( ≤ 0·3 mg Se/kg) or above (1 ≥ 0·3 mg Se/kg) the dietary Se level that resulted in the maximum growth of ZF (0·3 mg Se/kg; Fig. 1). No correlations were observed between the factors in the data subset below 0·3 mg Se/kg diet. However, in the data subset between the 0·3 and 1 mg Se/kg diets, the number and strength of correlations generally increased compared with when the whole dataset was analysed. The mRNA levels of sepp1a correlated strongly to moderately with all parameters except sepp1b, while the correlation levels between the gpx1 paralogues increased (Table 5).
Mean normalised mRNA expressions (MNE) of (A) glutathione peroxidase 1a (gpx1a) (●) and glutathione peroxidase 1b (gpx1b) (○) and (B) selenoprotein P 1a (sepp1a) (●) and selenoprotein P 1b (sepp1b) (○) in whole zebrafish at 62 d post-fertilisation (dpf) that were fed the graded levels of dietary selenium from 27 dpf. Values are means (n 3), with their standard errors represented by vertical bars. The biphasic data were tested for model fits as three datasets (dataset 1, ≤ 1 mg selenium/kg diet; dataset 2, ≤ 0·3 mg selenium/kg diet; dataset 2, 1 ≥ 0·3 mg selenium/kg diet). Curve-fitted models were not significantly different between the gpx1 paralogues (P= 0·89). ![]() represent the best-fit models of the data ((A) third-order polynomial R
2 0·58; (B) sepp1a: ≤ 0·3 mg selenium/kg, no effect; 0·3 ≤ 1 mg selenium/kg, first-order polynomial R
2 0·49; sepp1b: not affected by differences in dietary selenium levels). The X-axes are segmented.
represent the best-fit models of the data ((A) third-order polynomial R
2 0·58; (B) sepp1a: ≤ 0·3 mg selenium/kg, no effect; 0·3 ≤ 1 mg selenium/kg, first-order polynomial R
2 0·49; sepp1b: not affected by differences in dietary selenium levels). The X-axes are segmented.
Correlation matrix between dietary selenium level, glutathione peroxidase (GPX) activity and relative mRNA expressions of gpx1a, gpx1b, sepp1a and sepp1b in the whole body of zebrafish at 62 d post-fertilisation*
gpx, Glutathione peroxidase; sepp1, selenoprotein P.
* Correlation values ( ≥ 0·7 = strong correlation; 0·5–0·69 = moderate correlation) given on the bottom left of the table are for data from the entire dietary Se range (0·09–30 mg/kg DM), and those on the top right for the data subsets above dietary Se levels required for maximum growth and within a nutritionally relevant range (1 ≥ 0·3 mg/kg DM). No correlations were found for the data subset ≤ 0·3 mg Se/kg DM.
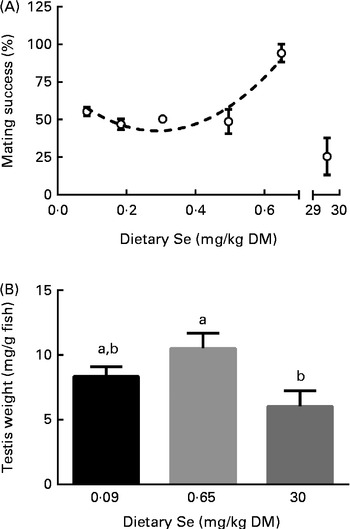
Dietary selemium levels determine male gonad size and reproductive performance
ZF were pairwise mated within the treatments (treatment female (TF) × TM) to determine the effect of dietary Se on reproductive success. In addition, TM were pairwise crossed with NTF to determine the effect of dietary Se specifically on male reproductive performance (see the ‘Mating and F1-generation locomotor activity’ section). In connection with the latter point, male testes were weighed from the groups representing deficient (0·09), replete (0·65) and excessive (30 mg Se/kg diet) dietary Se levels to determine whether these levels affected male testes weight and whether this had an impact on reproductive performance. The number of eggs spawned during each successful within-treatment mating was not statistically (P= 0·68) different between the treatments (average 231 (sem 29) eggs/mating, n 25). Embryo survival at 24 h post-fertilisation from TF × TM crosses (average 65 (sem 5) % survival, n 25) and NTF × TM crosses (average 59 (sem 2) % survival, n 16) was unaffected by dietary Se levels (P≥ 0·12). Mating success was defined as the percentage of pairwise crossings that resulted in twenty or more fertilised eggs (a total of 226 individual pairwise crosses were attempted in the present study). The curve fittings for relative mating success (normalised percentage of successful crossings) were not statistically different (P= 0·81) between the TF × TM and NTF × TM crosses, so data were combined (Fig. 6(A)). The maximum mating success within the range tested occurred at the 0·65 mg Se/kg diet (1·7-fold higher than the controls, the maximum level predicted by the model; Fig. 6(A)). Male gonad somatic index was affected by dietary Se levels (P< 0·05), being 1·8-fold higher in males fed the 0·65 v. 30 mg Se/kg diet (8·3 (sem 0·7), 10·5 (sem 1·2) and 6·0 (sem 1·2) mg testes/g fish, n 4–5, for the 0·3, 0·65 and 30 mg Se/kg diet-fed groups, respectively; Fig. 6(B)). Male gonad somatic index correlated strongly with mating success (Spearman's rank correlation 0·71, P< 0·01). Raw data can be found in Supplementary Table S7 (available online).
(A) Normalised mating success and (B) male gonad somatic index (mg/g fish) of zebrafish that were fed the graded levels of dietary selenium. (A) Values are means (n 2, where each n represents either the normalised mating success of treatment females crossed with treatment males (average of 11·3 (sem 1·4) mating attempts/treatment) or non-treatment females crossed with treatment males (average 26·3 (sem 1·7) mating attempts/treatment)), with their standard errors represented by vertical bars. Data were normalised against the 0·3 mg selenium/kg diet treatment and then to a maximum value of 100 %. Data were combined after curve fittings were found not to differ significantly between the datasets (P= 0·81). ![]() represents the best-fit model of the data (second-order polynomial R
2 0·83). The X-axis is segmented in (A). (B) Values are means (n 4–5 male fish at 254 d post-fertilisation), with their standard errors represented by vertical bars. a,bMean values with unlike letters were significantly different between the treatments (P< 0·05; one-way ANOVA, Tukey's HSD post hoc).
represents the best-fit model of the data (second-order polynomial R
2 0·83). The X-axis is segmented in (A). (B) Values are means (n 4–5 male fish at 254 d post-fertilisation), with their standard errors represented by vertical bars. a,bMean values with unlike letters were significantly different between the treatments (P< 0·05; one-way ANOVA, Tukey's HSD post hoc).
Increasing parental dietary selenium levels lead to larval (F1-generation) hypoactivity
After mating (see the ‘Dietary selenium levels determine male gonad size and reproductive performance’ section), the F1-generation embryos from pairwise within-treatment crosses were incubated, hatched and maintained as unfed yolk-sac larvae for quantification of locomotor activity at 5 dpf. The percentage of time at which locomotor activity occurred in larvae decreased ( − 40 %) as parental dietary Se levels increased from ≤ 0·3 to 0·65 mg Se/kg diet (2·4 (sem 0·1) to 1·4 (sem 0·1) %; Fig. 7). No statistical differences were found between the larvae from parents fed the 30 mg Se/kg diet and those from parents fed the other diets (P>0·05). A second statistical method confirmed the effect of parental dietary Se intake on larval locomotor activity (see the ‘Data analyses’ section).
Locomotor activity of larval zebrafish classified as the percentage of time 5 d post-fertilisation larvae spent moving over a 24 h period when the parental generation was fed the graded levels of dietary selenium. The 24 h period was light-controlled to simulate natural conditions with 7 h light–10 h dark–7 h light photoperiods. Values are means (n 2–4, where n represents the average of sixteen to thirty-two larvae from a single F0-generation pairwise mating), with their standard errors represented by vertical bars. Data were normalised, and the model fitted after outlier removal. ![]() represents the best-fit model of the data (second-order polynomial R
2 0·86). The X-axis is segmented.
represents the best-fit model of the data (second-order polynomial R
2 0·86). The X-axis is segmented.
Maternal transfer of dietary selenium level is dose-dependent
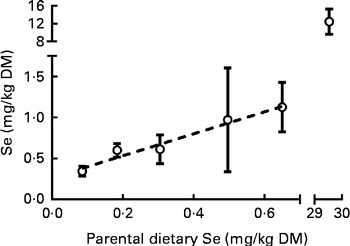
Concentrations of the microelements were analysed in the unfed yolk-sac stage of the F1 generation (see the ‘Increasing parental dietary selenium levels lead to larval (F1-generation) hypoactivity’ section) at 6 dpf, primarily to determine the effect of maternal dietary Se levels on maternal transfer of Se. Larval Se concentrations increased linearly in response to parental dietary Se levels (Fig. 8). The curve fitted (Fig. 8) was not statistically different from that fitted for Se concentrations in the F0 generation at 62 dpf (P= 0·31; Fig. 2(A)), demonstrating that larvae had similar Se concentrations as their parents. The Se level in larvae from parents fed the 30 mg Se/kg diet was 12·5 (sem 1·6) mg Se/kg (n 3), and was not statistically different from the Se content of the F0 generation at 62 dpf (P>0·05; one-way ANOVA). No differences were observed in the levels of the other essential elements analysed in larvae (Table 4). Raw data can be found in Supplementary Table S8 (available online).
Selenium in 6 d post-fertilisation zebrafish larvae (F1 generation) transferred from parents fed the graded levels of dietary selenium. Values are means (n 2–5, where n represents fifty to eighty individual larvae obtained from a single pairwise cross), with their standard errors represented by vertical bars. ![]() represents the best-fit model of the data (first-order polynomial R
2 0·48). The X- and Y-axes are segmented.
represents the best-fit model of the data (first-order polynomial R
2 0·48). The X- and Y-axes are segmented.
Discussion
Effect of selenium status on the relative mRNA levels of selenoproteins
In the present study, mRNA and protein levels of gpx1a and gpx1b appeared to be co-regulated in response to dietary Se status, in a similar manner to Gpx1 in mammals( Reference Sunde, Raines and Barnes 11 , Reference Chow and Tappel 41 ). For example, as in mammals, lower dietary levels of Se were required for maximum mRNA expression of gpx1a (and gpx1b) compared with GPX activity, but, overall, the mRNA expression of gpx1 was a reliable indicator of total GPX activity( Reference Weiss, Evenson and Thompson 16 , Reference Weiss, Evenson and Thompson 17 ). Thus, the present results suggest similarities in the functions and regulation of gpx1a and gpx1b in ZF to their mammalian orthologue. This is further supported by the similarities in the amino acid sequences of GPX1a and GPX1b proteins in ZF not only to each other (80 % homology( Reference Kryukov and Gladyshev 21 )), but also to the mammalian orthologue (approximately 70 % homology( Reference Mariotti, Ridge and Zhang 12 )). SEPP1 appeared to be a less reliable indicator of Se status than GPX1 in ZF, also in accordance with mammalian studies( Reference Sunde and Raines 10 , Reference Weiss, Evenson and Thompson 16 ). Furthermore, the present results are consistent with a recent study where Se supplementation increased the mRNA expression of sepp1a but not sepp1b in the brain of ZF( Reference Benner, Settles and Murdoch 42 ). The lack of correlation between the mRNA levels of sepp1a and sepp1b in ZF in response to Se status in the two studies suggests divergence in these genes in terms of regulation. Despite the current studies' similarities in the mRNA expression response of selenoprotein to Se status with the aforementioned mammal and ZF studies, the results differ from in vitro findings obtained in a rainbow trout (Oncorhynchus mykiss) liver cell line by Pacitti et al. ( Reference Pacitti, Wang and Page 43 ). In contrast to the present study, no correlations were found between the activity and mRNA expression of GPX, or between the mRNA expression of gpx1a and the two gpx1b isoforms in trout. All the gpx1 isoforms in the rainbow trout liver cell line appeared to be regulated by Se status, as in the present study( Reference Pacitti, Wang and Page 43 ), but in contrast to the present study, the gpx1b paralogues appeared to respond primarily to elevated Se levels. The study by Pacitti et al. ( Reference Pacitti, Wang and Page 43 ) and the present study had large differences in experimental designs, such as differences between the fish species, organ type, Se form and the nature of the biological material (in vitro v. in vivo) investigated; therefore it is difficult to conclude on possible reasons for the different responses of the GPX system between the two studies.
Toxicological responses to selenium status
The findings of the present study indicate that the 30 mg Se/kg diet induced chronic Se toxicity at the organismal level in ZF. For example, reduced growth is a primary symptom noted for Se toxicity in vertebrates also found in several other studies, fish included( Reference Hilton, Hodson and Slinger 15 , Reference Lin and Shiau 44 – Reference Jaramillo, Peng and Gatlin 46 ). Furthermore, several studies have identified negative effects of Se on the swimming performance and survival of ZF, at similar dietary Se levels (27–30 mg/kg) to those used in the present study( Reference Thomas and Janz 47 , Reference Thomas, Wiseman and Giesy 48 ). The short-body phenotype is a unique finding in the present study, and suggests a possible negative effect of elevated Se levels on skeletal development. Male ZF fed the 30 mg Se/kg diet had 1·6-fold lower gonad weights that correlated (71 %) with lower mating success, demonstrating that Se toxicity as well as deficiency( Reference Maiorino, Mauri and Roveri 49 – Reference Pfeifer, Conrad and Roethlein 51 ) may negatively affect male fertility. However, other reproductive-related outcomes, such as egg number, embryo survival at 24 h and larval activity, were unaffected by parental intake of the 30 mg Se/kg diet. The F1 generation Se concentration (12·5 mg Se/kg) from the 30 mg Se/kg group mirrored the Se content of their parents, but was below the general threshold level of 17–24 mg Se/kg DM for fish eggs that increases larval mortality and rates of deformities (for a review, see Janz( Reference Janz, Chris, Wood and Colin 52 )).
One possible mechanism of Se toxicity is the ability of some Se species to induce oxidative stress( Reference Spallholz 8 , Reference Spallholz, Palace and Reid 53 , Reference Misra and Niyogi 54 ). Oxidative stress is coupled to redox cycling of selenols with GSH and leads to the depletion of reduced GSH, the generation of superoxide anions and the oxidation of lipids( Reference Spallholz 8 , Reference Spallholz, Palace and Reid 53 – Reference Lavado, Shi and Schlenk 56 ). In the present study, glutathione concentrations, the redox potential and TBARS levels were unaffected by dietary Se levels up to 30 mg/kg, indications that oxidative stress did not occur( Reference Misra and Niyogi 54 , Reference Misra, Peak and Niyogi 55 , Reference Özkan-Yılmaz, Özlüer-Hunt and Gündüz 57 ). However, expression and activities of the antioxidant enzymes GPX, Sod and Cat did respond to Se supplementation. GPX increased over the whole range of Se supplementation from adequate (0·3 mg/kg) to toxic (30 mg/kg), Cat activity peaked at 0·65 mg/kg, while Sod was stable in the nutritional Se range (dietary Se levels that do not induce toxicity), but increased at toxic levels of Se. The reason for this variability may be because the fish responded to superoxide anions generated by Se by regulating the antioxidant response, while returning to homeostasis with regard to oxidative metabolites. Overall though, at the molecular level, a clearly defined oxidative stress response to the 30 mg Se/kg diet was not observed.
Selenium requirements of zebrafish
Growth data (Fig. 1) demonstrate that juvenile ZF (62 dpf) have a Se requirement of 0·3 mg/kg diet. However, mating success responded favourably to dietary Se levels as high as 0·65 mg/kg, although higher Se levels within the nutritionally relevant ranges were not tested. The Se requirement of 0·3 mg/kg for juvenile ZF is comparable to the requirements of 0·25– 0·7 mg/kg DM found for the juveniles of other fish species( 25 ), but is 2- to 8-fold lower than the dietary levels 0·9–2·4 mg/kg found in several commercial ZF diets in this study. The positive linear response of Se concentrations in ZF in relation to dietary Se is consistent with previous findings, as Se in the form of SeMet is substituted as methionine into proteins in a concentration-dependent manner( Reference Waschulewski and Sunde 58 ), resulting in higher body levels of Se than that of inorganic Se( Reference Wang and Lovell 59 , Reference Whanger and Butler 60 ).
The activity of GPX is higher in Se-replete v. Se-deficient animals, and consequently the minimum dietary Se level that results in maximum GPX activity is used to define the Se requirements of laboratory rodents( Reference Weiss, Evenson and Thompson 16 , Reference Weiss, Evenson and Thompson 17 , Reference Jensen and Pallauf 61 ). In the present study, the maximum GPX activity of ZF occurred at the 0·65 or ≥ 1 mg Se/kg diet, when data were analysed with ANOVA or with models, respectively. Interestingly, fish fed the diet with 1 mg Se/kg DM also had reduced growth compared with those from the other Se-replete groups, reflecting previous observations in fish. For example, the maximum growth of grouper (Epinephelus malabaricus) occurred at a dietary level < 0·8 mg Se/kg DM, while maximum hepatic GPX activity and reduced growth occurred concurrently at a level >1·2 mg Se/kg DM( Reference Lin and Shiau 44 ). When channel catfish (Ictalurus punctatus) were fed diets ranging from 0·06 to 15 mg Se/kg DM, maximum plasma GPX activity along with reduced growth occurred at the highest dietary Se level( Reference Gatlin and Wilson 39 ). Hepatic GPX activity in gibel carp (Carassius auratus gibelio), a closely related species of ZF, was the highest at a dietary Se level of 2·5 mg/kg DM, while maximum growth was observed at a dietary level of 0·7 mg/kg DM( Reference Han, Xie and Liu 62 ). Thus, while there is no doubt that GPX responds to changes in Se status in fish, the accumulating discrepancies between GPX activity and fish growth suggest that maximum GPX activity does not reliably predict Se requirements of fish.
In the present study, symptoms of severe Se deficiency such as increased mortality were absent, possibly because of the presence of water-borne Se (0·14 (sem 0·05) μg/l) that can be absorbed by fish gills and contributes to Se status when dietary Se is insufficient( Reference Hodson and Hilton 63 ). However, the growth of ZF was reduced in response to Se deficiency (Fig. 1), an effect also observed in other fish species( Reference Hilton, Hodson and Slinger 15 , Reference Gatlin and Wilson 39 , Reference Lin and Shiau 44 , Reference Han, Xie and Liu 62 , Reference Liu, Wang and Ai 64 ). With some exceptions( Reference Whanger and Butler 60 ), Se deficiency does not reduce growth in rodents( Reference Sunde, Raines and Barnes 11 , Reference Weiss, Evenson and Thompson 17 , Reference Jensen and Pallauf 61 , Reference Christensen and Burgener 65 , Reference Deagen, Butler and Beilstein 66 ). We speculate that the apparent increased susceptibility of fish to Se deficiency may be a function of larger selenoproteomes and hence greater utilisation of Se found in fish v. mammals( Reference Mariotti, Ridge and Zhang 12 , Reference Kryukov and Gladyshev 21 , Reference Lobanov, Fomenko and Zhang 67 , Reference Lobanov, Hatfield and Gladyshev 68 ). For example, fish have thirty-five to thirty-eight selenoprotein genes v. twenty-four to twenty-five in mammals( Reference Mariotti, Ridge and Zhang 12 ), and Se requirements range from 0·25–0·7 mg/kg DM in fish( 25 ) v. 0·08–0·21 mg/kg DM in mammals( Reference Weiss, Evenson and Thompson 16 , Reference Weiss, Evenson and Thompson 17 , Reference Jensen and Pallauf 61 , Reference Wedekind, Howard and Backus 69 – Reference Lei, Dann and Ross 71 ). The circulatory Se transport system also appears to have a higher capacity in fish than in mammals, as fish have a higher mRNA expression and number of Sec residues in SEPP1 (fifteen to seventeen) than mammals (seven to fifteen)( Reference Lobanov, Hatfield and Gladyshev 68 ). In line with this, Sec content in SEPP1 correlates strongly (R 2 0·81) with the known Se requirements of vertebrates (S Penglase, K Hamre and S Ellingsen, unpublished results).
Elevated Se status in adult ZF has also been shown to affect ZF behaviour( Reference Thomas and Janz 47 , Reference Benner, Drew and Hardy 72 ). However, the effects of parental nutrition on offspring behaviour in fish are largely unexplored. In the present study, larval activity levels of ZF were decreased by about 40 % when parents were fed dietary levels of 0·65 v. 0·09–0·3 mg Se/kg. The reason for this observation is open to speculation, but the effect of brain Se status on neurological function has been a suggested reason for behavioural differences observed in both adult ZF( Reference Benner, Drew and Hardy 72 ) and the offspring of Se-deficient mice( Reference Watanabe and Satoh 73 , Reference Watanabe and Satoh 74 ). In connection with this, it may be possible that the differences observed in male mating success in the present study, where the 0·65 mg Se/kg dietary level resulted in maximum mating success, are also a function of the effect of Se status on neurological function and subsequent behaviour.
Selenium status for growth v. health
In the present study, there was an apparent anomaly in that relatively low levels of GPX activity, gpx1a, gpx1b and sepp1a mRNA expression, TBARS and GSH coincided with maximum growth (0·3 mg Se/kg diet) in ZF at 62 dpf (Figs. 1–5). Furthermore, at dietary Se levels ≤ 0·3 mg/kg, there were no correlations between dietary Se level and GPX activity, or selenoprotein mRNA levels, while the opposite was true above this dietary Se level (Table 5). The reason for this occurrence remains unclear; however, the data imply two mechanisms, (1) a result of Se deficiency (>0·3 mg/kg) and (2) excessive Se level (>0·3 mg/kg) with regard to growth, and suggest that even small changes in Se status may influence redox status and, in turn, cellular growth rates. Nutritionally, the actions of Se are paradoxical, as it not only can be an antioxidant as selenoprotein-incorporated Sec, but also can cause oxidative stress when in excess( Reference Spallholz 8 , Reference Janz, Chris, Wood and Colin 52 , Reference Spallholz, Palace and Reid 53 , Reference Misra, Peak and Niyogi 55 , Reference Lavado, Shi and Schlenk 56 ). Convincing evidence now suggests that the toxicity and carcinostatic properties of Se both arise from oxidative stress( Reference Spallholz 8 , Reference Spallholz, Palace and Reid 53 ), and may be largely unrelated to selenoprotein-incorporated Se( Reference Sunde and Raines 10 ). We speculate that the 0·3 mg Se/kg dietary level represents the point where Se availability for selenoprotein production is optimal, while further increases may invoke a concentration-dependent increase in energy expenditure for excretion and the oxidative response required for metabolising excess Se. If true, then the supranutritional dietary Se levels that result in the proposed anticarcinogenic properties of Se could at the same time have the ability to decrease growth. While the proposed anticarcinogenicproperties of Se are desirable in the adult human population and other non-production animals, they may be undesirable for production animals. Production animals typically have short lifespans with subsequent low cancer risk, and in this case, dietary Se at requirement levels where selenoprotein synthesis is adequate for good health is probably more appropriate.
Conclusion
Increasing dietary Se concentration from Se-yeast produced a linear increase in Se concentration in ZF and their offspring. GPX activity correlated with mRNA levels of gpx1a and gpx1b, but, overall, neither maximum GPX activity nor mRNA expression of gpx1a or gpx1b appears to accurately predict the Se requirements of ZF. Co-regulation appears to occur between the gene paralogues of gpx1, but not sepp1. The 30 mg Se/kg diet induced chronic toxicity in ZF, with the most significant effect measured on the life cycle of ZF being the reduction in male gonad somatic index that was linked to reduced mating success. In general, the locomotor activity of the F1-generation larvae decreased as maternal Se intake increased within nutritional Se ranges. Juvenile ZF have a dietary Se requirement of 0·3 mg/kg DM based on growth; however, the optimal dietary Se concentration may be higher for reproducing fish. As Se status affected numerous outcomes in ZF, a consistent level of Se in commercially available ZF diets will aid future comparisons between experiments where dietary Se level is not a considered variable.
Supplementary material
To view supplementary material for this article, please visit http://dx.doi.org/10.1017/S000711451300439X
Acknowledgements
The authors thank the following NIFES technical staff: Øyvind Reinshol, Berit Solli, Hui-Shan Tung and Eva Mykkeltvedt for ZF husbandry and analytical assistance. They also thank Pål Olsvik for providing ZF housekeeping gene primers, Kai Lie for advice with regard to mRNA analysis and Kaja Skjaerven for proofreading.
The present study was financially supported by the Norwegian Research Council (project no. 185006/S40), and a PhD sponsorship was provided by the University of Bergen, Norway to S. P.
The authors' contributions are as follows: S. P., K. H. and S. E. were responsible for the research question, project design and interpretation of the results; S. P. conducted the animal trials and sampling; S. P. and J. D. R. conducted the laboratory/statistical analysis. All authors contributed to the writing of the final manuscript.
None of the authors has any conflict of interest to declare.


