

The focus on bioactive food ingredients and their potential role in preventing weight gain has increased along with the worldwide increasing obesity epidemic. Obesity develops due to a daily positive energy balance, which in itself may be very small (for example, up to about 200 kJ/d), but over the course of months or years can amount to several kilograms of fat(Reference Hill, Wyatt and Reed1). One implication of this is that an increase in energy expenditure (EE) by similar amounts (200 kJ/d) could help to prevent such a weight gain, provided that these small effects can be sustained. Several bioactive food ingredients, such as capsaicin (hot peppers), caffeine (coffee, tea, etc) and catechins (green tea) have been suggested to be capable of eliciting an increase in diet-induced thermogenesis, and thereby daily EE; however, the size and consistency of the effects observed with these different ingredients vary(Reference Kovacs and Mela2, Reference Westerterp-Plantenga, Diepvens and Joosen3).
Green tea is made from leaves from the Camellia sinensis L. species of the Theaceae family. Green tea is the non-oxidised product, as opposed to oolong and black tea, which are partially and fully oxidised, respectively(Reference Kovacs and Mela2). Therefore, green tea contains larger amounts of catechin polyphenols (catechins) than either oolong or black tea(Reference Kovacs and Mela2, Reference Westerterp-Plantenga, Diepvens and Joosen3). Nevertheless, the levels of individual catechins plus the total amount of catechins and caffeine varies considerably between different green tea samples(Reference Reto, Figuera and Filipe4, Reference Jin, Jin and Row5). However, the most abundant of the catechins in green tea are epicatechin, epigallocatechin (EGC), epicatechin-3-gallate and epigallocatechin-3-gallate (EGCG), the latter being most abundant(Reference Kovacs and Mela2). These catechins are known to differ in bioavailability and pharmacokinetics, with particularly striking differences between EGCG and the de-gallated EGC(Reference Van Amelsvoort, van Het Hof and Mathot6–Reference Warden, Smith and Beecher8). Furthermore, the bioavailability depends on the form of administration, with greater bioavailability when administered as a supplement in capsules as compared with tea(Reference Van Amelsvoort, van Het Hof and Mathot6).
Both catechins and caffeine are believed to be responsible for the acute effects of green tea on EE/thermogenesis and fat oxidation observed in previous studies(Reference Dulloo, Duret and Rohrer9, Reference Rudelle, Ferruzzi and Cristiani10). The mechanisms behind the effect of green tea components on thermogenesis and EE are not clearly established, but it is believed that sympathetic nervous system stimulation plays a central role(Reference Dulloo, Duret and Rohrer9, Reference Dulloo, Seydoux and Girardier11).
Caffeine has been suggested to elicit its effects by inhibiting the enzyme phosphodiesterase, which degrades intracellular cyclic AMP and further by antagonising adenosine receptors(Reference Dulloo, Seydoux and Girardier12). However, the effect of green tea extracts on acute energy metabolism is probably not solely attributable to caffeine(Reference Dulloo, Duret and Rohrer9). The catechins are also believed to be capable of increasing thermogenesis through inhibition of the enzyme catechol-o-methyltransferase that degrades noradrenaline(Reference Borchardt and Huber13). Thus, the effects of caffeine and catechins may synergistically increase and prolong the effects of noradrenaline on adrenoreceptors and thereby increase thermogenesis(Reference Westerterp-Plantenga, Diepvens and Joosen3, Reference Dulloo, Duret and Rohrer9, Reference Belza, Frandsen and Kondrup14). More recently, Venables et al. (Reference Venables, Hulston and Cox15) have reported that a catechin-rich green tea extract markedly increased fat oxidation during moderate-intensity activity, a situation of elevated adrenergic stimulation. However, not all catechins may be equally effective in affecting energy metabolism. EGCG in particular has been suggested to have beneficial effects on energy balance and substrate oxidation(Reference Kao, Hiipakka and Liao16). Furthermore, apart from the potential effects on thermogenesis/EE, catechins and caffeine may decrease appetite and ad libitum energy intake although the current evidence is sparse(Reference Belza, Toubro and Astrup17).
In summary, although there seems to be an acute effect of green tea on energy metabolism, the actual size of the effect beyond that of caffeine alone, and which of the catechins generate the greatest effects still need to be clarified. Thus, the primary aim of the present study was to examine the separate and combined effects of green tea extracts enriched in specific catechins v. caffeine alone on energy metabolism and fat oxidation over a single day. A secondary objective was to assess the effects of these extracts on subjective appetite sensations.
Methods
Subjects
Based on previous results(Reference Toubro, Christensen and Astrup18) and a power of 0·8, we calculated that fifteen subjects were sufficient to detect a 250 kJ/d (2 %) increase in daytime EE. Therefore, sixteen healthy normal-weight male subjects recruited from universities in Copenhagen and Internet advertisements were included in the study. Smokers and elite athletes were excluded from participation, as were individuals with habitual caffeine and catechins intakes above 250 or 200 mg/d, respectively, as well as users of any dietary supplements including vitamins during and from 3 months before the study. Before entering the study, the subjects were screened for blood pressure, body weight and height. All the subjects signed a written informed consent before participating in the study, which was in accordance with the Helsinki Declaration and approved by The Municipal Ethical Committee of Copenhagen and Frederiksberg (KF 01279421). The study was registered at ClinicalTrials.gov (ClinicalTrials.gov no. NCT00611416).
One subject dropped out of the study, because he was unable to take part in the remaining test days for unknown reasons. Thus, fifteen subjects completed the study, with a mean age of 23·6 (sd 2·7) years and mean BMI of 22·4 (sd 1·6) kg/m2 at the first visit.
Experimental design
The study was a five-way cross-over double-blinded placebo-controlled design. At each test day, EE, respiratory quotient (RQ) and substrate oxidations were measured via indirect calorimetry for 13·5 h in one of two whole-body respiratory chambers, and calculated using the formulas of Elia & Livesey(Reference Elia and Livesey19). Before the chamber stays, body composition was determined by dual-energy X-ray absorptiometry (DXA) scanning (GE Lunar Prodigy Advance; GE Medical Systems, Lunar, Madison, WI, USA). The measurements of fat-free mass and fat mass were used to adjust EE for body composition. The validity of the DXA scans has previously been described(Reference Haarbo, Godtfredsen and Hassager20, Reference Mazess, Barden and Bisek21).
RMR was measured before the test days using ventilated hoods. (The precision of the ventilated hood system was validated on a weekly basis by an alcohol-burning test; CV was 1·5 %.) The individually expected 24 h EE during the chamber stay was calculated by multiplying the measured RMR with a physical activity level factor of 1·4. The energy intake required to obtain energy balance during the chamber stay was predicted from the calculated 24 h EE value. However, since EE was only measured for 13·5 h, this was not a balance study. Therefore, we report treatment effects on EE, RQ and substrate oxidation, and not overall energy or macronutrient balances.
Treatments
The five different treatments in the present study were given as capsules, and the treatments and the content of these capsules are described in Table 1. The capsules were developed and standardised by Unilever Research & Development Colworth (Sharnbrook, Beds, UK). The daily levels of catechins in the active treatments (493·8–684·0 mg) correspond to approximately the catechin content of three cups of green tea(Reference Reto, Figuera and Filipe4). Likewise, the daily amount of caffeine in the active treatments (150 mg) is equivalent to the amounts of caffeine in either three cups of green tea or a cup of espresso(Reference Reto, Figuera and Filipe4, Reference Desbrow, Hughes and Leveritt22).
Content of the green tea capsules (mg)
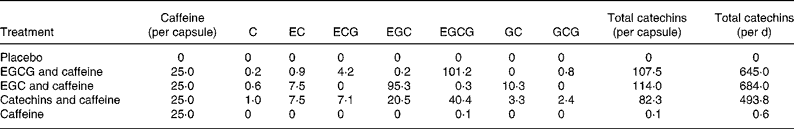
C, catechin; EC, epicatechin; ECG, epicatechin-3-gallate; EGC, epigallocatechin; EGCG, epigallocatechin-3-gallate; GC, gallocatechin; GCG, gallocatechin gallate.
Standardisation
Subjects were asked to refrain from exercise and eliminate consumption of foods or beverages containing caffeine (coffee, tea, cola, etc) and catechins (chocolate, red wine, apples and pears) for 24 h before each chamber stay. The subjects received meals (prepared at the research site) for the entire day before each test day, and during this day they were only allowed to drink water. The standardised dinner meal (50 % energy as carbohydrate, 37 % energy as fat and 13 % energy protein) was to be eaten before 20.00 hours of the evening before the test days. From 20.00 hours the evening before the test day until the beginning of the test day, the subjects were only allowed to drink 0·5 litres of tap water. Subjects were measured in the same respiratory chamber on each of the five visits in order to minimise the within-subject variation.
Protocol
The test day started at 07.30 hours with subjects arriving at the department. After voiding of the bladder and subsequent weighing, a mobile digital pulse oximetry device was attached to the subject (Nonin Avant 4000; Nonin Medical Inc., Plymouth, MN, USA) to allow for continuous heart rate (HR) measurements during the chamber stay. The subject then entered the respiratory chamber. At 08.00 hours, the chamber was sealed, and subjects then rested on the bed for 30 min. At 08.30 hours, measurements of EE and RQ were begun, and the first hour was dedicated to measuring RMR. Standardised meals were given at 09.45 hours (breakfast; 23 % daily energy intake), 13.45 hours (lunch; 33 % daily energy intake), 17.45 hours (dinner; 36 % daily energy intake) and 21.30 hours (snack; 8 % daily energy intake). All the meals were prepared by a specially educated kitchen staff using standardised recipes. The six capsules were given at 09.30 hours (two capsules), 11.45 hours (one capsule), 13.30 hours (one capsule), 15.45 hours (one capsule) and 17.30 hours (one capsule). At 22.00 hours the subjects were let out of the chamber and the test day was over; no further food intake was allowed until 08.00 hours next morning.
During the chamber stay (08.00–22.00 hours) and the following night (22.00–08.00 hours) the subjects collected all urine in plastic containers containing 25 ml of a 10 % HCl solution. The volume of the urine samples was measured, and small representative samples were then drawn from the larger samples and stored at − 80°C. The N content was measured using a nitrogen analyser (Carlo Erba Strumentazione NA 1500, 1986; Thermo Fisher Scientific, Slangerup, Denmark). Adrenaline and noradrenaline were measured by RIA using a commercial kit (2-Cat RIA; LDN, Nordhorn, Germany). Spontaneous physical activity (SPA) in the respiratory chamber was measured by IR detectors (Minilux Sensor PIR 41-162; Servodan A/S, Sønderborg, Denmark). SPA is expressed as the percentage of time in which the subject has a detectable level of physical activity.
Subjective appetite sensations
Visual analogue scales (VAS) were used to determine changes in subjective appetite sensations during the chamber stay. Ten different appetite sensations were examined. These were: satiety, hunger, fullness, prospective food consumption, thirst, wellbeing, and desire to eat something fatty, sweet, salty and savoury. The subjects filled out the VAS after 0 (08.00 hours), 90, 120, 180, 240, 300, 330, 360, 420, 480, 540, 570, 600, 660, 720 and 780 min. The use, reproducibility and validity of the VAS have been described in a previous report from this laboratory(Reference Flint, Raben and Blundell23). However, because the trial was powered for the energy metabolism measures, and appetite effects of green tea components are not well known, we analysed these as a secondary outcome.
Data
No measurements were made during the first 30 min of the chamber stay (from 08.00–08.30 hours). During the following 30 min period of the chamber measurements (08.30–09.00 hours), the O2 analyser did not reach equilibrium and thus produced invalid results. This 30 min period was therefore excluded and the measurements from the 30 min period between 09.00 and 09.30 hours were used for calculating RMR. Thus, the statistical analyses were based on data from the remaining 12·5 h period (9.30–22.00 hours), and therefore both RQ and EE measures refer to 12·5 h data unless otherwise stated.
Given the design of the study with dosing throughout the day, the acute effects of the green tea capsules were also examined by analyses of the data divided into specific time blocks. This was in order to examine whether there were any immediate or acute effects of the active treatments in the first few hours after each capsule that may not have been visible over the duration of an entire day. The time blocks were 09.30–11.45 hours (block 1), 11.45–15.45 hours (block 2) and 15.45–22.00 hours (block 3).
Incremental areas under the curve were calculated for the VAS scores for satiety and fullness, and incremental areas over the curve were calculated for the VAS scores for hunger and prospective food consumption.
Statistical analyses
Data were analysed by mixed-model analysis of covariance (ANCOVA). RQ, EE, HR, fat and carbohydrate oxidations were evaluated as independent variables. Treatment, chamber, period (visit number) and interaction between treatment and period were evaluated as independent fixed variables. Age, body weight, fat-free mass, fat mass, energy intake during chamber stay and SPA were evaluated as covariates and subjects as a dependent random variable. Where the main effect of treatment was significant, post hoc comparisons were made using t tests with Tukey–Kramer adjustment of significance levels for the pair-wise comparisons of treatments.
Furthermore, repeated-measures ANCOVA were performed in order to examine differences in time within periods. In these models, subjects were nested within periods.
In order to adjust for differences in SPA between the two respiratory chambers we conducted repeated-measures ANCOVA with EE, RQ and HR as independent variables, and treatment, period, time as well as two-factor interactions as dependent fixed variables. Subjects were included as a dependent random variable and SPA as a covariate.
The data on SPA were analysed by ANCOVA with SPA level as an independent variable, whereas treatment, period and interaction between treatment and period were evaluated as independent fixed variables. Age, body weight, fat-free mass and fat mass were evaluated as covariates and subjects as a dependent random variable.
The catecholamine data were analysed by ANCOVA with 24 h adrenaline and noradrenaline levels as independent variables, whereas treatment, period and interaction between treatment and period were evaluated as independent fixed variables. Age and body weight were evaluated as covariates and subjects as a dependent random variable.
VAS scores for satiety, hunger, fullness and prospective food consumption were analysed as both summary measures using incremental areas under the curve and incremental areas over the curve, and as repeated measures using a mixed-model ANCOVA. VAS scores for desire to eat something salty, fatty, savoury and sweet, and VAS scores for thirst and wellbeing were only analysed as repeated measures using a mixed-model ANCOVA. Where the main effect of treatment was significant, post hoc comparisons were made with Tukey–Kramer adjustment of significance levels for the pair-wise comparison of treatments. Treatment, period and interaction between treatment and period were evaluated as independent fixed variables. Age and body weight were evaluated as covariates and subjects as a dependent random variable.
In all statistical models, residuals were tested for normality by Shapiro–Wilk tests and variance homogeneity was investigated using residual plots. All results are given as means with their standard errors. The significance level was set at P < 0·05. Statistical analyses were performed using SAS (version 9.1; SAS Institute, Cary, NC, USA).
Results
Energy expenditure
The multivariate ANOVA showed no significant overall treatment effect on EE (P = 0·20) (Fig. 1). Body weight was a significant covariate (P = 0·0002), as would be expected since EE normally correlates with body weight as seen from formulas used to predict EE(Reference Elia and Livesey19). Likewise, the repeated-measures ANCOVA did not show any effect of treatment on EE (P = 0·84), but both time and body weight were significant covariates, which again could be expected due to the association between body weight and EE, and the fact that EE changes over time due to the intake of meals (P < 0·0001).
Energy expenditure (EE) during the 12·5 h chamber stay plotted against the five different treatments. Differences between single treatments and placebo are given as percentages above each bar. Data are means (n 15), with standard errors represented by vertical bars. EGCG, epigallocatechin-3-gallate; EGC, epigallocatechin.
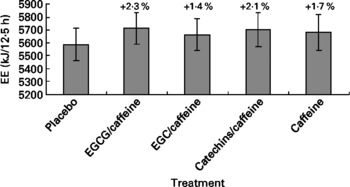
When analysing the data split into the previously mentioned time blocks, we observed no treatment effect on EE in time blocks 1 and 2, but in time block 3 there was a tendency towards a treatment effect on EE (P = 0·053) (Table 2). Post hoc comparison (Tukey–Kramer) of EE data from time block 3 indicated that the difference between EGCG/caffeine (0·46 MJ/h) and placebo (0·44 MJ/h) was borderline statistically significant (P = 0·05). There was also a trend in EE for time block 3 for caffeine only (0·46 MJ/h) v. placebo (0·44 MJ/h) (P = 0·08). However, there was no difference among any of the active treatments.
Results of statistical analyses on time block data
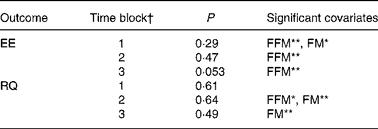
EE, energy expenditure; FFM, fat-free mass; FM, fat mass; RQ, respiratory quotient.
* P < 0·05, ** P < 0·01.
† Time block 1, 09.30–11.45 hours; time block 2, 11.45–15.45 hours; time block 3, 15.45–22.00 hours.
Respiratory quotient and substrate oxidations
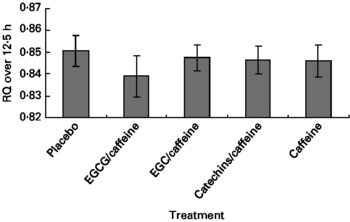
The multivariate ANOVA showed that there was no overall treatment effect on RQ (P = 0·68), but that fat mass was a significant covariate (P = 0·0023) (Fig. 2), which could be expected since fat mass has been shown to correlate with fat oxidation in both normal-weight and obese subjects(Reference Astrup, Buemann and Western24). Likewise, repeated-measures ANCOVA indicated no overall effect of treatment on RQ (P = 0·75), but again fat mass was a significant covariate (P = 0·0078). Furthermore, according to mixed-model ANCOVA with these same covariates, there were no overall treatment effects on RQ when analysed as time blocks (Table 2).
Respiratory quotient (RQ) during the 12·5 h chamber stay plotted against the five different treatments. Data are means (n 15), with standard errors represented by vertical bars. EGCG, epigallocatechin-3-gallate; EGC, epigallocatechin.
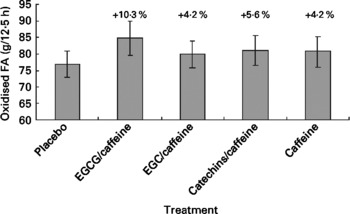
Fat oxidation for the five different treatments is shown in Fig. 3. From Fig. 3(Reference Kovacs and Mela2) it might appear that fat oxidation with EGCG/caffeine was greater than for the placebo in particular; however, there were no significant treatment effects (P = 0·55), and also no significant covariates.
Fat oxidation during the 12·5 h chamber stay plotted against the five different treatments. Differences between single treatments and placebo are given as percentages above each bar. Data are means (n 15), with standard errors represented by vertical bars. FA, fatty acids; EGCG, epigallocatechin-3-gallate; EGC, epigallocatechin.
Lastly, there were no treatment differences in carbohydrate oxidation during the 12·5 h period (P = 0·81).
Heart rate
Neither the multivariate ANOVA nor the repeated-measures ANCOVA showed any treatment effects on HR (P = 0·17 and P = 0·15, respectively). However, for the repeated-measures ANCOVA, SPA (P = 0·0024) and time (P < 0·0001) were significant covariates, which could be expected since it is well known that increased SPA increases HR and that HR can vary during the day due to meals and changes in physical activity. When divided into time blocks, we observed no treatment effects on HR for time blocks 1 and 3 (P = 0·07 and P = 0·57, respectively), although there was a trend toward an effect (lower HR in EGCG/caffeine v. placebo) in time block 1. However, for time block 2 we observed a significant treatment effect on HR (P = 0·037). Subsequent post hoc analyses (Tukey–Kramer) showed that EGCG/caffeine reduced HR compared with placebo (P = 0·032), whereas no other treatment differences were observed.
Spontaneous physical activity
There were small but statistically significant differences in SPA between treatments (P = 0·049). Post hoc (Tukey–Kramer) analyses showed that SPA was slightly higher during the catechins/caffeine (SPA 13·89 %) treatment compared with the caffeine-only (SPA 11·45 %) treatment (P = 0·0389). The SPA during the remaining three treatments (placebo, SPA 13·04 %; EGCG/caffeine, SPA 11·97 %; EGC/caffeine, SPA 12·54 %) were not significantly different from any of the other treatments.
Subjective appetite sensations
VAS ratings of hunger, prospective food consumption and fullness showed no significant differences between treatments (P>0·20). There was a tendency for all active treatments to result in larger levels of satiety (incremental areas under the curve) compared with placebo (P = 0·055).
Furthermore, there was a significant treatment effect on the desire to eat something salty (P < 0·01). Post hoc Tukey–Kramer adjusted analyses showed that the caffeine-only treatment resulted in decreased desire for something salty compared with placebo (P < 0·01) and similar trends for the EGC/caffeine and catechins/caffeine treatments compared with placebo (P = 0·079 and P = 0·054, respectively). Finally, there were no treatment effects on the desire to eat something fatty, savoury or sweet, and likewise no treatment effects on thirst sensations or wellbeing (P>0·13).
Catecholamines
The statistical analyses showed no effects of treatments on 24 h urine levels of adrenaline (P = 0·28) or noradrenaline (P = 0·17) (Table 3). However, body weight was a significant covariate in both analyses, meaning that the larger the body weight the larger the levels of the catecholamines (P < 0·001 and P < 0·01, respectively).
(Mean values with their standard errors for fifteen subjects)
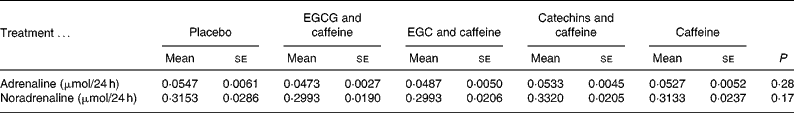
EGCG, epigallocatechin-3-gallate; EGC, epigallocatechin.
Discussion
In the present study we found no statistically significant evidence of an acute (within-day) effect of green tea extracts with varying levels of putative active ingredients on EE, RQ or substrate oxidation. There were some non-significant tendencies (Figs. 1–3) towards increased EE ( < 2 %) and fat oxidation, and decreased RQ (about 10 %) on the active treatments (especially EGCG/caffeine) compared with placebo.
These results contrast with the much larger acute effects of green tea extracts reported in some other studies. In particular, Dulloo et al. reported increases in EE by 3·5 % and in fat oxidation (27 g/24 h increase) with green tea(Reference Dulloo, Duret and Rohrer9). Bérubé-Parent et al. reported an increase in 24 h EE by about 750 kJ on different combinations of catechins and caffeine (from green tea and guarana)(Reference Bérubé-Parent, Pelletier and Doré25). Rudelle et al. reported a 4·6 % increase in 24 h EE (though no significant changes in macronutrient oxidation) with a green tea extract and caffeine(Reference Rudelle, Ferruzzi and Cristiani10). Lastly, Venables et al. reported a 17 % increase in fat oxidation during moderate activity, following green tea extract(Reference Venables, Hulston and Cox15).
Based on previous research, the present study was powered to detect a difference of 250 kJ (about 2 %) in EE during the measuring period. Notably, however, effects on EE did not approach statistical significance (overall treatment P = 0·20), except in secondary analyses of a single time block (time block 3). The duration of the treatments does not seem to be responsible for the differences in results between studies, since two of the previous studies(Reference Dulloo, Duret and Rohrer9, Reference Bérubé-Parent, Pelletier and Doré25) had similar duration to the present study (1 d with three daily doses), whereas the study by Rudelle et al. (Reference Rudelle, Ferruzzi and Cristiani10) had a longer treatment period (3 d with three daily doses).
The amounts of catechins used here were also well within the range of other studies. Bérubé-Parent et al. reported no additional dose–response effect on EE with varying daily dosing size of EGCG from 270 to 1200 mg/d(Reference Bérubé-Parent, Pelletier and Doré25) in the presence of 600 mg caffeine. Furthermore, Dulloo et al. (Reference Dulloo, Duret and Rohrer9) saw significant effects on EE with an EGCG level lower than or equal (270 mg/d) to amounts used both by Bérubé-Parent et al. (Reference Bérubé-Parent, Pelletier and Doré25) and the present study. Most recently, Rudelle et al. reported significant effects on EE with a catechin level (540 mg/d; 50 % of which EGCG) similar to the present study, though with large quantities of added caffeine (300 mg/d)(Reference Rudelle, Ferruzzi and Cristiani10).
To our knowledge, the present study is the first in human subjects to specifically examine whether different catechins differ in their ability to affect EE and substrate oxidation. However, we observed no significant differences between the specific catechins tested with regard to these endpoints. Although the total daily amount of catechins varied between the catechin-containing treatments in the present study (range 493·8–684·0 mg/d) it seems unlikely that these differences influenced the present results, since the amounts used in the present study are all within the ranges for which effects have been reported in previous studies(Reference Dulloo, Duret and Rohrer9, Reference Rudelle, Ferruzzi and Cristiani10, Reference Bérubé-Parent, Pelletier and Doré25). Thus, neither the differences in dosing sizes between treatments in the present study nor the different types of catechins seem to explain the differences in short-term effects seen between the present and the other three studies.
A more likely potential reason for the differences between studies and treatments could be the content of (added) caffeine. In the present study the effect of caffeine per se was tested in addition to the effect of the catechins (and caffeine) from the capsules containing the green tea extracts. Even though the EGCG/caffeine treatment numerically seemed to be the most potent stimulator of EE and fat oxidation in the present study, the differences between the active treatments were rather small and non-significant, and thus there is a chance that the tendency towards an effect that we found is primarily due to caffeine and not catechins. This would be consistent with findings of Bérubé-Parent et al. where varying the catechin content from 270 to 1200 mg/d, plus 600 mg/d caffeine, did not influence the size of the effect on EE(Reference Bérubé-Parent, Pelletier and Doré25). Also, Rudelle et al. (Reference Rudelle, Ferruzzi and Cristiani10) reported significant effects on 24 h EE with a level of catechins similar to the present study, but using twice the level of caffeine (300 v. 150 mg/d). However, Dulloo et al. reported a larger 24 h EE and fat oxidation, and a lower RQ on the green tea treatment compared with caffeine alone (similar caffeine contents of 150 mg), and those authors suggested that the green tea extract resulted in effects beyond those that could be explained by the caffeine content(Reference Dulloo, Duret and Rohrer9). Thus, the study by Dulloo et al. is the only to report acute effects of green tea on EE and fat oxidation, without substantial amounts of added caffeine content(Reference Dulloo, Duret and Rohrer9). A potential explanation for this discrepancy between the present study and the study by Dulloo et al. (Reference Dulloo, Duret and Rohrer9) could be the different modes of dosage. In both studies the daily dose of caffeine was 150 mg, but in the present study the dosage was 1 × 50 mg +4 × 25 mg, whereas in the Dulloo et al. study it was 3 × 50 mg. Thus, a dosage below 50 mg per administration could be beneath the threshold for a synergistic effect between catechins and caffeine and thereby explain the difference in results. Therefore, there are still some doubts about the actual magnitude of acute effects of catechins per se on energy and lipid metabolism, and the present study seems to suggest that the larger effect sizes reported elsewhere may often be due to or potentiated by higher levels of caffeine or perhaps synergy with physical activity(Reference Venables, Hulston and Cox15, Reference Maki, Reeves and Farmer26).
Even though the acute effect (24 h) of the green tea combinations we examined was smaller than expected (and non-significant) relative to previous research, this does not rule out the possibility that green tea can have beneficial effects on energy balance and body fat stores over longer time periods(Reference Maki, Reeves and Farmer26). A number of studies have shown that longer-term consumption of green tea extracts can decrease body weight, waist circumference, total body fat and visceral fat(Reference Kajimoto, Kajimoto and Yabune27–Reference Tsuchida, Hiroshige and Haruo32), the latter being viewed as a particular health risk(Reference Després and Lemieux33). However, other studies have failed to find such long-term effects on body weight and composition during(Reference Diepvens, Kovacs and Nijs34) or following(Reference Kovacs, Lejeune and Nijs35) a low-energy weight-loss diet. It is possible that small effects of green tea are less apparent against the background of a larger change in diet or energy balance. However, in support of the benefits of green tea for weight control, a recent study has observed that 10 d supplementation with polyphenol-enriched oolong tea can increase fat excretion(Reference Hsu, Kusumoto and Abe36). Thus, this effect may also be partly responsible for the long-term effects of green tea seen in some studies(Reference Kajimoto, Kajimoto and Yabune27–Reference Tsuchida, Hiroshige and Haruo32). Nevertheless, it is not known whether this effect is meaningful and persistent over longer time periods. Thus, further studies are needed to clarify the weight-loss/weight-maintenance potential of green tea, and particularly the mechanisms behind the effects observed in a number of trials(Reference Kajimoto, Kajimoto and Yabune27–Reference Tsuchida, Hiroshige and Haruo32). In addition, based on the observations that most studies showing effects of green tea catechins are conducted in Asian subjects it seems important to clarify whether the effects of green tea catechins differ between different population groups.
The fact that EGCG reduced HR compared with placebo in time block 2 (11.45–15.45 hours) was surprising since one could have expected an increase in HR following the thermogenic EGCG treatment, because of the likely activation of the sympathetic nervous system. However, Hill et al. have previously shown that 12-week EGCG supplementation reduced HR compared with placebo(Reference Hill, Coates and Buckley37). Nevertheless, another study failed to find any effects of EGCG on HR(Reference Diepvens, Kovacs and Nijs34). Furthermore, none of the other statistical analyses showed any treatment effects on HR and, thus, this effect does not seem to be strong and consistent over time.
The level of SPA was slightly larger during the catechins/caffeine treatment compared with the caffeine-only treatment. This was unexpected and probably incidental, as there is no apparent causal basis for such a result from the present or previous studies. Because SPA was a covariate in analyses of EE and RQ, differences in SPA levels should not have influenced the interpretation of results for these endpoints.
We observed no effect of treatments on urinary catecholamine excretion. This finding was in agreement with the findings of two other studies(Reference Rudelle, Ferruzzi and Cristiani10, Reference Bérubé-Parent, Pelletier and Doré25), but contradicts the findings in a third study(Reference Dulloo, Duret and Rohrer9). However, it is consistent with the fact that there were also no effects on EE and fat oxidation. This suggests that the treatments did not affect the sympathetic nervous system sufficiently to elicit significant effects on the above-mentioned endpoints. However, urinary catecholamine excretion is a crude proxy for sympathetic activity as it reflects the outcome of spillover from the sympathetic nerve endings, degradation and renal excretion.
Lastly, we found no significant effect of the treatments on subjective appetite sensations, and only a weak tendency for an effect on satiety.
Conclusions
The present results suggest that the tested catechins/caffeine combinations in sedentary conditions at these dosages and with this mode of application exert only small acute effects on EE and fat oxidation, which were not statistically significant. Positive trends observed indicate that the effect size of catechins/caffeine combinations on EE under these conditions would at most be in the order of about 2 %. Such a small level of effect could still contribute toward the longer-term cumulative effects on energy balance observed in many long-term studies; however, the higher acute effects reported in the literature may reflect variations in green tea extracts, or enhancement of responses when combined with added caffeine or physical activity. Furthermore, there does not seem to be an effect of the tested catechins/caffeine combinations on subjective appetite measures. There remains a need to identify the specific mechanisms or their combination, perhaps individually of small magnitude, that might underpin observations of longer-term effects of green tea catechins on energy balance.
Acknowledgements
The authors gratefully thank Yvonne Rasmussen, Berit Hoielt, Karina Graff Rossen, Kira Holst Bjerre Larsen, Charlotte Kostecki, Martin Kreutzer, John Lind and Søren Andresen for expert technical assistance, and the subjects for their willing participation. In addition, the authors thank Anita Belza for assistance in designing the study, and Christian Ritz for expert statistical assistance.
C. B, E. M. R. K., J. A. R., D. J. M. and A. A. planned the present study, and C. B. wrote the protocol. C. B. and I. K.-M. conducted the study. N. T. G. analysed the data with O. H., E. M. R. K., J. A. R., D. J. M. and A. A. all providing help. N. T. G. wrote the manuscript, and the remaining authors all reviewed the manuscript.
The present study was supported by the Unilever R&D Vlaardingen, The Netherlands.
E. M. R. K., J. A. R. and D. J. M. are employees of a company that manufactures tea products.


