


Introduction
Urban politics and policy making in Canada are shaped in important ways by the structure of local government institutions. The Canadian urban politics literature has long identified some dominant institutional tendencies, such as the prevalence of “weak” mayors without executive authority and of nonpartisan local politics (Sancton, Reference Sancton2015; Lucas, Reference Lucas2020). But these tendencies are by no means universal. Electoral systems, legislative processes, the structure of the executive, accountability offices, the governance of service delivery—all of these elements, and many others, take a multiplicity of forms in Canadian cities. They are also subject to relatively frequent, and sometimes dramatic, changes, such as Ontario's move in 2022 and 2023 to grant strong executive powers to many urban mayors (Taylor and Horak, Reference Taylor and Horak2022; Taylor, Reference Taylor2023). If we want to better understand how local institutions shape urban politics and policy, we need to know how these institutions actually vary across the country. Just how common are at-large elections, or mayoral veto powers, or accountability officers such as integrity commissioners? Which services are most commonly governed by special-purpose authorities? How do local institutions vary by province, or by municipal population? To date, we have not developed good answers to such basic questions. Canada has no equivalent of the United States’ Census of Governments, so our knowledge of the varied institutional landscape of Canadian cities is surprisingly impressionistic and fragmentary.
In this article, we address this gap in knowledge in two ways. First, we introduce readers to the Canadian Municipal Attributes Portal (CMAP). CMAP is an open-access database developed at the University of Western Ontario over the past four years that contains information on over 50 institutional features of local government for nearly 100 of the most populous municipalities in Canada. It represents the first-ever initiative aimed at systematically gathering such data. We briefly discuss how the database was developed and how it can be used by researchers. Second, we develop and deploy a new, multidimensional index of authority concentration. The index is designed to capture variation in the local structure of decision-making authority in a systematic and nuanced manner. Building on existing scholarly work, we identify four dimensions on which the concentration of decision-making authority varies: geographical, executive, legislative, and service delivery. We identify indicators and scoring for each dimension and apply these to a subsample of 65 municipalities constituting the largest municipalities in each province.
The result is a rich portrait that both corroborates and extends our existing understanding of local institutions in Canadian cities. Overall, municipal political authority is significantly more concentrated in Quebec and British Columbia than in other provinces, but the structure of authority is quite different across those two provinces. Corroborating findings in historical work by Lucas (Reference Lucas2017), we find that the institutional structure of service delivery arrangements varies more clearly by service field than by province. We further find that certain institutional arrangements are associated with distinct contexts—for example, community councils exist almost exclusively in municipalities that were established through imposed amalgamations, and, outside Quebec, executive committees currently only exist in very large cities. These and other findings presented here show how a multidimensional and comparative approach, grounded in systematic cross-sectional institutional data, can advance our understanding of local government institutions in Canada's cities.
Why Collect Institutional Data on Local Governments?
The study of local politics in Canada has a long tradition of focusing on institutions (see Eidelman and Taylor, Reference Eidelman and Taylor2010). The merits of institutional features such as official nonpartisanship and weak political executives have been the subject of extensive inquiry and debate (Moore, Reference Moore2017; Urbaniak, Reference Urbaniak2014). The relatively frequent restructuring of local institutions in some, but not all, provinces has also sparked scholarly interest (Cashaback, Reference Cashaback2001; Sancton, Reference Sancton, Young and Leuprecht2006). At the same time, the fact that local institutions are unstable and functionally limited has led many scholars of urban politics in Canada to see them as just one piece of a bigger governance puzzle (Sancton, Reference Sancton2008; Horak and Young, Reference Horak and Young2012; Taylor and Bradford, Reference Taylor, Bradford, Moos, Vinodrai and Walker2020). In the early 2000s, many urban politics researchers adopted a governance approach in their work, focusing on how state-society interaction, as well as interaction across levels of government, shaped urban policy processes and outputs. Studies of individual policy fields, such as immigrant settlement (Good, Reference Good2009) and homelessness (Doberstein, Reference Doberstein2016), as well as work on multilevel governance (Horak, Reference Horak2013), all moved away from a focus on local institutions as objects of analysis.
Recently, though, the interest in local institutions has re-emerged. There is a boom in local election studies, which explore issues such as the dynamics of nonpartisan elections (McGregor et al., Reference McGregor, Moore, Jackson, Bird and Stephenson2017; Breux and Couture, Reference Breux and Couture2018; Lucas, Reference Lucas2020) and the structure of electoral finance regimes (Taylor and McEleney, Reference Taylor and McEleney2019). The historical development and policy effects of special-purpose governments have also received attention (Lucas, Reference Lucas2017; Lyons, Reference Lyons, Anderson and Stephenson2021), as have municipal accountability offices (Sancton, Reference Sancton, Breux and Couture2018). There is a re-emergence of interest in questions of local autonomy (Good, Reference Good2019; Alpert et al., Reference Alpert, Rosiers and Flynnforthcoming), and there is new historical scholarship that focuses on longer-term patterns of institutional development in Canadian cities (Lucas, Reference Lucas2017; Taylor, Reference Taylor2019).
Despite this institutional turn, we have a limited empirical base of comparative information on local institutions. In many other countries, national and/or subnational governments collect systematic data on local institutions (see, for instance, United States Census Bureau, 2023), but this is not the case in Canada. As a result, for example, we do not know, even approximately, how many urban municipalities in Canada conduct their elections by ward, as opposed to at-large. While Lucas (Reference Lucas2017) has compiled a historical dataset of governing structures across five policy fields, it is limited to six Canadian cities. In a recent overview, Taylor and Dobson (Reference Taylor and Dobson2020) map variation in municipal legislation across Canadian provinces, which sets out parameters for some local institutional arrangements but by no means determines them completely.
In this context, a database of local institutions in urban municipalities in Canada can help us advance our understanding of urban politics and local governance in several ways. First, it can give us a basic descriptive portrait of formal institutions in Canadian cities, so that we know the extent to which institutions that we take as characteristically Canadian actually are characteristic, and so that we can map the variation that exists. Second, it can allow us to explore the correlates of institutional variation—for example, the extent to which the powers of mayors differ by province, as opposed to by municipal population size. Third, it can allow us to examine how different aspects or dimensions of local institutions vary (or do not vary) together—for example, whether there is any correlation between a concentration of executive authority on council and the way in which service delivery is governed in a municipality. Finally, it can identify interesting cases for detailed work—be it unusual institutional arrangements in one municipality or similar or contrasting cases that researchers may not have been aware of before.
The Canadian Municipal Attributes Portal (CMAP)
CMAP is a database that contains information on over 50 institutional features of Canadian municipal governments. It has been built since 2019 by a research team based at the University of Western Ontario. Information is gathered from local government websites and other online sources using a standardized question template, which produces an institutional profile document for each municipality. Each profile is then verified either by a local expert on that municipality (if possible) or by a second researcher. Key datapoints from all profiles are then inputted into an Excel datasheet. As of September 2023, all of these elements are publicly available through an open-access web app: https://westernurban.shinyapps.io/CMAP/. In addition to viewing and downloading the template, profiles and datasheet, users can employ the app's interactive features to directly compare the institutional characteristics of selected municipalities and to produce charts that visualize the distribution of institutional arrangements across municipalities. This makes the app useful for both research and teaching applications.
CMAP currently contains information on 91 municipalities. At its heart is a “core” national sample of 65 municipalities. To identify this core sample, we balanced two distinct criteria—municipal population size and representation from all provinces. Selecting only the most populous municipalities would produce a sample largely composed of Ontario and Quebec municipalities, whereas selecting an equal number of municipalities from each province would produce a sample heavy on small municipalities. Instead, we selected the 10 largest single-tier or lower-tier municipalities in each province with a population of 25,000 or more, plus every provincial capital (if not already one of the 10 largest municipalities).Footnote 1 If there were fewer than four municipalities with over 25,000 people in a province, the top four were included regardless of population. The municipalities in our resulting core sample include over half of the Canadian population and anywhere from 30 per cent to 69 per cent of the population in each province.Footnote 2
In addition to the core sample, CMAP currently contains information on the three territorial capitals, as well as all municipalities in the Greater Toronto Area. A living database, CMAP will continue to be expanded and updated with the assistance of the scholarly community and the broader public. As a first step, we are currently expanding CMAP to include all municipalities with a population greater than 25,000, which will add an additional 104 municipalities. Since some of the institutional characteristics documented in CMAP (such as service delivery arrangements) can change quite frequently, keeping the database up-to-date will be an ongoing challenge. In the first instance, we invite users of the database to submit any errors or updates that they notice directly to a dedicated CMAP correspondence address. In the longer term, our aim is to leverage scholarly and practitioner interest to secure funding support for a periodic comprehensive review of database information once every five years.
An Index of Authority Concentration for Canadian Cities
Making governing decisions is at the heart of what local politicians do. Local institutions influence how decisions are made by distributing formal decision-making authority in various ways across offices (for example, mayor versus council) and venues (for example, council versus special-purpose authorities) and by shaping the processes through which it is exercised. Yet researchers lack an overarching vocabulary that could be used to characterize this variation. We propose that a focus on the concentration of political authority can serve this purpose. Just as some metropolitan areas are more fragmented into multiple municipalities than others, so is decision-making power within municipalities diffused to varying degrees across public offices and decision venues.
Among scholars of Canadian local and urban politics, it is common to portray formal decision-making authority as highly diffuse (Sancton, Reference Sancton2015). In municipalities that feature nonpartisan councils elected by ward and a mayor with no significant executive powers, decision-making authority is distributed across the council as a whole, and councillors are heavily incentivized to focus on local constituent interests as opposed to citywide policy concerns (Moore, Reference Moore2017; Couture et al., Reference Couture, Breux, Bherer, Breux and Couture2018). Yet there are many urban municipalities in Canada—especially in Quebec and British Columbia, but also since 2023 in Ontario—that do not fit this pattern. Moreover, the overall distribution of political authority within a municipality is shaped by institutional variables beyond partisanship, electoral system and executive structure.
To produce a nuanced and integrated portrait of variation in the concentration of local political authority, we propose here a multidimensional index of authority concentration that can be used to systematically locate municipalities relative to each other on a continuum of concentrated to dispersed authority. In what follows, we draw on existing scholarship on Canadian local government institutions to identify four dimensions on which the concentration of political authority varies: geographical, executive, legislative, and service delivery. For each dimension, we identify one or more empirical indicators drawn from the CMAP database.
Geographical
Community or borough councils
Political authority in Canadian cities tends to be concentrated at the citywide level. However, some cities feature community councils (in Quebec, borough councils)—submunicipal decision-making bodies with delegated decision-making power over local matters, composed of elected representatives from one part of a municipality. Since they are made up of area representatives, they exist only in ward-based electoral systems, where they constitute an institutional mechanism for geographically decentralizing decision making. We thus consider municipalities with community or borough councils to have less concentrated geographical authority than those that do not have these features.
Ward versus at-large elections
Although electoral systems are not in and of themselves mechanisms for making governing decisions, they can influence how governing decisions are made by providing incentives that affect the priorities of local politicians. The most basic distinction here is between ward-based and at-large electoral systems. Ward-based elections incentivize councillors to respond to local constituent needs, whereas at-large systems incentivize councillors to prioritize citywide issues and concerns (Sancton, Reference Sancton2015: 249). In this sense then, at-large elections are institutional mechanisms that tend to geographically concentrate authority by focusing the municipal decision agenda on citywide issues.
Executive
Mayoral executive powers
While mayors in most large Canadian municipalities lack significant executive powers, a growing number do have a variety of powers over and above those of councillors. Based on discussion in Taylor and Dobson (Reference Taylor and Dobson2020), as well as on data from the CMAP profiles, we have identified five substantive executive powers sometimes given to Canadian mayors: the power to force council to reconsider a decision (veto and/or referral), to create standing committees, to hire and fire staff, to appoint members of an executive committee, and to call special council meeting. If a mayor has two or more of these, we take this as an indicator of concentrated executive authority.
Executive committee
As Sancton notes, “Over the years the most persistent method of attempting to provide political leadership and co-ordinated direction has been the establishment of executive committees of council” (Reference Sancton2015: 266). While the directly elected Boards of Control that used to exist in large Ontario municipalities are now long gone, urban municipalities in various regions of Canada have executive committees—usually composed of the mayor and a small subset of councillors—that have some control over budget matters, the council agenda and/or the appointment of administrative personnel. If a municipality has such a body (even if it is not called an executive committee), we take that as an indicator of concentrated executive authority.
Legislative
Political parties
Political parties are not part of the formal decision-making structure of a municipality, but the existence of a party system is widely seen in the literature as a mechanism for co-ordinating authority in the legislative process (Couture et al., Reference Couture, Breux, Bherer, Breux and Couture2018). While there is evidence that local political parties in some Canadian cities are little more than electoral vehicles for the political ambitions of key individuals (Breux and Couture, Reference Breux and Couture2018), other cities have enduring party systems in which programmatic differences among parties structure electoral choices, and partisan councillors work together to pursue programmatic aims on council (Tennant, Reference Tennant1980; Chiasson et al., Reference Chiasson, Gauthier and Andrew2014). We thus take the presence of parties as an indicator of concentrated authority in the legislative process.
Service delivery
Some core municipal services—such as planning and development permits, or local roads—are always (or almost always) delivered in-house by Canadian municipalities. However, in many other fields, there is significant variation in the degree to which services are under direct municipal control. We focus on 10 services that are subject to such variation and that are included in the CMAP database: police, fire, emergency medical services (EMS), water, sewer, transit, library, parking, waste management, and electricity. We use a simplified version of Lucas’ (Reference Lucas2017: 72–74) classification system for institutional structure to characterize each service in terms of the concentration of authority. If the service is delivered directly through a municipal department, we classify that as concentrated authority. If the municipality does not control the service at all (because it is delivered by another level of government or by the private sector, for instance), we classify that as dispersed authority. Finally, if the service is delivered by a special-purpose body (SPB) that is controlled by the municipality, or through a municipally administered contract, we classify that as an intermediate case.
Applying the Index: Sample, Scoring and Limitations
To apply our index of authority concentration, we used data on the CMAP core national sample of 65 municipalities. Our scoring system is outlined in Table 1. For each indicator, 0 indicates dispersed authority, and 1 indicates concentrated authority. For the final composite index of authority concentration, we weighted each dimension equally as indicated in the right-most column. The raw service delivery scores (out of 10) were converted to a 0 to 2 scale by dividing the 65 sample scores into three roughly equal groups (those that score 0 to 5, those that score 5.5 to 7, and those that score 7.5 to 10). The index thus ranges from 0 to 8.
Dimensions, Indicators and Scoring for Authority Concentration Index

Our measures focus on elements of the municipal institutional landscape that have been identified as substantively significant in prior research. Our scoring is designed to allow us to capture variation in institutional authority while also being relatively simple to apply. The four dimensions are weighted equally in our composite index because they are qualitatively different from each other, so there is no compelling reason to suggest that one dimension is more important than another. All that said, we do not claim that our measures, scoring and weighting are somehow definitive. On the contrary, we consider our index to be a first cut, one that illustrates the analytical value of such a tool and that we hope will spark debate and discussion about how variation in the structure of local decision-making authority in Canadian municipalities might best be conceptualized and measured.
We also do not mean to suggest that the institutional features that are the focus of our index fully determine the dynamics of local decision making. This is clearly not the case. It is well documented, for instance, that in Canadian “weak mayor” systems, a mayor's personal leadership and communication skills are of critical importance (Sancton, Reference Sancton2015; Graham, Reference Graham2018). Indeed, a wide variety of factors—ranging from the policy preferences of political leaders to the structure and mobilization of local societal groups—shape the practice of local politics in Canadian cities (Horak et al., Reference Horak, Lucas and Taylorforthcoming). However, there are good reasons to believe that formal structures of decision-making authority have an important influence on the practice of local politics and that it is therefore important to understand the shape that they take and how it varies across Canadian municipalities.
Patterns of Authority Concentration in Canadian Urban Municipalities
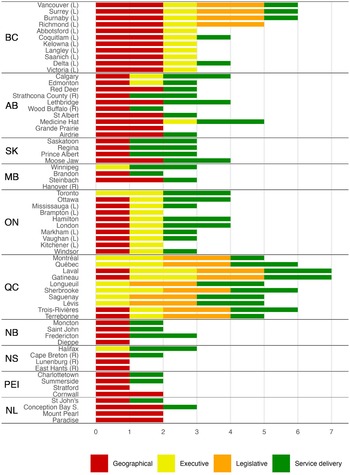
What can we learn using our index about patterns of authority concentration in Canadian municipalities? Before we present the composite index scores, let us explore the results on individual indicators. Figure 1 shows the raw indicator values on the geographical, executive and legislative dimensions. Each indicator is shown separately, and each is equally weighted. The municipalities are arranged in the table by province from top (west) to bottom (east) and from most to least populous within each province. Lower-tier municipalities in two-tier local government systems are designated with an (L); rural municipalities with a large land area and no single dominant population centre are designated with an (R).
Geographical, executive and legislative concentration of authority
Note: In this figure, as well as in Figures 2 and 3, (L) denotes lower-tier municipalities in two-tier local government systems. (R) denotes rural municipalities that cover a large land area with no single dominant population centre.

Geographical
Figure 1 shows that at-large elections exist in 23 of our 65 cases, including all the cases in British Columbia and most of the smaller municipalities in Alberta. Beyond this, at-large elections only appear in a handful of smaller municipalities in other provinces. This is not to say, of course, that at-large elections are necessarily uncommon in these provinces—just that they are uncommon in the populous municipalities in our sample. Community or borough councils are relatively uncommon in our sample. Since our indicator of authority concentration is the absence of such councils, most of our sample municipalities score 1 on this indicator. Community or borough councils only exist in 10 of our 65 cases—six municipalities in Quebec, plus Winnipeg, Toronto, Halifax, and Hanover, a geographically large municipality in Manitoba that contains several small population centres. Interestingly, all these municipalities except for Hanover (a historically Mennonite rural area south of Winnipeg) are products of provincially imposed amalgamations. In these cases, community committees, community councils or borough councils were designed to counterbalance the larger-scale centralization of authority that amalgamation brought.
Executive
Mayors have substantial executive powers in 26 of our cases—all 11 British Columbia cases, all of the Ontario cases, and some of the Quebec cases. This represents a significant change from prior to 2022, when the City of Toronto was the only Ontario municipality in this position. Executive committees exist in 16 of our cases. Ten of these constitute our entire Quebec sample; executive committees play a prominent and well-known role in the organization of local political authority in Quebec's urban municipalities. Outside Quebec, we see executive committees scattered across the largest cities in several provinces—Edmonton, Calgary, Winnipeg, Toronto and Halifax—and, perhaps surprisingly, in Medicine Hat, Alberta. Indeed, Medicine Hat (pop. 60,000) is a fascinating anomaly more generally. It is by far the smallest municipality in our sample to have three features of concentrated authority, and it is also the only municipality in which both at-large elections and an executive committee are present.
Legislative
Finally, political parties, as might be expected, exist only in Quebec and British Columbia—all of our Quebec cases have them, but only the four most populous municipalities in British Columbia currently do, for a total of 14 out of 65.
In aggregate terms, the clearest pattern in Figure 1 is the contrast between British Columbia and Quebec, on the one hand, and the rest of the country, on the other. The common wisdom of British Columbia and Quebec being “different” is thus supported. However, as we have already seen, Quebec and British Columbia are also substantially different from each other. In British Columbia, power is geographically concentrated, but there are no executive committees—in part because small (sometimes partisan) councils elected at-large probably already behave somewhat like executive committees might. In Quebec, by contrast, many cities appear—whether by design or not—to counterbalance the combination of party systems and strong executive committees, which produce what some have called a “Westminsterization” of local politics (Mévellec and Tremblay, Reference Mévellec and Tremblay2013), with a decentralization of authority to submunicipal borough councils.
The aggregate picture across the other provinces is one of relatively low authority concentration on our first three dimensions. Outside of British Columbia and Quebec, only Medicine Hat in Alberta has more than two of the five indicators of concentrated authority. In Ontario, the recent introduction of “strong mayor” powers has increased the concentration of authority in big cities. Perhaps unsurprisingly, the six large rural municipalities in our sample have dispersed authority on all three dimensions shown in Figure 1. Medicine Hat aside, a couple of idiosyncratic cases worth mentioning are Toronto, the only city outside Quebec that has a “Quebec-style” combination of community/borough councils, mayoral executive powers and an executive committee, and Hanover, Manitoba, the most deconcentrated municipality in our entire sample.
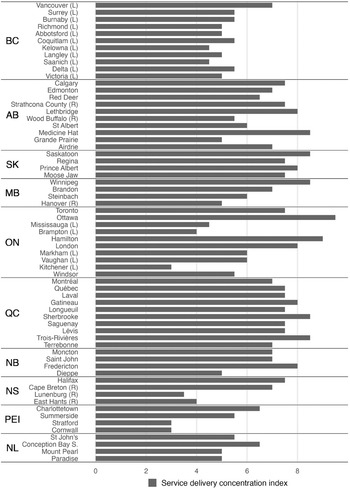
We now turn our attention to the extent to which governing authority over service delivery is concentrated in municipal hands. Figure 2 aggregates the raw scores for all 10 services based on the scoring criteria outlined in the previous section. Compared to the scores on our first three dimensions, the patterns are not as clear. The most immediately apparent patterns are that lower-tier municipalities in two-tier systems—noted (L)—control fewer services directly and that less populous municipalities in some provinces tend to score lower than more populous ones. We can, however, use our data to test Lucas’ (Reference Lucas2017) finding that service delivery models vary notably by policy field. Lucas’ finding is based on a longitudinal study of six municipalities, whereas CMAP allows us to examine patterns on a much larger cross-sectional sample.
Concentration of authority over service delivery

Table 2 shows the distribution of service delivery models across the 10 services included in our index. All nonmunicipal models, including private, voluntary, provincial and federal delivery, are bundled together in the right-most column. Clearly, service delivery does vary systematically by policy field across our sample. Fire, water, sewer, parking and waste management services all tend to be delivered directly by municipal departments. For transit, police and library services, service delivery is split relatively evenly between municipal department, dependent SPB, and nonlocal models. Meanwhile, electricity and EMS are most often delivered by a nonlocal body. Taken together, these patterns provide clear evidence of the importance of property services as a core component of what Canadian municipalities do, since four of the five services that are usually delivered by municipal department—fire, water, waste management and sewer—are also direct services to property, whereas services that are not as directly connected to property (transit, libraries, police, EMS) are much less frequently under direct municipal control.
Distribution of Service Delivery Model by Service

Now we will combine all four dimensions of our index of authority concentration, reweighting each dimension equally (see above) to generate a composite authority concentration score. Figure 3 presents the results. The scores range from 0 (1 case) to 7 (2 cases) out of a maximum possible score of 8, with a mean score of 3.37 and a median of 3. Clear interprovincial differences are evident, underlining the importance of different provincial contexts and legislative frameworks as factors that shape the institutional structure of local authority. For instance, in Quebec the minimum score is 5; outside Quebec and British Columbia, the maximum score is 5, which is found in only one municipality (Medicine Hat). Table 3 presents mean scores by province and dimension. The composite mean score is highest in Quebec, driven by a high concentration of legislative, executive and service delivery authority (by contrast, Quebec has the lowest scores of any province on the geographical dimension), and lowest in the Atlantic provinces and Manitoba. The continued prevalence of institutionally “weak” mayors and nonpartisan elections in most provinces is reflected in the prevalence of low scores on the executive and legislative dimensions. The results corroborate the picture of significant variation by province in the institutional structure of authority in Canada.
Composite index of authority concentration

Mean Authority Concentration Scores by Dimension and Province

Our index can also be used to explore whether the concentration of authority varies by municipal population. As the visualization in Figure 4 shows, the concentration of authority does vary in systematic and largely intuitive ways across our sample. The geographical concentration of authority decreases in more populous municipalities, which are more likely to have ward elections and borough or community councils; however, larger population is associated with more concentrated authority on the legislative, executive and service delivery dimensions, as well as with a higher overall concentration of authority across our four dimensions.
Authority concentration index score by population quintile

Conclusion
The CMAP is a useful tool for advancing our empirical understanding of local government institutions in Canadian cities. In this article, we have used CMAP measures to build a multidimensional index of authority concentration and have applied it to the 65 municipalities in the core CMAP sample. The results put empirical weight behind the received wisdom that outside Quebec and British Columbia, local government authority in urban municipalities tends to be institutionally deconcentrated. However, the systematic application of a multidimensional index also allows us to move beyond this received wisdom and add depth and nuance to our understanding of municipal institutions in Canadian cities. As we have demonstrated, there is substantial variation in the concentration of political authority within provinces; the governance of services varies more by service field than by province; community or borough councils usually exist in municipalities that are the result of imposed amalgamations; and some municipalities—both large (for example, Toronto) and smaller (for example, Medicine Hat) have unique configurations of institutional characteristics that distinguish them from the others in our sample.
As we have demonstrated, then, a database such as CMAP can be used to substantiate qualitative claims in the literature, to identify empirical associations and to uncover previously overlooked institutional arrangements and cases that are worth further investigation. The CMAP dataset and application will become more comprehensive and analytically useful as more municipalities are added. As noted, the core sample privileges municipalities with large populations over small ones and coverage of all provinces over variation within provinces. Our current expansion project, which will add all municipalities with a population of over 25,000 to the database, will go a long way toward addressing these issues. We also plan to incorporate additional contextual variables, including the relative demographic and geographic weight of urban municipalities within metropolitan areas. Finally, we are exploring with partners the potential to include fiscal data. As the number of observations in the dataset is expanded, the authority concentration index will have the potential to be used as an independent variable in statistical analyses.
Scholars of urban governance in Canada are, of course, correct—local institutions are indeed only a part of a much broader constellation of forces that shapes urban political and policy processes and their outcomes. Yet, limited and changeable as they may be, local institutions are foundational to urban politics, as the many political struggles about their shape over the years attest. Local institutions play an important part in structuring the broader matrix of rules, norms and incentives within which those who govern our cities operate. We can only benefit from knowing more about the many forms that they take.
Acknowledgments
Many individuals have supported the development of CMAP over the last four years. Research assistants who contributed to the project include Gabriel Barbosa, Brittany Bouteiller, Tomother Khalif, Charlotte Kurs, Amanda Miknev, Sarah Shields and Salomé Vallette. Local experts who verified big city institutional profiles include Laurence Bherer, Marc Comeau, Kate Daley, Gabriel Eidelman, Joe Garcea, Kristin Good, Mario Levesque, Jack Lucas, Laurie MacLean, Warren Magnusson, Anne Mévellec, Aaron Moore, Tom Urbaniak and Graham White. Special thanks to Gabriel Eidelman and Joe Lyons, who incorporated completion and validation of institutional profiles as an assignment in their courses at the University of Toronto and the University of Western Ontario, respectively. It is thanks to the work of their students that we have profiles of all municipalities in the Greater Toronto Area. Financial support for research assistance with the CMAP project has come from a variety of internal sources at the University of Western Ontario, including a Knowledge Mobilization Innovation Grant, the Undergraduate Summer Research Internship program and the Work-Study Program. The project leaders gratefully acknowledge this financial support.
Competing Interests
The authors declare no competing interests.


 Open access