


Non-technical Summary
Our study investigates the co-occurrence structure (types of taxonomic associations) of western North American mammal paleocommunities following the intensification of the great American biotic interchange. We address the impacts of invasion on community structure by calculating the strength of genus associations and differences in ecological roles of the associated pairs. Interestingly, despite a major climate shift and an influx of immigrant mammals from South America, co-occurrence structure remains consistent even though new mammals are forming significant associations. We suggest that this demonstrates a level of resiliency against biological invasions in mammalian communities before human impacts.
Introduction
Understanding the impacts of major ecological, environmental, and climatic transitions on biological communities is a primary focus for conservation paleobiology and modern ecologists (Hairston et al. Reference Hairston, Smith and Slobodkin1960; Caswell Reference Caswell1976; Pearson Reference Pearson1977; Villéger et al. Reference Villéger, Ramos Miranda, Flores Hernández and Mouillot2010; Bannar-Martin Reference Bannar-Martin2014; Lyons et al. Reference Lyons, Amatangelo, Behrensmeyer, Bercovici, Blois, Davis and DiMichele2016; Tóth et al. Reference Tóth, Lyons, Barr, Behrensmeyer, Blois, Bobe and Davis2019; Fraser and Lyons Reference Fraser and Lyons2020). The consistency of community structure is key in maintaining ecosystem functioning and resiliency against disturbances. However, the exploration and investigation of changes in community structure is exceptionally complex, because structure is driven by numerous components of biological systems and interactions (Caswell Reference Caswell1976). Species diversity, richness, and abundance are some of the most commonly examined components (Caswell Reference Caswell1976; Kempton Reference Kempton1979). Although ecologists are increasingly employing other metrics to examine the importance of biological relationships and functional roles on community structure (Villéger et al. Reference Villéger, Mason and Mouillot2008; Veech Reference Veech2013, Reference Veech2014), paleoecologists more recently have begun applying these methods to study critical intervals in the fossil record, including climate shifts and biological invasions. For example, periods of major climate transitions can lead to dramatic shifts in vegetation distributions, resulting in non-analogue habitats (Behling Reference Behling1998; Blinnikov et al. Reference Blinnikov, Busacca and Whitlock2002; Yang et al. Reference Yang, Wu, Liu, Zhang, Zhang and Wan2011). Altering resource availability can cause extinctions, as well as shifts in geographic ranges (Lyons Reference Lyons2003, Reference Lyons2005; Pardi and Graham Reference Pardi and Graham2019). This results in the loss or gain of species interactions (Mitchell et al. Reference Mitchell, Agrawal, Bever, Gilbert, Hufbauer, Klironomos and Maron2006). Similarly, large-scale immigration likely impacts species associations, such as competition, mutualisms, and facilitations, altering the relative importance of underlying mechanisms that drive how communities of organisms assemble (Mitchell et al. Reference Mitchell, Agrawal, Bever, Gilbert, Hufbauer, Klironomos and Maron2006; Pardi and Graham Reference Pardi and Graham2019). Thus, evaluating changes in community structure across space and time during past disturbances is particularly informative in understanding mammalian community assembly.
The Plio-Pleistocene transition was a period of major environmental perturbation. The closing of the Isthmus of Panama intensified the intermingling of North and South American mammalian biota, while simultaneously there was the onset of Northern Hemisphere glaciation (Woodburne Reference Woodburne2010; Bacon et al. Reference Bacon, Molnar, Antonelli, Crawford, Montes and Vallejo-Pareja2016). These events led to the modification of North and South American mammal communities (Webb Reference Webb1976, Reference Webb1991; Marshall et al. Reference Marshall, Webb, Sepkoski and Raup1982; Bacon et al. Reference Bacon, Molnar, Antonelli, Crawford, Montes and Vallejo-Pareja2016; O’Dea et al. Reference O’Dea, Lessios, Coates, Eytan, Restrepo-Moreno, Cione and Collins2016). While the land bridge between North and South America was likely in place as early as 10 Ma, its low elevation meant it was continuously flooded until the late Pliocene (Whitmore and Stewart Reference Whitmore and Stewart1965; Coates et al. Reference Coates, Collins, Aubry and Berggren2004; Woodburne Reference Woodburne2010; Bacon et al. Reference Bacon, Molnar, Antonelli, Crawford, Montes and Vallejo-Pareja2016). By 3 Ma, uplift caused by the meeting of the North and South American plates permanently divided the Gulf of Mexico and the Pacific Ocean and the ocean circulation between the Americas ceased (Coates et al. Reference Coates, Collins, Aubry and Berggren2004; Schmidt Reference Schmidt, Williams, Haywood, Gregory and Schmidt2007). The reorganization of ocean currents may have contributed to the onset of glaciation in the Northern Hemisphere (Huguet et al. Reference Huguet, Jaeschke and Rethemeyer2022; Yi et al. Reference Yi, Medina-Elizalde, Tan, Kemp, Li, Kletetschka and Xie2023). The shift toward a cooling climate and the rapid expansion of glaciers in North America (Balco and Rovey Reference Balco and Rovey2010; Bacon et al. Reference Bacon, Molnar, Antonelli, Crawford, Montes and Vallejo-Pareja2016) pushed mammals to lower latitudes (Morgan and Emslie Reference Morgan and Emslie2010); steppe-tundra habitats were displaced southward (Morgan and Emslie Reference Morgan and Emslie2010).
The movement of mammals between the Americas is known as the great American biotic interchange (GABI). Many studies have evaluated the taxonomic identification, functional roles, and timing of the movements (Webb Reference Webb1976; Marshall et al. Reference Marshall, Webb, Sepkoski and Raup1982; Carrillo et al. Reference Carrillo, Faurby, Silvestro, Zizka, Jaramillo, Bacon and Antonelli2020). For example, although the Isthmus of Panama was in place by 10 Ma, the migration of mammals between continents remained minor until ~3–2.5 Ma (Webb Reference Webb1976, Reference Webb1991; Bacon et al. Reference Bacon, Molnar, Antonelli, Crawford, Montes and Vallejo-Pareja2016) with only a few mammal taxa crossing before this time (Bacon et al. Reference Bacon, Molnar, Antonelli, Crawford, Montes and Vallejo-Pareja2016). The earliest migrants into North America were giant ground sloths, which were large and more generalist in their lifestyle. By the middle to late Pliocene, armadillos, porcupines, and capybara-like rodents followed (Webb Reference Webb1976; Woodburne Reference Woodburne2010). Occurrences of South American taxa in North America were fairly rare before the Plio-Pleistocene transition, increasing by 50% afterward (Webb Reference Webb1991; Bacon et al. Reference Bacon, Molnar, Antonelli, Crawford, Montes and Vallejo-Pareja2016). The South American mammals that ultimately immigrated represented a diverse set of functional roles, including 36 families (Woodburne Reference Woodburne2010). Although some of the South American mammals were successful and remain part of the North American fauna, others did not move northward beyond the subtropics or are no longer found in North America (Carrillo et al. Reference Carrillo, Faurby, Silvestro, Zizka, Jaramillo, Bacon and Antonelli2020). In contrast, North American migrants into South America experienced far greater success, likely due to the higher extinction rates of native South American taxa (Carrillo et al. Reference Carrillo, Faurby, Silvestro, Zizka, Jaramillo, Bacon and Antonelli2020). As a result of the rapidly changing climate and an influx of new mammals from South America, the North American fauna experienced major ecological disturbance. Although previous studies on the Plio-Pleistocene transition have evaluated migration, extinction, and origination rates across this interval (Webb Reference Webb1976, Reference Webb1991; Bacon et al. Reference Bacon, Molnar, Antonelli, Crawford, Montes and Vallejo-Pareja2016; Carrillo et al. Reference Carrillo, Faurby, Silvestro, Zizka, Jaramillo, Bacon and Antonelli2020), the impact on other aspects of community structure remains largely unexplored.
Two methods that have been used to quantify changes in mammalian community structure are pairwise co-occurrence analysis (Gotelli Reference Gotelli2000; Lyons et al. Reference Lyons, Amatangelo, Behrensmeyer, Bercovici, Blois, Davis and DiMichele2016; Tóth et al. Reference Tóth, Lyons, Barr, Behrensmeyer, Blois, Bobe and Davis2019) and functional trait analysis (Villéger et al. Reference Villéger, Mason and Mouillot2008, Reference Villéger, Ramos Miranda, Flores Hernández and Mouillot2010; Cadotte et al. Reference Cadotte, Carscadden and Mirotchnick2011). Co-occurrence analysis evaluates the extent to which pairs of species occupy the same communities (Gotelli Reference Gotelli2000; Tóth et al. Reference Tóth, Lyons, Barr, Behrensmeyer, Blois, Bobe and Davis2019). Species can be segregated (appearing together less often than expected), aggregated (appearing together more often than expected), or random (not significantly aggregating or segregating). Patterns of species associations over time and space give important insight into the mechanisms that determine how mammals filter into communities, including dispersal limitations, environment filtering, and competition (Cordero and Jackson Reference Cordero and Jackson2019). Species functional traits (e.g., body mass, diet, life habit, locomotion) define a mammal’s ecological role in an ecosystem (Villéger et al. Reference Villéger, Mason and Mouillot2008; González-Maya et al. Reference González-Maya, Víquez-R, Arias-Alzate, Belant and Ceballos2016), and species associations are heavily influenced by the functional roles of the constituent species (Soliveres et al. Reference Soliveres, Maestre, Bowker, Torices, Quero, García-Gómez and Cabrera2014; Schamp et al. Reference Schamp, Gridzak, Greco, Lavender, Kunasingam, Murtha, Jensen, Pollari and Santos2022). Moreover, functional traits provide a link to ecosystem functioning by interacting with assembly mechanisms in shaping communities and species associations (Villéger et al. Reference Villéger, Mason and Mouillot2008; Cadotte et al. Reference Cadotte, Carscadden and Mirotchnick2011; Cadotte Reference Cadotte2017; Stewart et al. Reference Stewart, Carmona, Clements, Venditti, Tobias and González-Suárez2023). Combining information on functional diversity with co-occurrence strengths allows us to characterize changes in communities more fully and potentially infer the underlying mechanisms driving mammalian community structure (Schamp et al. Reference Schamp, Gridzak, Greco, Lavender, Kunasingam, Murtha, Jensen, Pollari and Santos2022). For the remainder of this paper, we will use “community structure” and “co-occurrence structure” interchangeably.
Our study aims to understand how the combined effects of climate change (e.g., glaciation) and species turnover (e.g., GABI) affected mammalian communities in western North American across the Plio-Pleistocene transition. Because other periods of glaciation (e.g., the late Pleistocene) have shown significant shifts in the structure of mammal (Lyons Reference Lyons2005; Pardi and Graham Reference Pardi and Graham2019; Tóth et al. Reference Tóth, Lyons, Barr, Behrensmeyer, Blois, Bobe and Davis2019) and plant communities (Gill et al. Reference Gill, Williams, Jackson, Lininger and Robinson2009; Lyons et al. Reference Lyons, Amatangelo, Behrensmeyer, Bercovici, Blois, Davis and DiMichele2016), we predict similar changes in western North American mammals due to the combined influences of glaciation and immigration by South American species. Here we use the combined methodologies of functional diversity and co-occurrence to identify changes in western North American mammal community structure across the Plio-Pleistocene transition. Specifically, we compare the relative proportions of significant aggregations versus segregations before and after the transition. We also examine the relationships between functional role, association types, and the long-term survival of a genus. Finally, we investigate whether the continental origin of a genus influences the types of associations formed.
Methods and Data
Occurrence Data
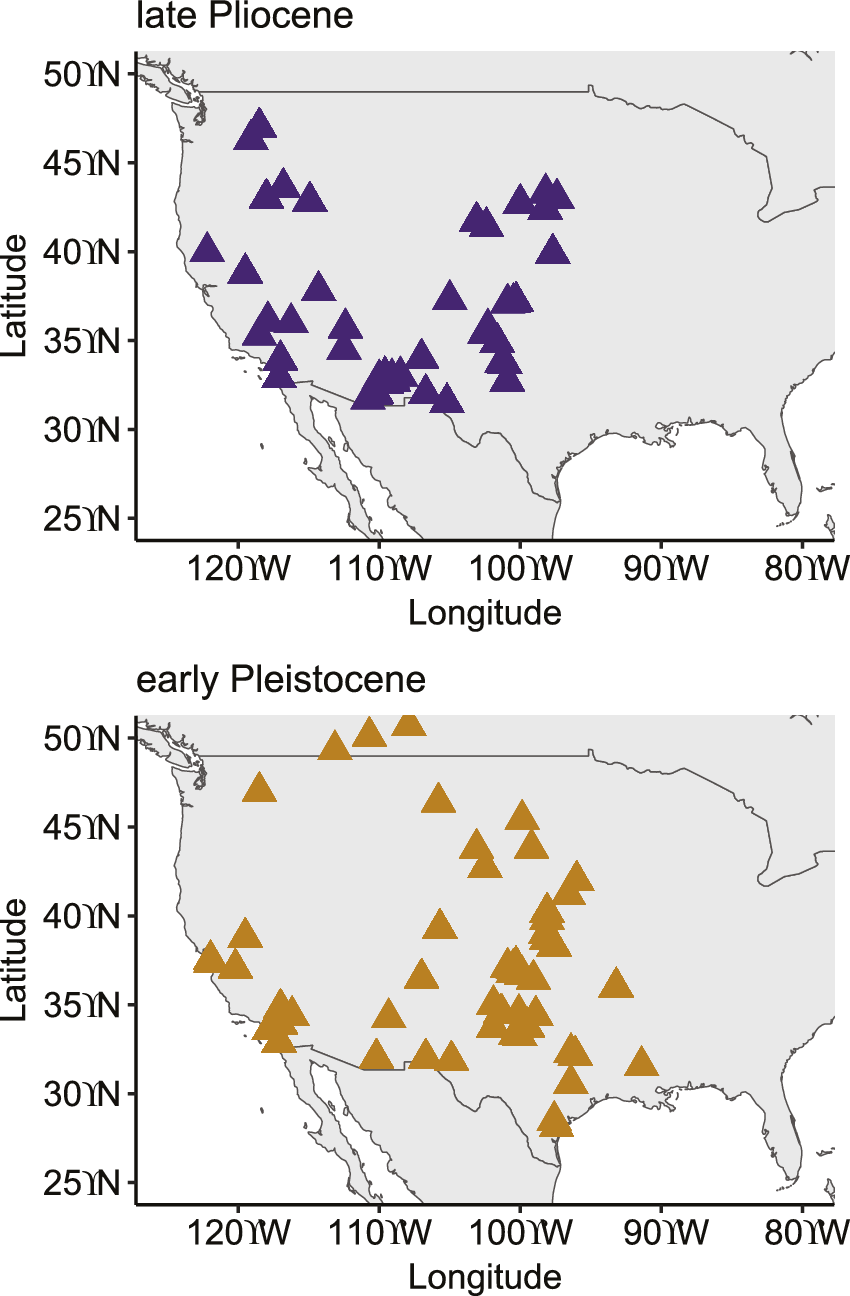
Our study includes 126 North American localities spanning the Plio-Pleistocene transition (Fig. 1). Data on occurrences come from the Paleobiology Database (https://paleobiodb.org/#/) and include a total of 118 genera (Datafile1). References for the primary literature of the fossil localities can be found in Datafile4. Paleocommunities are divided into two equal time bins, pre-glaciation (4–2.5 Ma) and early Pleistocene (2.5–1 Ma). Each paleocommunity was a fossil locality or a combination of fossil localities. Paleocommunities were constrained using the following criteria: (1) because data were limited for the eastern region, we only used localities between 125°W and 90°W and less than 55°N. (2) Any paleocommunities with the same estimated date range and same longitude and latitude location were combined into a single site. (3) Due to preservation biases, only mammals above 1 kg were included. (4) Only terrestrial mammals were used, no volant or marine mammals were included in the data. Genera were defined as South American or North American based on the earliest occurrence of the family before 10 Ma. By using the family level to identify the continental origin of a genus, we ensured that the less robust fossil record of South America would not cause a potential bias in assigning continental origins. The continental species pool was also compiled using all terrestrial mammalian genera over 1 kg occurring in North America (minus Mexico) between 4 and 1 Ma.
Map of the geographic locations of localities in the late Pliocene and early Pleistocene time intervals.

Co-occurrence
We examined co-occurrence at the genus level. A minimum of five genera were required for a paleocommunity to be included in the co-occurrence analysis (Tóth et al. Reference Tóth, Lyons, Barr, Behrensmeyer, Blois, Bobe and Davis2019). Co-occurrence analysis was run separately for the late Pliocene time bin (4–2.5 Ma) and the early Pleistocene time bin (2.5–1 Ma) using the cooccur R package (Griffith et al. Reference Griffith, Veech and Marsh2016). The Veech (Reference Veech2013) pairwise method was used to determine whether significant genus pairs were either aggregated (occur together more often than expected), segregated (occur together less often than expected), or random (not significantly associated). This probabilistic method compares the observed number of times two genera occur together against the expected frequency (Veech Reference Veech2006, Reference Veech2013, Reference Veech2014). The expected frequency is the result of multiplying the total number of sites with the probability that each genus occurs at a site: E(N 1,2) = P(1) × P(2) × N. Combinatorics were used to determine whether the expected frequency is significantly different from the observed frequency of two genera co-occurring. We ran 100 iterations of a random subsampling routine, pulling 30 random communities from each time bin, accounting for differences in sample size between time bins. This approach provided two p-values that determined whether the pair was significantly aggregating or segregating (Veech Reference Veech2013). Subsequently, the Fisher’s exact test mid-P variant provided a weight to score the strength of each significant pair. Co-occurrence strengths were calculated for each of the 100 iterations in our random sampling routine. These scores were averaged within each genus pair, providing mean co-occurrence strength for each pair accounting for variation between subsamples (Tóth et al. Reference Tóth, Lyons, Barr, Behrensmeyer, Blois, Bobe and Davis2019). The raw scores were then z-transformed using the qnorm function in R to standardize them between positive and negative infinity (Tóth et al. Reference Tóth, Lyons, Barr, Behrensmeyer, Blois, Bobe and Davis2019). This resulted in segregated pairs having negative scores and aggregated pairs having positive scores (Datafile2). The Kolmogorov-Smirnov test was conducted to determine whether there was a significant difference in the distribution of pair strengths between time bins. By identifying significant changes in pair strength distributions, we can detect shifts in community structure that may otherwise not be found when evaluating other components of community structure (species richness, diversity, etc.).
Functional Diversity and Functional Distance
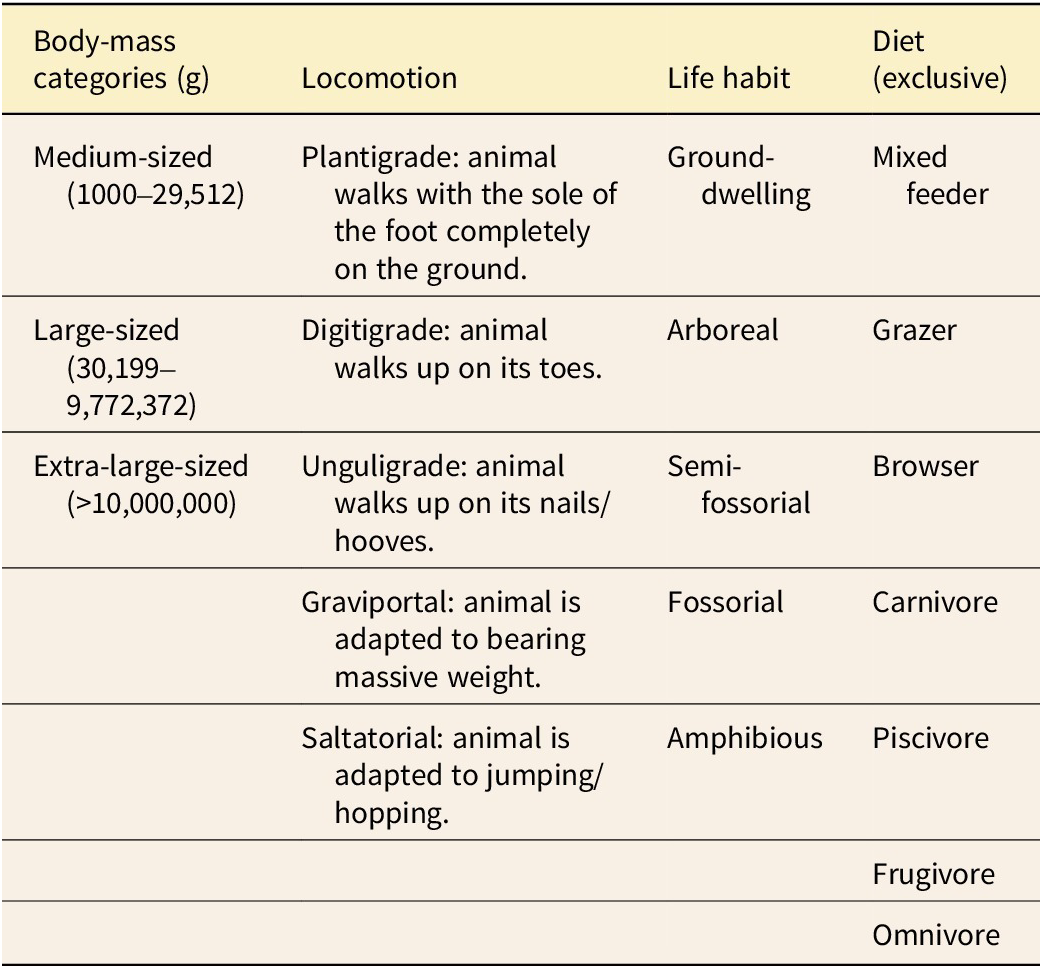
To calculate functional diversity, we compiled four functional traits for each genus (body-mass category, diet, locomotion, and life habit). Traits were identified from the primary literature and online databases. The functional traits for each genus were determined based on species-level trait data found in Datafile3, where all trait references can be found. Body masses were averaged for a genus, and categorical traits were chosen based on the most prevalent category found in that genus. Body mass, diet, locomotion, and life habit were the traits chosen for this study because they are highly conserved at the genus level and interpretable from the fossil record. Locomotion and life habit are interpreted using morphological attributes of the postcranial skeleton and inferred based on phylogeny if postcranial data are not available. Body mass is estimated from teeth or postcranial measurements, depending on the specimen and mammal clade. Diet is inferred from tooth morphology or isotopic data. Furthermore, due to the young geologic age of many genera in this study, inferences about ecological roles can also be made from extant species. Numeric body-mass categories were based on Pineda-Munoz et al. (Reference Pineda-Munoz, Evans and Alroy2016). They found that these body-mass categories were highly associated with the ecological role of a species (Table 1). Diet was a single category based on the most common dietary preference of the species within the genera. Locomotion was inferred from the morphological limb structure that determines a mammal’s stance and was highly conserved across species within each genus. Life habitat reflected the commonly preferred habitat of the genera, and the most abundant category across species in a genus was chosen (Table 1).
Functional trait categories are used to calculate functional diversity and ordinate each genus in functional trait space

Using these traits, we calculated functional diversity for all mammalian genera in our dataset to allow for direct comparisons of functional roles across both time bins. A genus by trait matrix was used to make a distance matrix with the Gower’s dissimilarity method (Laliberté et al. Reference Laliberté, Legendre and Shipley2014). In the distance matrix, categorical traits are not ranked or ordered, but they are identified as a 1 (match) or 0 (no match) between two genera. The distance matrix was analyzed with the dbFD function from the FD R package (Laliberté et al. Reference Laliberté, Legendre and Shipley2014). A square-root correction was applied to the non-Euclidean dataset. The dbFD function uses a principal coordinates analysis (PCoA) to provide PCoA axes for each genus, allowing for the ordination of each genus in multidimensional space.
Subsequently, we used the four PCoA axes of each genus, provided by the functional diversity analysis, to calculate Euclidean distances between each pair of genera in multidimensional space using this Excel equation: =SQRT(SUMXMY2(array_x,array_y)). Array x is the first four axes of one genus, and array y is the first four axes of the second genus. Kolmogorov-Smirnov tests were used to assess differences in the distribution of functional distance between genera for significant associations between late Pliocene and early Pleistocene.
Extinction versus Survivorship of Genera
Survivorship of mammalian genera across the Plio-Pleistocene transition was determined by whether the first occurrence of each genus occurred before 1 Ma in North America. Information on first and last appearances can be found in Datafile5. We used the Paleobiology Database to collect information on the maximum and minimum date of the last appearance. We used the youngest estimated date (most recent) of their survival for all graphs in the main text, but included graphs using the oldest estimated date of extinction in the Supplementary Material.
Results
Co-occurrence Structure
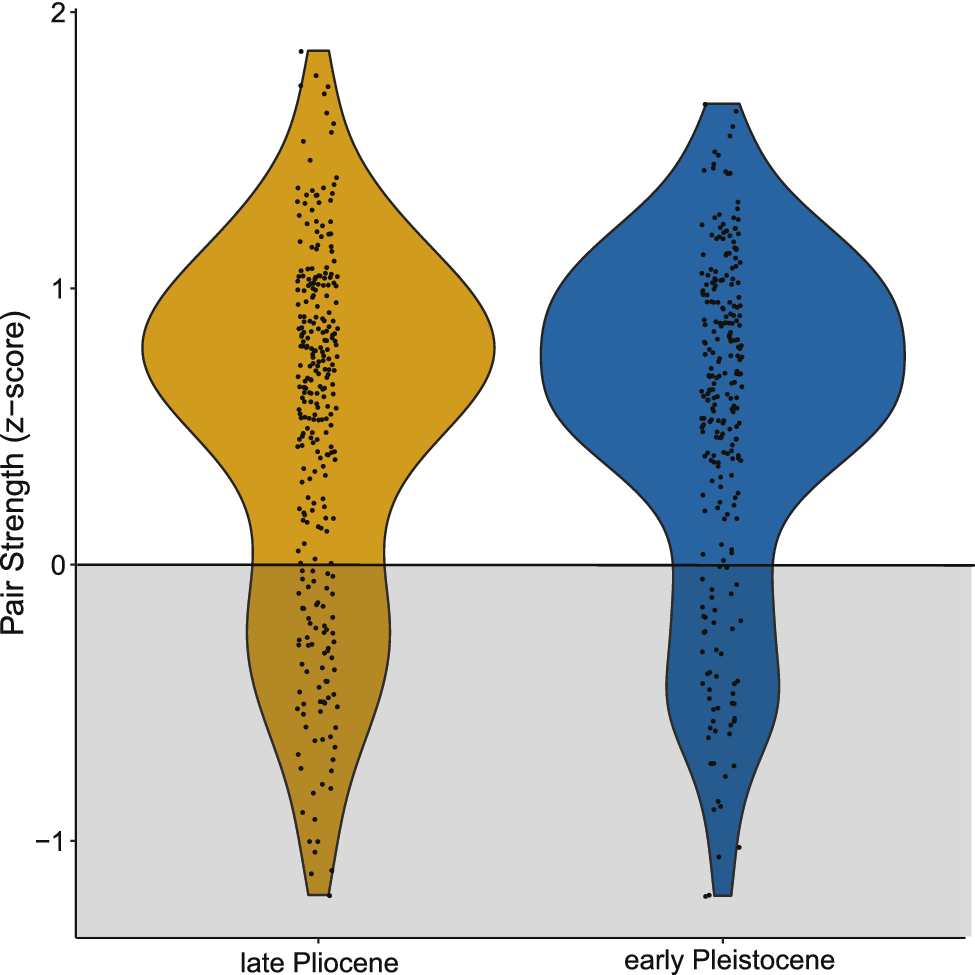
The distribution of co-occurrence strengths for segregating and aggregating genus pairs does not significantly change even though the number of significant pairs declines from the late Pliocene to early Pleistocene (Kolmogorov-Smirnov: p = 0.5731; number of significant pairs: Pre = 291, Post = 255; Fig. 2). In addition, our results show that both time intervals have a greater proportion of aggregations than segregations. Moreover, the association strengths of segregations tend to be weaker than those of aggregations on average. While the overall pattern of aggregations and segregations does not change, the identity of genera forming significant pairs does (DataFile1).
The distribution of z-scores for all significant pairs in pre- and post-transition time bins. Scores less than zero indicate segregations, and scores greater than zero indicate aggregations. The plot widens along the y-axis based on the number of genus pairs. The violin plot widens with a greater number of genus pairs and thins with fewer pairs.

South American Migrants versus North American Native Mammal Co-occurrence Structure
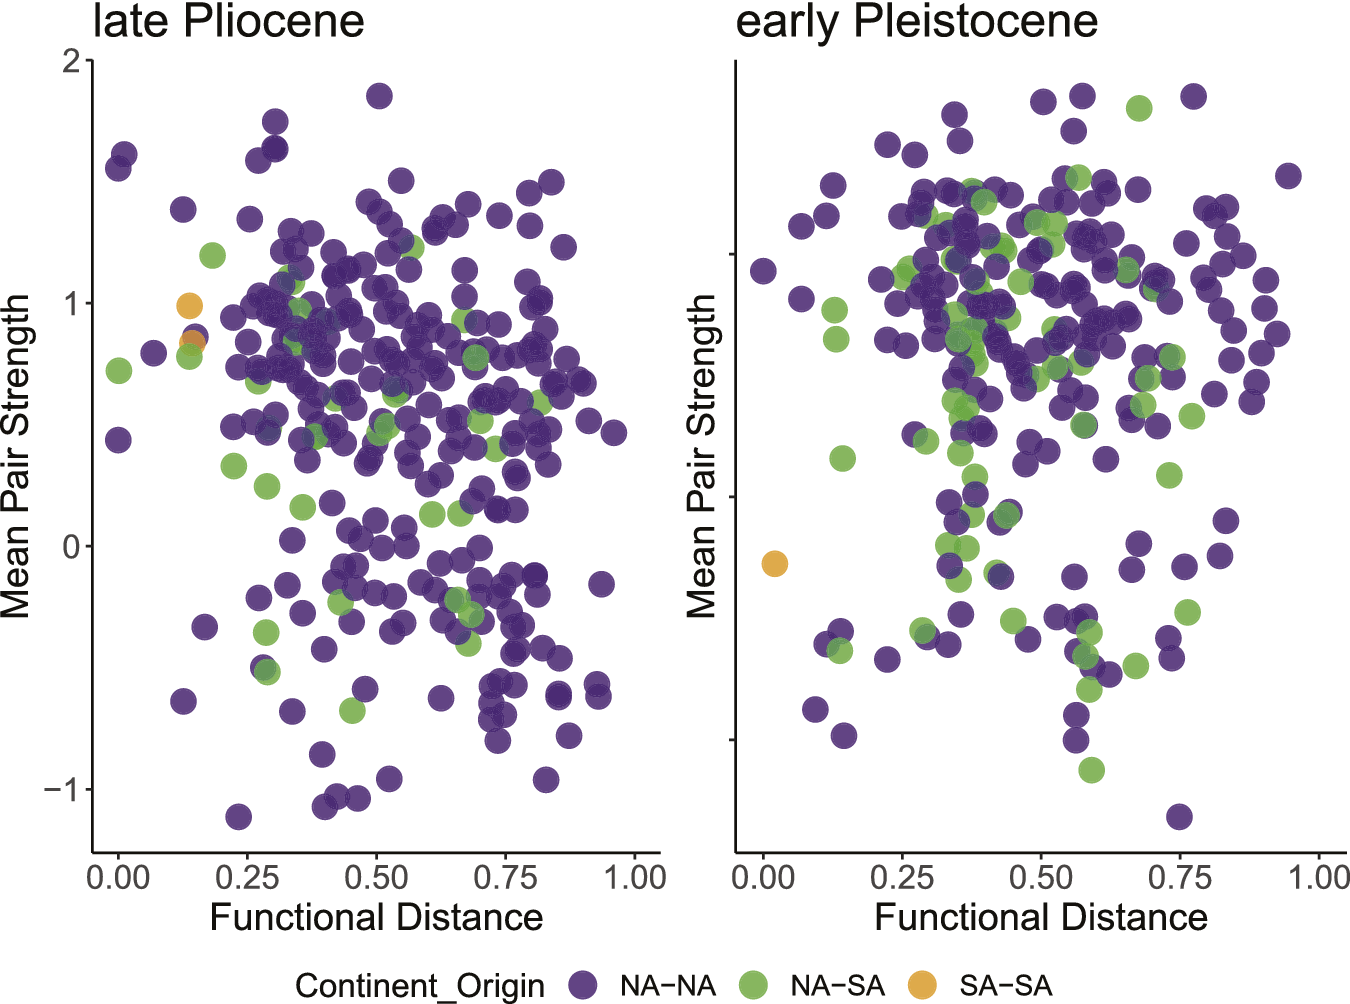
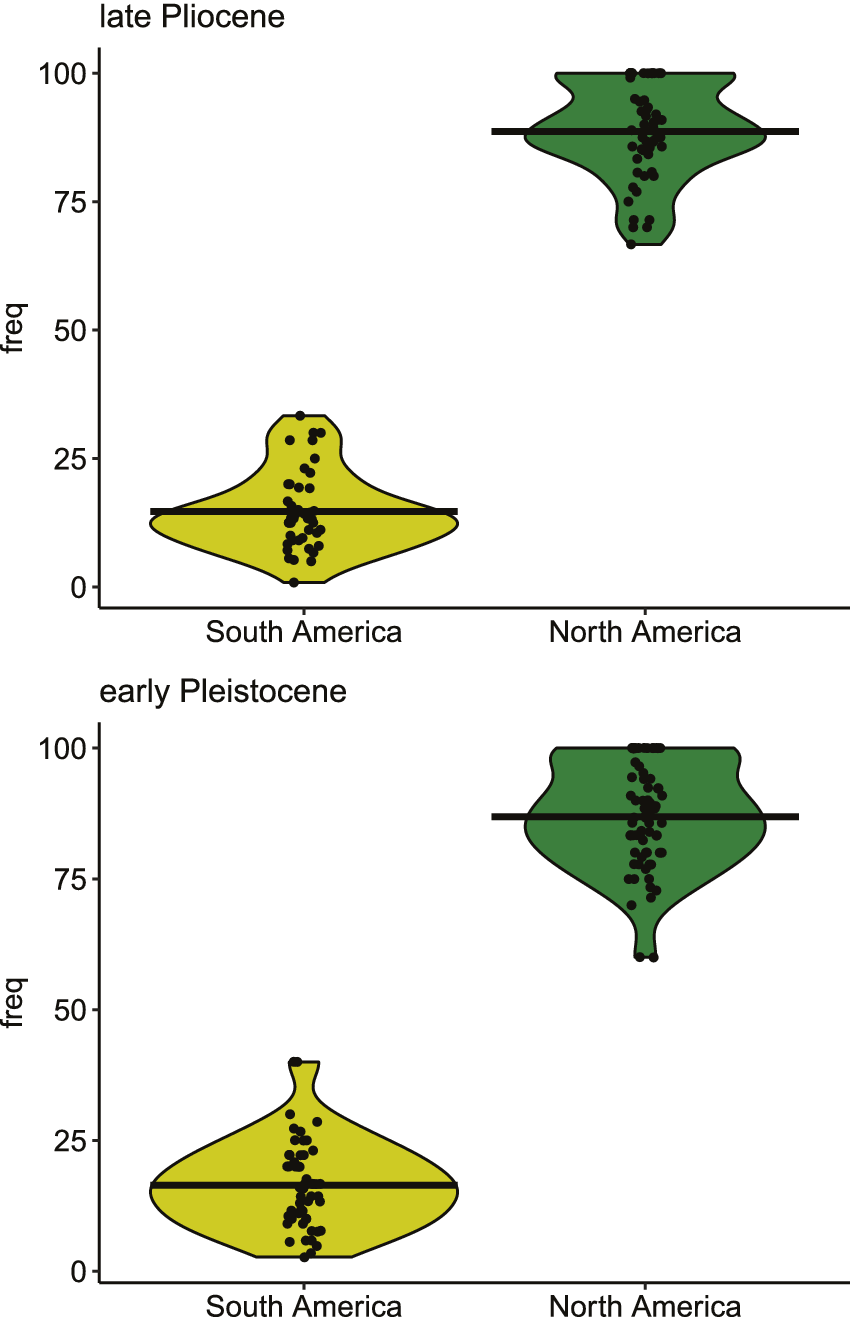
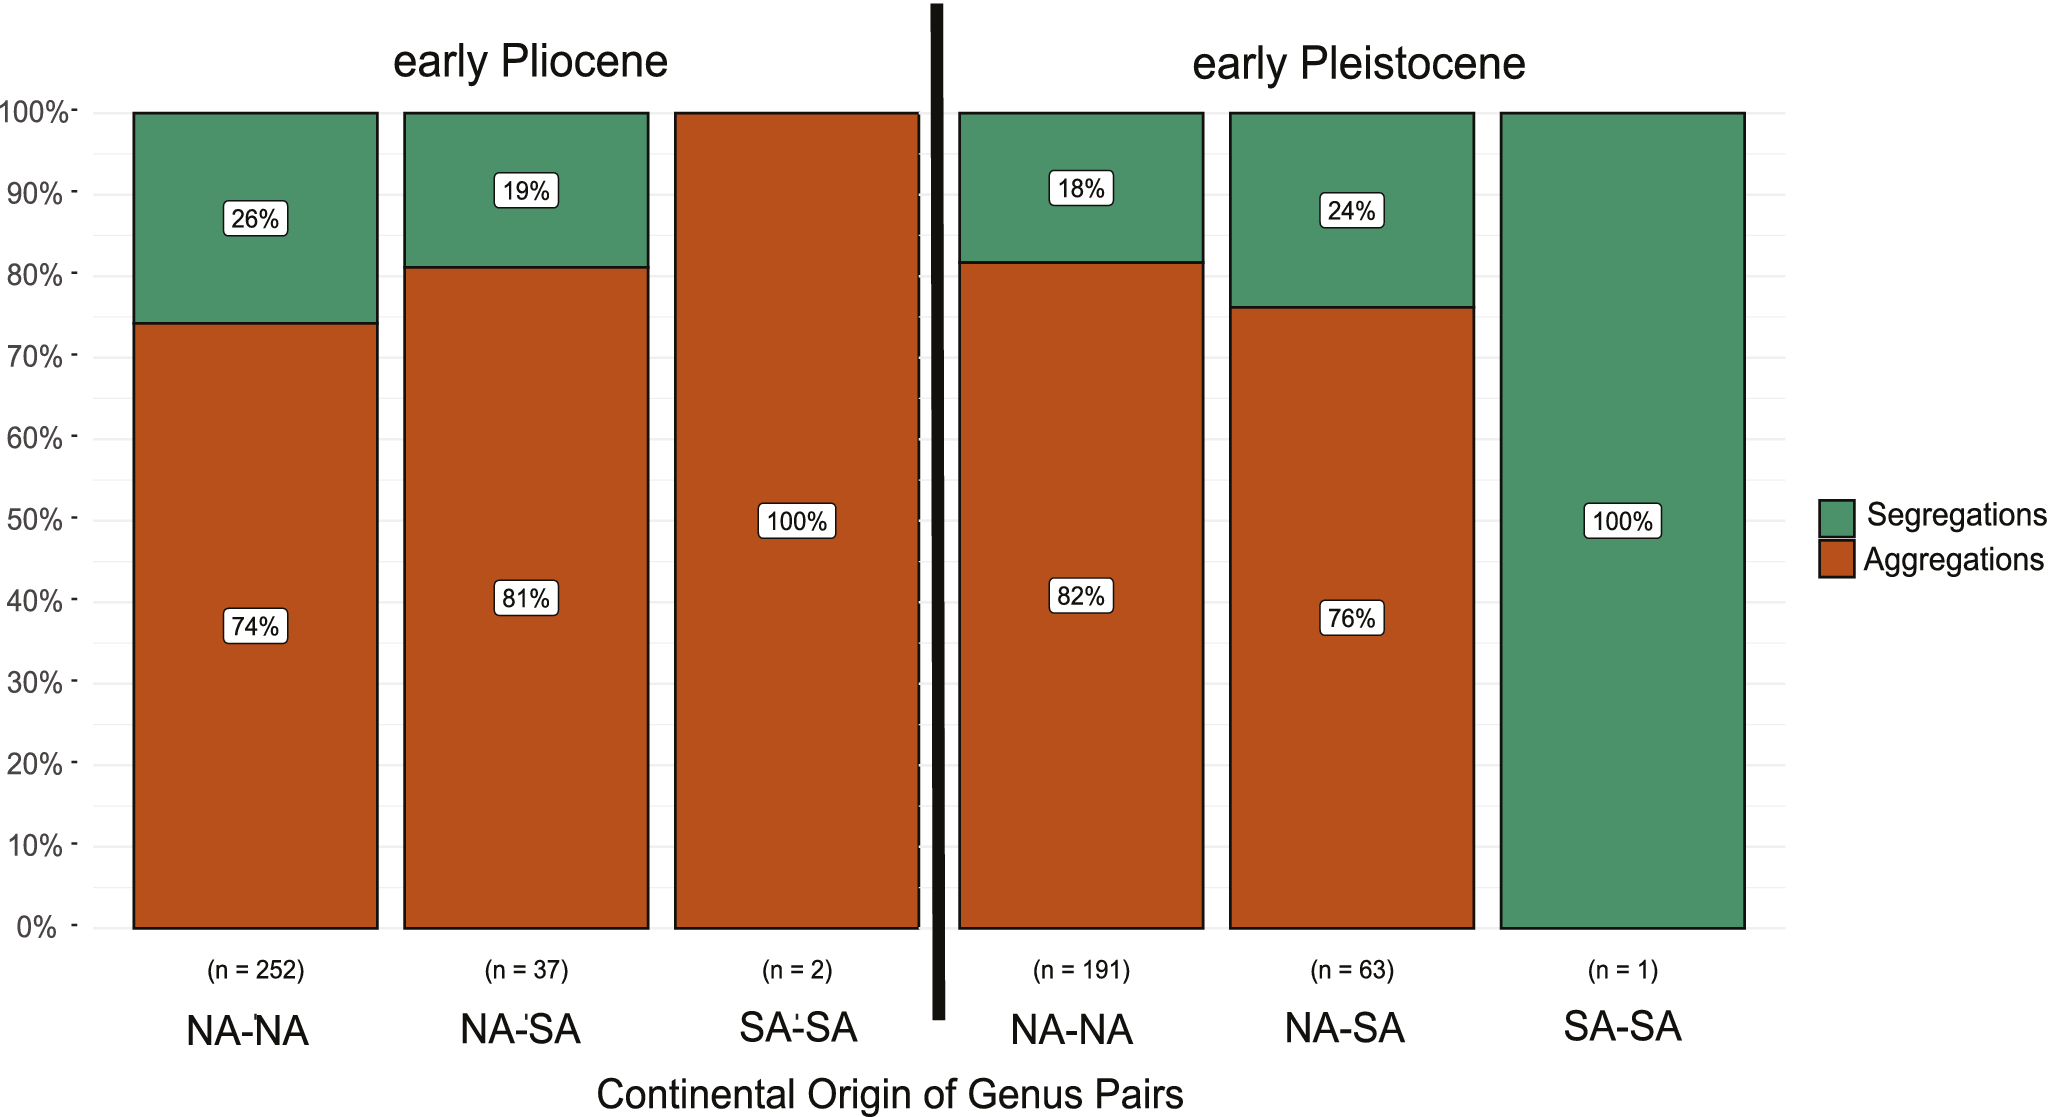
There are 37 significant pairs that include a South American genus and a North American genus (NA-SA) in the late Pliocene time bin compared with 63 of these NA-SA pairs in the early Pleistocene (Fig. 3). Meanwhile, pairs containing only North American genera (NA-NA) decrease (Pre = 252, Post = 191). South American genera form few pairs with each other (SA-SA) in either time period (Pre = 2, Post = 1). Surprisingly, the proportion of South American genera in paleocommunities does not significantly change between the late Pliocene and early Pleistocene but does increase from 16 to 23 species and 8 to 11 genera in the early Pleistocene time bin (Kolmogorov-Smirnov: p = 0.9651; Fig. 4). In addition, the NA-SA pairs that occur in the early Pleistocene are not filling in ecological space vacated by the NA-NA pairs, and these areas are less densely occupied (Fig. 3). Instead, they are spread throughout the ecological space defined by co-occurrence strength and functional distance. We also find that the proportions of segregations to aggregations do not vary between genus pairs of different continental origins or the same continental origin (Fig. 5).
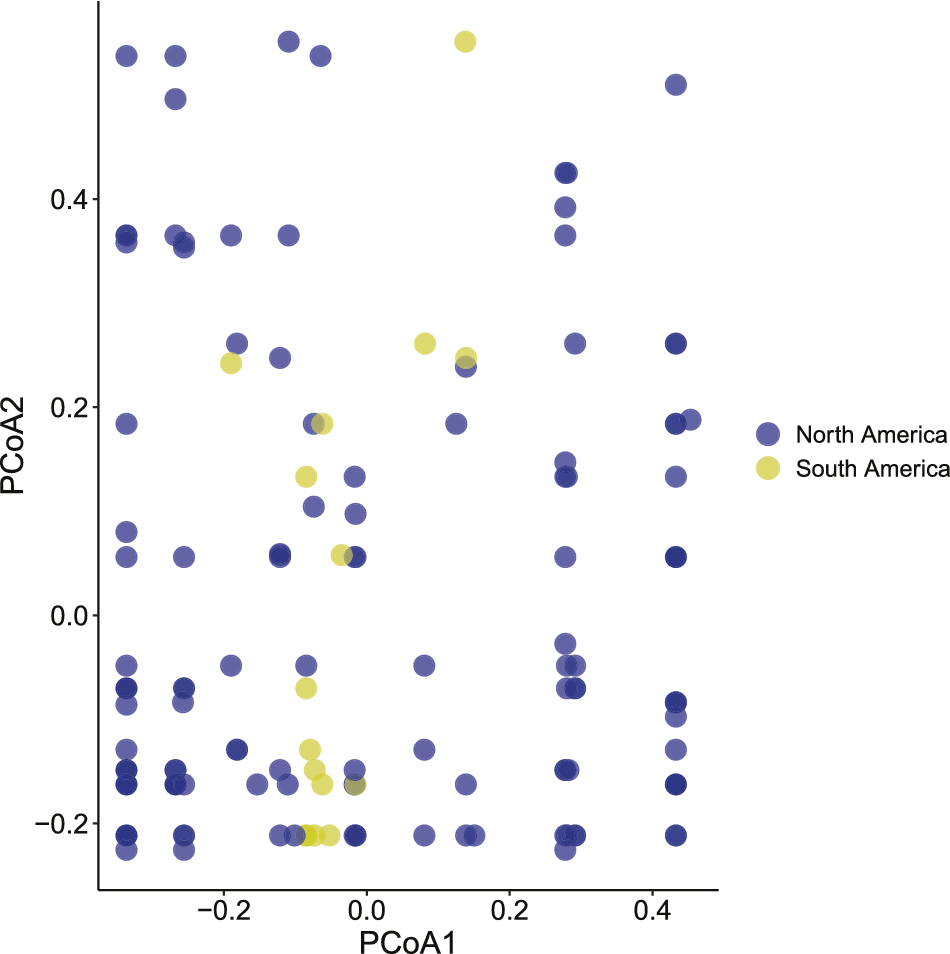
Graph showing the relationship between the mean strength of significant genera and the functional distance between them. The color of a point represents the origin of the genus. Functional distance is the Euclidean distance calculated between mammalian genera using the four principal coordinates analysis (PCoA) axes from the functional diversity analysis. NA, North America; SA, South America.

Proportion of South and North American genera within paleocommunities in the late Pliocene and early Pleistocene time bins. Each dot represents a paleocommunity. The proportion of North American genera within each community is represented in the dark green distribution. The proportion of South American genera within each community is represented in the yellow distribution.

Within North America, proportions of genus pairs forming significant associations of the same and different continental origins. There is no significant difference in the proportion of aggregations and segregations based on the continental origins forming the pairs. NA, North America; SA, South America.

Functional Roles
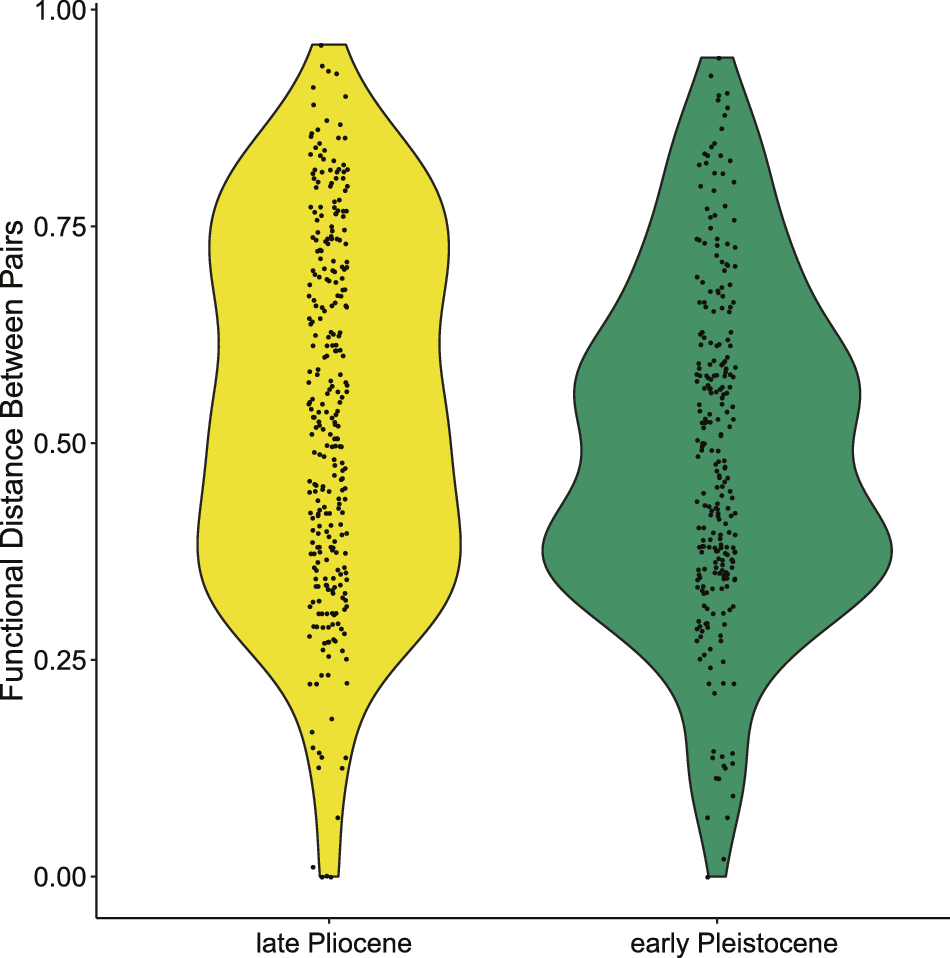
We find that the average functional distance between significant associations decreases across the Plio-Pleistocene transition (Kolmogorov-Smirnov test: p = 0.004; Fig. 6). This pattern persists even when aggregated and segregated pairs are analyzed separately (Kolmogorov-Smirnov test: aggregating p = 1.581 × 10⁷ segregating p = 0.001429). The decrease in functional distance of significant pairs is not caused by differences in the geographic distributions of the fossil localities between time bins (Kolmogorov-Smirnov test: p = 0.1063; Supplementary Figs. S1, S2). These results are also not determined by differences in community species richness distributions between each time bin (Kolmogorov-Smirnov test: p = 0.2866).
Distributions of functional distance between all significant pairs in the pre- and early Pleistocene times bins. Functional distance of the y-axis is found by calculating the Euclidean distance between significant genus pairs in multidimensional trait space. The violin plot widens with a greater number of genus pairs and thins with fewer pairs.

To further investigate the change in functional distance we found in significant pairs, we compared frequency distributions of traits within paleocommunities between the late Pliocene and early Pleistocene using all mammalian genera, not just the genera forming significant pairs. We identified changes in trait category frequency distributions within paleocommunities between the late Pliocene and early Pleistocene. We found that frequency distributions of locomotion, diet, life habit, and body-mass category change significantly (Kolmogorov-Smirnov test p-values: locomotion = 6.97 × 10⁸, diet = 8.408 × 10⁹, body mass = 0.0078, life habit = 1.425 × 10¹⁰). Moreover, when all functional trait frequencies are combined for paleocommunities, there is also a significant change (Kolmogorov-Smirnov test: p = 2.2 × 10¹⁶.
South American versus North American Functional Roles
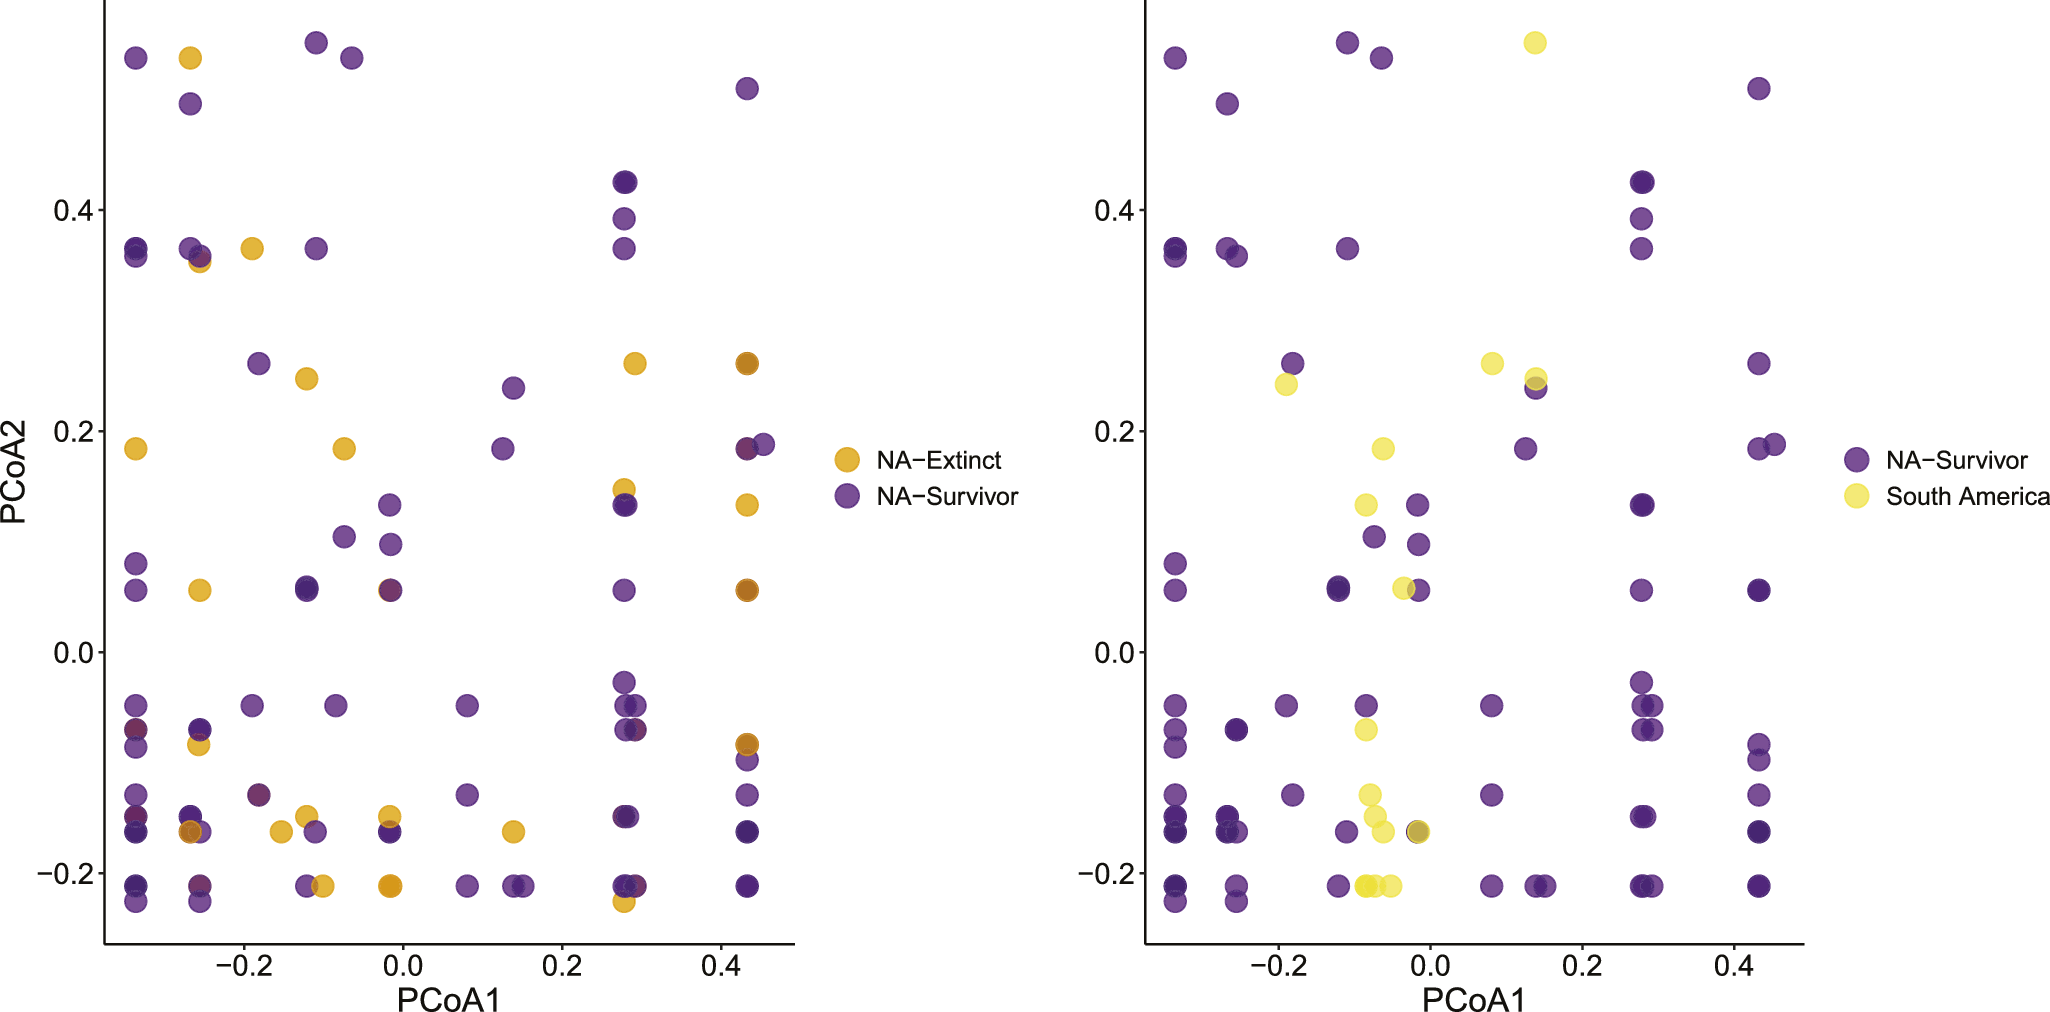
The diversity of South American functional types is much lower than that of North American functional types (Fig. 7), with South American mammals occupying the center of functional space, whereas North American genera have a greater abundance along the outside (Fig. 7). This pattern is more obvious when South American genera are only plotted with North American survivors (Fig. 8). However, the extinct North American genera occupy similar functional extent as the surviving genera (Fig. 8). There are no extinct South American genera that form significant associations. Most South American genera aggregate with carnivores, mixed feeders, or other browsers. The number of aggregations formed by browsers increases in the early Pleistocene (Supplementary Fig. S3). Moreover, body-size categories of significantly pairing genera change over time (Supplementary Figs. S4–S10). NA-SA pairs show an increase in associations between large- and medium-sized genera, as well as associations between large-bodied genera across the transition. In contrast, NA-NA pairs between medium- and large-sized mammals and between large-bodied genera decline in abundance following the Plio-Pleistocene transition.
Distribution of North and South American genera in multidimensional space based on functional diversity principal coordinates analysis (PCoA) axes. South American migrants are primarily concentrated in the lower to mid-region of trait space with few overlapping North American genera.

Left, Ordination of extinct and surviving North American genera in functional space using the first two principal coordinates analysis (PCoA) axes. Right, Ordination of surviving North American genera and South American immigrants in functional space using the first two PCoA axes. South American migrants are primarily concentrated in the lower- to mid-region of trait space with few overlapping North American genera.

Discussion
Amid the onset of a major climate transition (Bartoli et al. Reference Bartoli, Sarnthein, Weinelt, Erlenkeuser, Garbe-Schönberg and Lea2005; Bacon et al. Reference Bacon, Molnar, Antonelli, Crawford, Montes and Vallejo-Pareja2016; Yi et al. Reference Yi, Medina-Elizalde, Tan, Kemp, Li, Kletetschka and Xie2023) and the escalation of the GABI (Webb Reference Webb1976; Woodburne Reference Woodburne2010; Bacon et al. Reference Bacon, Molnar, Antonelli, Crawford, Montes and Vallejo-Pareja2016), western North American mammal paleocommunities experience major ecological disturbance, yet community structure remains stable regarding genus associations. We find no difference in the proportion of aggregated and segregated genus pairs across the Plio-Pleistocene transition, and no significant differences in the strengths of the associations (Figs. 2, 5). Our results are consistent with several recent studies that demonstrated community resiliency across major ecological and environmental change. Specifically, previous studies have shown that co-occurrence structure over evolutionary timescales is consistent across periods of climate change and mass extinctions unless humans are part of the ecosystem (Lyons et al. Reference Lyons, Amatangelo, Behrensmeyer, Bercovici, Blois, Davis and DiMichele2016; Tóth et al. Reference Tóth, Lyons, Barr, Behrensmeyer, Blois, Bobe and Davis2019). Indeed, plant and mammalian communities primarily form aggregations rather than segregations for approximately 300 Ma until the Holocene (Lyons et al. Reference Lyons, Amatangelo, Behrensmeyer, Bercovici, Blois, Davis and DiMichele2016). In our study, western North American mammals shifted their distributions in response to climate change and the invasion of new species, forming new associations. Furthermore, they were able to maintain co-occurrence structure despite the formation of non-analogue habitats (Fig. 2). The individualistic responses to glaciation by vegetative species led to non-analogue habitats with the expansion and retraction of their geographic ranges (Jackson and Overpeck Reference Jackson and Overpeck2000; Williams and Jackson Reference Williams and Jackson2007). Thus, even with new members, different climatic gradients, and formation of non-analogue habitats due to glaciation (Jackson and Overpeck Reference Jackson and Overpeck2000; Williams and Jackson Reference Williams and Jackson2007), mammalian genera still formed the same types of associations in similar proportions (Figs. 2, 5). Our study, among others, may suggest that mammals may have a fundamental way of assembling that is maintained across intervals of climatic, ecological, and environmental shifts in the absence of human perturbations (Lyons et al. Reference Lyons, Amatangelo, Behrensmeyer, Bercovici, Blois, Davis and DiMichele2016; Tóth et al. Reference Tóth, Lyons, Barr, Behrensmeyer, Blois, Bobe and Davis2019; Cooke et al. Reference Cooke, Gearty, Chapman, Dunic, Edgar, Lefcheck and Rilov2022).
Mammals of South American origin displayed the same co-occurrence structure found in North American mammals, further supporting the idea that mammals have a fundamental way of assembling (Fig. 5). Despite being from a continent that was isolated for millions of years, the mammals still form the same proportion of aggregations and segregations as their North American counterparts (Fig. 5). An increasing number of significant pairs including South American genera following the Plio-Pleistocene transition did not change the proportion of aggregated to segregated pairs. The increase in South American associations in the early Pleistocene is likely due to a heightened rate of migration between continents at ~3–2.5 Ma triggered by the closing of the Isthmus of Panama (Fig. 3; Schmidt Reference Schmidt, Williams, Haywood, Gregory and Schmidt2007; O’Dea et al. Reference O’Dea, Lessios, Coates, Eytan, Restrepo-Moreno, Cione and Collins2016; Huguet et al. Reference Huguet, Jaeschke and Rethemeyer2022). Before this period, few South American genera had reached western North America and were a smaller percentage of the North American communities (Woodburne Reference Woodburne2010). However, it is unclear if South American genus co-occurrence structure shows a similar pattern because these genera are primarily paired with North American genera. Future studies are needed to determine whether paleocommunities of primarily South American genera would result in a similar community structure.
The success of some South American mammals infiltrating the North American fauna may be because they concentrate in an area of trait space underutilized by North American genera, who more densely occupy the outside of trait space (Fig. 7). The insinuation of South American genera into niche space is at least partially responsible for the shorter functional distances among associating genera following the glaciation event, as many of the South American genera were taxonomically and functionally unique (Marshall et al. Reference Marshall, Webb, Sepkoski and Raup1982), for instance, the large, browsing, plantigrade clade of ground sloths. Ground sloths form more significant pairs with North American genera than any other South American clade. Multiple genera of ground sloths migrated into North America millions of years before the closing of the isthmus, providing time for them to form ecological relationships and even evolve species endemic to North America (Webb Reference Webb1976; Woodburne Reference Woodburne2010). Furthermore, Glyptotherium (glyptodonts) and Erethizon (porcupines) also form a large number of significant pairs with North American genera following the glaciation event. Both genera commonly form segregations with grazing mammals such as horses, camels, and mammoths and aggregations with mixed feeders and other browsing mammals. Ground sloths, glyptodonts, and porcupines have a strong presence in early Pleistocene paleocommunities, likely reflecting their ecological success (Datafile1). Glyptodonts and ground sloths survive until the megafaunal extinction, when many large-bodied mammals go extinct (McDonald Reference McDonald2021; Carlini et al. Reference Carlini, Carrillo-Briceño, Jaimes, Aguilera, Zurita, Iriarte and Sánchez-Villagra2022). Porcupines survive this extinction and remain a common mammal in the North American fauna today (Ahlberg Reference Ahlberg1969). Due to the uniqueness of their functionality, there does not appear to be a similarity between the types of North American genera that stop forming pairs and the South American genera that begin building strong associations.
Extinct North American genera display a wide variety of functional roles. In fact, their distribution in functional space is similar to that of surviving genera (Fig. 8). Furthermore, the extinct genera, like surviving genera, do not overlap with South American functional roles, suggesting that any turnover in North American genera was not likely driven by competition with South American immigrants (Fig. 8). However, the landscape is thought to have opened up, with a spread of drier savanna-like habitats with the onset of glaciation (Morgan and Emslie Reference Morgan and Emslie2010). For example, Borophagus and Buisnictis were two North American genera that had a strong presence pre-glaciation, but quickly diminished following the Plio-Pleistocene transition. Borophagus was a genus of canid with robust limbs thought to specialize at ambush hunting in closed habitats (Bōgner and Samuels Reference Bōgner and Samuels2022). Buisnictis is a medium-sized transitional genus of skunk that gave rise to modern skunks (Wang et al. Reference Wang, Carranza-Castañeda and Aranda-Gómez2014). Based on inferences about the habitat preferences of many of the extinct genera, it is possible that many closed-habitat mammals eventually went extinct due to the opening of the landscape. Nevertheless, more quantitative assessment is needed on this topic, and acquiring evidence of habitat preferences for individual genera is outside the scope of this paper.
Ecological theory predicts that factors such as invasion and climate change have large effects on community structure (Lomolino Reference Lomolino1986; Robinson and Dickerson Reference Robinson and Dickerson1987; Schwindt et al. Reference Schwindt, Bortolus and Iribarne2001; Spooner and Vaughn Reference Spooner and Vaughn2008; Smith et al. Reference Smith, Tomé, Smith, Lyons, Newsome and Stafford2016; Tóth et al. Reference Tóth, Lyons, Barr, Behrensmeyer, Blois, Bobe and Davis2019). For example, the composition of Swedish bird communities has changed rapidly in response to varying summer temperatures since the 1960s (Lindström et al. Reference Lindström, Green, Paulson, Smith and Devictor2013). Similarly, the recent invasion of European house sparrows into west Mexico led to a significant decrease in richness but increased bird abundances, resulting in a dramatic difference between invaded and non-invaded bird communities (MacGregor-Fors et al. Reference MacGregor-Fors, Morales-Pérez, Quesada and Schondube2010). Interestingly, many studies examining changes in community structure using the fossil record before human impacts do not find significant changes in response to these factors (Rodrı́guez Reference Rodrı́guez2004; Lyons et al. Reference Lyons, Amatangelo, Behrensmeyer, Bercovici, Blois, Davis and DiMichele2016; Fraser and Lyons Reference Fraser and Lyons2020). For instance, the immigration of three new orders of mammals from Asia around ~56 Ma and a rapid warming event did not result in community structure changes (Fraser and Lyons Reference Fraser and Lyons2020). These major environmental and ecological events in the fossil record have been explored at various temporal grades. Although our study, like many paleoecological projects, works at a large temporal grade, those using shorter timescales (e.g., 1000 years or fewer) (Bercovici et al. Reference Bercovici, Vajda, Pearson, Villanueva-Amadoz and Kline2012; Wing et al. Reference Wing, Strömberg, Hickey, Tiver, Willis, Burnham and Behrensmeyer2012; Lyons et al. Reference Lyons, Amatangelo, Behrensmeyer, Bercovici, Blois, Davis and DiMichele2016) also find structural consistency across major events (Lyons et al. Reference Lyons, Amatangelo, Behrensmeyer, Bercovici, Blois, Davis and DiMichele2016). When looking at co-occurrence structure specifically, there is no relationship between the temporal grade of the data and the proportion of aggregated to segregated pairs (Lyons et al. Reference Lyons, Amatangelo, Behrensmeyer, Bercovici, Blois, Davis and DiMichele2016). Furthermore, taphonomic biases that vary over space and time favor the fossilization of different habitats, body types, and sizes. Regardless, paleoecological studies working in different time periods and geographic regions still find consistency in community structure across major transitional events except for the climate shifts and extinctions that occur at the terminal Pleistocene to early Holocene (Lyons et al. Reference Lyons, Amatangelo, Behrensmeyer, Bercovici, Blois, Davis and DiMichele2016; Tóth et al. Reference Tóth, Lyons, Barr, Behrensmeyer, Blois, Bobe and Davis2019; Cooke et al. Reference Cooke, Gearty, Chapman, Dunic, Edgar, Lefcheck and Rilov2022). The onset of glaciation in the terminal Pleistocene led to non-analogue habitats due to range shifts in plants, drastically altering the landscape (Blinnikov et al. Reference Blinnikov, Busacca and Whitlock2002; Williams and Jackson Reference Williams and Jackson2007; Yang et al. Reference Yang, Wu, Liu, Zhang, Zhang and Wan2011). This suggests that the glaciation at the Plio-Pleistocene transition should have led to similar environmental changes and, ultimately, similar impacts on mammalian communities. Nevertheless, community structure is not significantly altered at the Plio-Pleistocene transition. This difference is likely not driven by taphonomic biases or different temporal grades, but rather is caused by the presence of humans during the terminal Pleistocene.
Conclusion
The closing of the Isthmus of Panama contributes to a number of ecological, environmental, and climatic events that alters the composition of western North American mammal communities. South American mammals increase their rate of migration across the land bridge with some genera successfully joining the North American fauna and filling an area of niche space with low occupancy and redundancy. Moreover, a shift in climate results in extensive glaciation in the Northern Hemisphere, altering the landscape and forcing range shifts. Fascinatingly, these events do not lead to a reorganization in community structure. While the continental origin and ecological roles of the genera forming strong associations are different, the types of associations remain the same (Figs. 2, 3). This suggests that mammalian communities can remain stable across periods of major environmental, ecological, and climatic changes without human disturbance. The deep, evolutionary timeline exhibiting these consistent mammalian community patterns across major transitions is evidence for the importance of preserving natural mechanisms.
Acknowledgments
Support for this research was provided by NSF-DEB 1257625 (SKL, AKB, NG) and 2051255 (SKL, SAFD, CVL, PJW). This is E6 (Ecological and Evolutionary Effects of Extinction and Ecosystem Engineers RCN) publication no. 12, Evolution of Terrestrial Ecosystems Program publication no. 414, and PBDB publication 505.
Competing Interests
The authors declare that they have no competing interests.
Data Availability Statement
All data are available in the main text or in the Supplementary Material, the code, and the data, which are also deposited on Dryad at: https://doi.org/10.5061/dryad.kprr4xhf7.

 Open access