


Introduction
Wisconsin began producing industrial hemp (hereinafter referred to as hemp) for research purposes in 1908 (Wright Reference Wright1918), became the leading U.S. producer in 1920, and remained so until 1957 (LeCloux Reference LeCloux2019). Following decades of strict regulation and the prohibition of hemp research and production due to the 1970 Controlled Substances Act, the Agricultural Act of 2014 and the Agriculture Improvement Act of 2018 have made it once again legal to produce hemp in the United States (Agricultural Act of 2014; Agricultural Improvement Act of 2018; Johnson Reference Johnson2014; Schluttenhofer and Yuan Reference Schluttenhofer and Yuan2017, Reference Schluttenhofer and Yuan2019). Hemp has regained interest as a high-value commodity in the United States, which has led to a substantial rise in hemp production (Cherney and Small Reference Cherney and Small2016). After the passing of a state statute in 2018 allowing hemp to be grown under a pilot program, the state of Wisconsin licensed the production of 758 ha in 2018, 1,826 ha in 2019, and 2,203 ha in 2020 (F. Hagerty, personal communication). Before the prohibition of hemp in 1970, many states produced hemp for its strong and long fiber as a common component of ropes, canvases, and paper (Johnson Reference Johnson2014; Karus and Vogt Reference Karus and Vogt2004; Small and Marcus Reference Small and Marcus2002). Hemp grain has become a common ingredient of cosmetic and food products (Small and Marcus Reference Small and Marcus2002). Although interest continues to rise, the lack of research on the production of hemp is a barrier to growers. Moreover, best management practices for weed control have not been established.
Weed management is an important aspect of crop production; however, it is understudied in hemp (Sandler et al. Reference Sandler, Beckerman, Whitford and Gibson2019). Although it is assumed that hemp can outcompete weeds due to quick canopy closure (Ehrensing Reference Ehrensing1998; Cherney and Small Reference Cherney and Small2016), hemp is typically planted later than other row crops in Wisconsin (i.e., corn and soybean), allowing early-season weeds to establish prior to planting (Doll Reference Doll2001). This offers an opportunity for weed control preplant with tillage or herbicide burndown. Previously, research conducted in hemp has identified effective weed management to be necessary to ensure adequate yields (Cole and Zurbo Reference Cole and Zurbo2008; Sandler et al. Reference Sandler, Beckerman, Whitford and Gibson2019; Schluttenhofer and Yuan Reference Schluttenhofer and Yuan2017). Some have observed losses of entire research plots due to weed infestations (Hooks Reference Hooks2018). Mechanical and cultural weed control techniques could be viable options in some production systems and should be further investigated (Sandler et al. Reference Sandler, Beckerman, Whitford and Gibson2019). Yield and overall crop quality loss due to weed pressure have been documented in many crops (Lembi and Ross Reference Lembi and Ross1985) but have not been quantified in hemp. Years when weeds go unmanaged can lead to large additions to the weed seed bank in the soil, and preventing additions to the seed bank is often the first and most critical step in weed management (Buhler et al. Reference Buhler, Hartzler and Forcella1997; Cousens and Mortimer Reference Cousens and Mortimer1995; Dekker Reference Dekker1999; Hossain and Begum Reference Hossain and Begum2015). A single weedy year can often set growers back several years in weed management (Gallandt Reference Gallandt2006).
Chemical control is the most used form of weed management in conventional crop production in modern agriculture (Harker and O’Donovan Reference Harker and O’Donovan2013). While the U.S. Environmental Protection Agency (EPA) and state departments of agriculture have approved short lists of fungicides and insecticides for use in hemp, no registered synthetic herbicides are currently available (U.S. EPA 2021). The use of acetochlor (site of action [SOA] Group 15), metolachlor (SOA 15), and pendimethalin (SOA 3) in hemp is registered in China (Amaducci et al. Reference Amaducci, Scordia, Liu, Zhang, Guo, Testa and Cosentino2015), while ethalfluralin (SOA 3) and quizalofop-p-ethyl (SOA 1) are registered for hemp in Canada. Few preliminary studies outline hemp’s tolerance to herbicides in the United States (Flessner et al. Reference Flessner, Bryd, Bamber and Fike2020; Johnson and Willenborg Reference Johnson and Willenborg2018; Maxwell Reference Maxwell2016; Sosnoskie and Maloney Reference Sosnoskie and Maloney2021). Although this research provides some insight to hemp’s relative sensitivity to a wide range of herbicides, all previous trials were completed at one or two different rates for each active ingredient. Currently no research documents how hemp cultivars may respond to a range of doses of commonly used herbicides.
The lack of information on hemp’s response to herbicides is concerning for growers producing hemp. Owing to widespread use of arable land for agricultural production in the United States, hemp may be grown in fields that have previously had herbicides applied, and herbicide carryover is a concern. Moreover, owing to federal regulations restricting research on hemp, it often is not listed on herbicide rotation restrictions and thus must fall under “other crops” (Arneson et al. Reference Arneson, Wang and Werle2019), leading to the maximum plant-back restriction intervals. Hemp produced in regions that produce other crops, such as corn and soybean, may be at risk of injury from herbicide drift given the reliance on chemical weed control in these systems. The increase in number of hemp hectares paired with very little information on herbicide use in hemp production warrants more investigation of hemp’s response to PRE and POST herbicide applications.
The objective of this research was to investigate the tolerance of two grain hemp cultivars to herbicides commonly used PRE and POST in corn and soybean production. The hypotheses were that (1) both hemp cultivars would be highly sensitive to the herbicides evaluated and (2) both hemp cultivars would exhibit increased sensitivity with increasing herbicide dose. The results of this study may guide future research into the viability of registering herbicides for use in hemp. These results will also be useful in supporting recommendations for hemp as a rotational crop (i.e., carryover concerns for herbicides with soil residual activity) and sensitivity to herbicide drift (i.e., exposure to low rates of herbicides with foliar activity).
Materials and Methods
Plant Material and Growing Conditions
Dose–response experiments were conducted from July through November 2019 to investigate tolerance of two dioecious grain hemp cultivars to PRE and POST herbicides commonly used with corn and soybean (Table 1). Experiments were conducted at the Walnut Street Greenhouse (43.075240°N, −89.423440°W), University of Wisconsin–Madison, Madison, WI. The two cultivars evaluated were X-59 (Legacy Hemp LLC, Prescott, WI, USA) and CRS-1 (Hemp Genetics International, Saskatoon, SK, Canada). Owing to limited availability, these dioecious cultivars were selected because of their suitability for production in the U.S. upper Midwest (B. Parr, personal communication). Greenhouse conditions were set to a 16-h photoperiod using high-pressure sodium lights (650 to 670 nm; Sun Systems, Vancouver, WA, USA) and maintained at diurnal/nocturnal air temperatures of 28/20 C. Environmental conditions were monitored for the duration of the experiments with a WatchDog® A150 logger (Spectrum Technologies, Aurora, IL, USA).
Treatments evaluated in dose–response experiments including active ingredient, site of action number, 1× rate, manufacturer, location, and if it was preemergence and/or postemergence applied. a, b
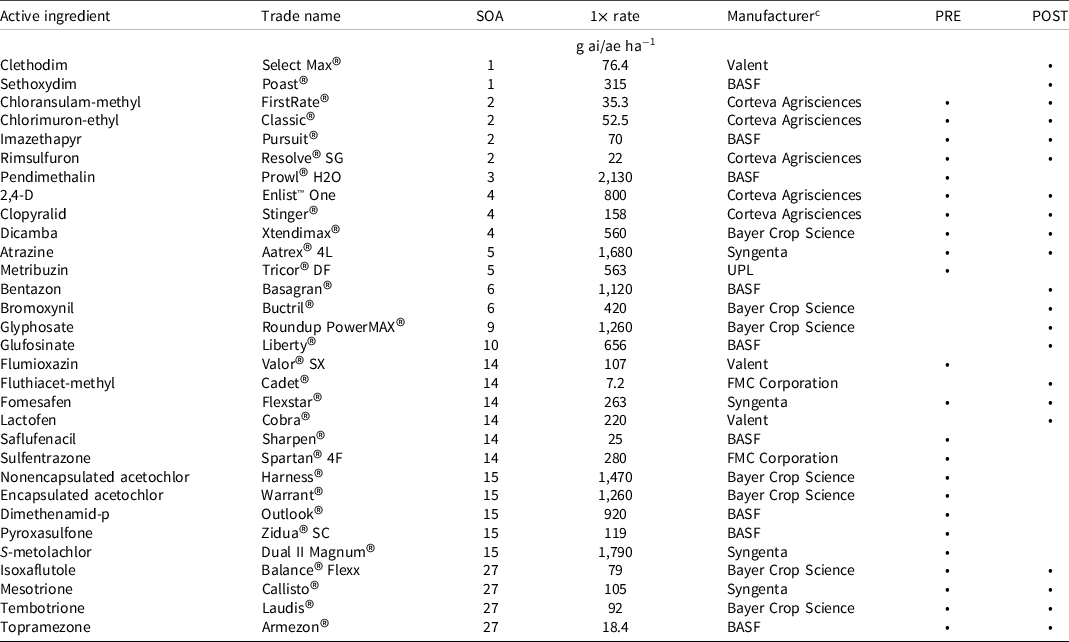
a Abbreviations: ae, acid equivalent; ai, active ingredient; SOA, site of action.
b Herbicides are listed by site of action number.
c Manufacturer locations: BASF, Durham, NC; Bayer Crop Science, St. Louis, MO; Corteva Agrisciences, Indianapolis, IN; FMC Corporation, Philadelphia, PA; Syngenta, Greensboro, NC; UPL, King of Prussia, PA; Valent, Walnut Creek, CA.
Experimental units for preemergence-applied herbicides consisted of 606 cm3 square pots (HC Companies, Twinsburg, OH, USA) filled with field soil (silt loam soil [21% sand, 57% silt, 22% clay], 2.6% organic matter, and pH of 6.9). Soil originated from the West Madison Agricultural Research Station (43.060482°N, −89.531853°W) and was selected as a representative soil type of Wisconsin’s agricultural landscape. Six hemp seeds were planted in each pot at 1.3 cm depth, simulating a planting density of 34 kg ha−1, within 12 h before spraying to avoid germination prior to PRE herbicide application. Immediately before spraying, pots were watered until saturated to ensure activation of the PRE herbicides and then watered daily to field capacity.
Experimental units for postemergence-applied herbicides consisted of 656 cm3 pots (Stuewe and Sons Inc., Tangent, OR, USA) filled with Mycorrhizae BX potting mix (79% to 87% sphagnum peat moss, 10% to 14% vermiculite; Pro-Mix®, Quakertown, PA, USA). Cones were watered to saturation and then planted with six seeds at 1.25-cm depth and thinned to 1 plant per cone within 48 h prior to herbicide application. Cones were watered to field capacity daily and fertilized weekly (Peters 20-10-20 Peat-Lite Special; ICL Specialty Fertilizers, Summerville, SC, USA) until herbicide application. After treatment, cones were watered daily.
Experiment Background and Design
Treatments consisted of 23 PRE and 21 POST herbicides applied at seven rates (0.125×, 0.25×, 0.5×, 0.75×, 1×, 2×, and 4×) plus a nontreated control (NTC), totaling 161 PRE and 154 POST treatments (Table 1). The 1× rate herein was extrapolated from the respective product label recommendations for maximum labeled rate for corn or soybean (and based on a silt loam soil for PRE treatments). Experiments were conducted in a completely randomized design with three replications and were repeated twice in time.
Herbicide Application
All herbicide applications, except for the synthetic auxins (SOA 4), were made with a single-nozzle research track sprayer (DeVries Manufacturing Inc., Hollandale, MN, USA) equipped with an A19502EVS (TeeJet® Technologies, Wheaton, IL, USA) nozzle calibrated to deliver 140 L ha−1 at 275 kPa at a speed of 3.9 km h−1. Experimental units were positioned 38 cm below the nozzle, and treatment applications were made sequentially. Adjuvants were not used for POST applications to allow PRE and POST applications to be made simultaneously. SOA 4 (dicamba, clopyralid, and 2,4-D) herbicides were sprayed at an off-site location using a CO2-pressurized backpack sprayer with a 2-m handheld spray boom with TTI110015 (TeeJet® Technologies) nozzles at 50.8-cm spacing. The sprayer was calibrated to deliver 140 L ha−1 carrier volume at 275 kPa at a walking speed of 4.8 km h−1. Herbicide applications for PRE-applied herbicides were made within 24 h after planting, and POST applications were made when hemp plants reached 5 to 10 cm in height.
At 28 days after treatment (DAT), plants within each pot in the PRE experiment were enumerated and recorded, and aboveground biomass was harvested. At 21 DAT, aboveground biomass was harvested for all experimental units within the POST experiment. All biomass was forced-air-dried at 52 C until constant weight before weighing. Biomass data are reported as percent biomass reduction and were calculated as
 $$\% \,{\rm{biomass}}\,{\rm{reduction}} = [({\rm{NTC}} - B)/{\rm{NTC}}]*100$$
where NTC is the mean biomass (g) of the nontreated control for each respective cultivar and B is the biomass (g) of the experimental unit of interest.
Statistical Analyses
Dose–response curves were generated for percent biomass reduction to each hemp cultivar within herbicides in R statistical software (R Development Core Team 2021) using the drc (Ritz et al. Reference Ritz, Baty, Streibig and Gerhard2015) package. Data from the two experimental runs were combined (i.e., replications and experimental runs considered as random effects). The model selection function mselect tool was used to compare models, and the three-parameter log-logistic function was selected as the best-fit model based on Akaike’s information criterion (data not shown). In the three-parameter log-logistic function, the lower limit was set to 0 and the upper limit to 100, as biomass reduction cannot be greater than 100%. The response of the hemp cultivars was compared within each herbicide treatment through the variance ratio or F-test using the following equation (Lindquist et al. Reference Lindquist, Mortenson, Clay, Schmenk, Howatt and Westra1996; Oliveira et al. Reference Oliveira, Pereira, Ferreira, Santos, Knezevik and Werle2018):
 $${\rm{variance}}\,{\rm{rati}}{{\rm{o}}_i} = \left[ {\left( {{\rm{RS}}{{\rm{S}}_i} - {\rm{RS}}{{\rm{S}}_{\rm{l}}}} \right)/\left( {{\rm{d}}{{\rm{f}}_i} - {\rm{d}}{{\rm{f}}_{\rm{l}}}} \right)} \right]/\left( {{\rm{RS}}{{\rm{S}}_{\rm{l}}}/{\rm{d}}{{\rm{f}}_{\rm{l}}}} \right)$$
where RSS i represents the minimized residual sum squares of the reduced model, RSS1 represents the minimized residual sum squares of the full model, df i represents the degrees of freedom of the reduced model, and df1 represents the degrees of freedom of the full model. For each herbicide, two nested models were fitted: a full model with separated values for each hemp cultivar and a reduced model with pooled values of two hemp cultivars. The F-test was performed with the anova function from the drc package; if the P-value of the F-test is greater than 0.05, we fail to reject the null hypothesis, and a reduced model should be used (e.g., one model for both cultivars); otherwise, model parameters for each cultivar were estimated indicating differential cultivar response within a particular herbicide treatment (Oliveira et al. Reference Oliveira, Pereira, Ferreira, Santos, Knezevik and Werle2018).
The absolute effective doses (EDs) to achieve 10%, 50%, and 90% biomass reduction were estimated from the dose–response curves using the ED function in the drc package. The percent biomass reduction that occurred when the 0.125× and 1× rates of each herbicide were applied to each cultivar were estimated using the predict model function of the drc package.
Results and Discussion
Preemergence Herbicides
Greater than 75% biomass reduction was observed for most herbicides, even at the lowest rates evaluated (Figures 1 and 2). Dose–response models could not be fitted (i.e., failed to converge) to the results for rimsulfuron (SOA 2), encapsulated acetochlor (SOA 15), and mesotrione (SOA 27) due to significant biomass reduction (>65%) at the lowest rate evaluated (0.125×; data not shown). Mesotrione has previously been reported as being significantly injurious to hemp, causing between 88% and 95% phytotoxicity 28 DAT at a rate of 0.39 L ha−1 (Maxwell Reference Maxwell2016). Dose–response models could be fitted for the remaining 20 PRE herbicide treatments evaluated. Cultivars responded similarly for 10 out of 20 PRE herbicides (reduced model) that could be analyzed (Table 2). These herbicides were imazethapyr (SOA 2), dicamba (SOA 4), atrazine (SOA 5), metribuzin (SOA 5), fomesafen (SOA 14), nonencapsulated acetochlor (SOA 15), dimethenamid-p (SOA 15), isoxaflutole (SOA 27), tembotrione (SOA 27), and topramezone (SOA 27).
Percent hemp biomass reduction as a result of a 1× application of each respective PRE herbicide for two hemp cultivars: CRS-1 (top) and X-59 (bottom). Points represent the percent biomass reduction caused by the 1× rate of each respective herbicide; bars represent the upper and lower confidence intervals. The color of the bar represents the F-test value. Red points mean the cultivars are equal, whereas gray points mean the cultivars are not equal. Active ingredients are arranged from most injurious to least injurious. Numbers next to each active ingredient represent the site of action group number.

Percent hemp biomass reduction as a result of a 0.125× application of each respective PRE herbicide for two hemp cultivars: CRS-1 (top) and X-59 (bottom). Points represent the percent biomass reduction caused by the 0.125× rate of each respective herbicide; bars represent the upper and lower confidence intervals. The color of the bar represents the F-test value. Red points mean the cultivars are equal, whereas gray points mean the cultivars are not equal. Active ingredients are arranged from most injurious to least injurious. Numbers next to each active ingredient represent the site of action group number.

Effective dose to cause 10%, 50%, and 90% biomass reduction for preemergence application. a, b

a Abbreviations: ae, acid equivalent; ai, active ingredient; ED, estimated dose to reach 10%, 50%, or 90% biomass reduction; SE, standard error; SOA, site of action.
b The use of > indicates that the estimated dose was above the range of doses tested.
All 10 of these herbicides resulted in >50% biomass reduction at the 1× labeled rate, with dicamba, atrazine, metribuzin, nonencapsulated acetochlor, dimethenamid-p, isoxaflutole, and tembotrione causing >75% biomass reduction at the 1× labeled rate (Figure 1). Amaducci et al. (Reference Amaducci, Scordia, Liu, Zhang, Guo, Testa and Cosentino2015) advised against planting hemp in years following maize treated with atrazine. Metribuzin was found to reduce stand and plant height and to cause >70% biomass reduction in greenhouse applications (Flessner et al. Reference Flessner, Bryd, Bamber and Fike2020). Fomesafen has been found to cause significant biomass reduction and highly variable injury (Flessner et al. Reference Flessner, Bryd, Bamber and Fike2020; Maxwell Reference Maxwell2016). Flessner et al. (Reference Flessner, Bryd, Bamber and Fike2020) found that encapsulated acetochlor did not reduce stand or height in greenhouse trials, but they did not test nonencapsulated acetochlor. Acetochlor is also recommended at varying rates for weed control in hemp in China (Amaducci et al. Reference Amaducci, Scordia, Liu, Zhang, Guo, Testa and Cosentino2015), but the recommended formulation is unknown. Flessner et al. (Reference Flessner, Bryd, Bamber and Fike2020) did not find dimethenamid-p to cause reduction of stand or plant height in greenhouse applications, but it does have a plant-back interval of 9 mo, according to the label (Arneson et al. Reference Arneson, Wang and Werle2019). Isoxaflutole has been reported to cause severe injury in PRE applications (Knezevic et al. Reference Knezevic, Cuvaca and Scott2020).
The remaining 10 herbicide treatments evoked different responses between the two cultivars tested. These herbicides were chloransulam-methyl (SOA 2), chlorimuron-ethyl (SOA 2), pendimethalin (SOA 3), 2,4-D (SOA 4), clopyralid (SOA 4), flumioxazin (SOA 14), saflufenacil (SOA 14), sulfentrazone (SOA 14), pyroxasulfone (SOA 15), and S-metolachlor (SOA 15). Saflufenacil caused >50% biomass reduction at the 1× label rate in both cultivars, and chloransulam-methyl, chlorimuron-ethyl, sulfentrazone, pyroxasulfone, and S-metolachlor all caused >75% biomass reduction in both cultivars at the 1× label rate (Figure 1).
Saflufenacil was shown to be relatively safe to use as a soil-applied chemical (Knezevic et al. Reference Knezevic, Cuvaca and Scott2020). Flessner et al. (Reference Flessner, Bryd, Bamber and Fike2020) found chlorimuron-ethyl not to reduce stand but to reduce plant height and cause greater than 50% injury in greenhouse applications. Yet, chlorimuron-ethyl did not reduce yield in their field applications (Flessner et al. Reference Flessner, Bryd, Bamber and Fike2020). However, according to its label, chloriumuron-ethyl has a plant-back restriction of 30 mo (Arneson et al. Reference Arneson, Wang and Werle2019). Flessner et al. (Reference Flessner, Bryd, Bamber and Fike2020) found sulfentrazone to be relatively safe under greenhouse conditions. Maxwell (Reference Maxwell2016) showed variable yields when pyroxasulfone was applied PRE, but Flessner et al. (Reference Flessner, Bryd, Bamber and Fike2020) saw >70% biomass reduction under greenhouse conditions. S-metolachlor is recommended at varying rates in China (Amaducci et al. Reference Amaducci, Scordia, Liu, Zhang, Guo, Testa and Cosentino2015) and was found to be relatively safe in both greenhouse and field applications in various studies (Flessner et al. Reference Flessner, Bryd, Bamber and Fike2020; Knezevic et al. Reference Knezevic, Cuvaca and Scott2020; Maxwell Reference Maxwell2016).
Pendimethalin resulted in 77% biomass reduction in the CRS-1 cultivar and 54% in the X-59 cultivar (Figure 1). Pendimethalin is recommended for weed control in China (Amaducci et al. Reference Amaducci, Scordia, Liu, Zhang, Guo, Testa and Cosentino2015) and has shown to be safe for PRE application in several hemp studies conducted in the United States (Flessner et al. Reference Flessner, Bryd, Bamber and Fike2020; Knezevic et al. Reference Knezevic, Cuvaca and Scott2020; Maxwell Reference Maxwell2016). At the 1× label rate, 2,4-D resulted in 52% and 79% biomass reduction in the CRS-1 and X-59 cultivar, respectively (Figure 1). At the 1× label rate, clopyralid resulted in 30% biomass reduction in the CRS-1 cultivar but in 64% biomass reduction in the X-59 cultivar (Figure 1). Clopyralid was found to cause little to no injury when applied PRE (Knezevic et al. Reference Knezevic, Cuvaca and Scott2020). Flumioxazin caused 71% and 87% biomass reduction at the 1× label rate in CRS-1 and X-59, respectively (Figure 1). Flumioxazin has been found to cause injury varying from severe (Knezevic et al. Reference Knezevic, Cuvaca and Scott2020) to appearing relatively safe under greenhouse conditions (Flessner et al. Reference Flessner, Bryd, Bamber and Fike2020).
At the 0.125× rate, imazethapyr, dicamba, fomesafen, encapsulated acetochlor, dimethenamid-p, and tembotrione caused <50% biomass reduction (Figure 2). Atrazine, metribuzin, topramezone, and pyroxasulfone resulted in >50% biomass reduction and isoxaflutole resulted in >75% biomass reduction at the 0.125× rate. Saflufenacil and sulfentrazone caused <25% biomass reduction in both cultivars at the 0.125× rate. Chloransulam-methyl and chlorimuron-ethyl both resulted in >50% biomass reduction in the CRS-1 cultivar and in >75% biomass reduction in the X-59 cultivar at the 0.125× rate. Pendimethalin caused 29% and 20% biomass reduction at the 0.125× rate in the CRS-1 and X-59 cultivar, respectively. At the 0.125× rate, 2,4-D, clopyralid, and flumioxazin all resulted in <25% biomass reduction in the CRS-1 cultivar, while causing 31%, 49%, and 46% biomass reduction, respectively, in the X-59 cultivar. Pyroxasulfone caused >75% biomass reduction in the CRS-1 cultivar and >50% biomass reduction in the X-59 cultivar at the 0.125× rate.
Varietal differences in herbicide tolerance have been reported in many crops, including pinto bean (Phaseolus vulgaris L.; Bauer et al. Reference Bauer, Renner, Penner and Kelly1995), soybean (Hardcastle Reference Hardcastle1974), and cassava (Manihot esculenta Crantz; Hummel et al. Reference Hummel, Chauhan, Cermak, Mutka, Vijayaraghauan, Boyher, Starker, Bart, Voytas and Taylor2018), among others. However, only two hemp cultivars were tested, and there is no apparent pattern in these results to suggest if one cultivar is more sensitive to commonly used herbicides than the other. The difference in response between the two cultivars for some herbicides tested may be due to inherent genetic variation.
Overall, most herbicides applied PRE caused >50% biomass reduction at the recommended application rate. Clopyralid was the only herbicide tested to cause <50% biomass reduction at both the 0.125× and 1× rates. Saflufenacil is labeled for burndown with limited soil residual weed control, depending on application rate, in several crops in the United States, including chickpea (Cicer arietinum L.), corn, cotton (Gossypium hirsutum L.), field pea (Pisum sativum L.), small grains, grain sorghum [Sorghum bicolor (L.) Moench ssp. bicolor], and soybean (Anonymous 2020). Clopyralid and saflufenacil represent potential preplant burndown and PRE options that should be further investigated under field conditions for potential future use in commercial hemp production.
POST Herbicides
POST herbicides were sprayed when hemp plants were at 5 to 10 cm height (two to four leaves), simulating an application to a crop at early developmental stages, thus potentially more susceptible to herbicides compared to a later application onto a more developed crop. Previous studies applied herbicides at later growth stages when plants were in the 25 to 30 cm range (Flessner et al. Reference Flessner, Bryd, Bamber and Fike2020; Maxwell Reference Maxwell2016). As with the PRE herbicides, some POST herbicides caused significant injury to hemp at the lowest rate tested (Figures 3 and 4). Because of extreme sensitivity, models could not be fit for the POST applications of glyphosate (SOA 9) and topramezone (SOA 27). This is likely due to the high injury at low rates, resulting in data that could not follow a sigmoid curve. Sosnoskie and Maloney (Reference Sosnoskie and Maloney2021) reported approximately 93% biomass reduction due to 1× POST applications of glyphosate. Owing to irregularity in the biomass of sethoxydim- (SOA 1) and bromoxynil- (SOA 6) treated cones, a model could not be fitted for those data either. Bromoxynil was shown to be relatively safe for POST use in various studies (Flessner et al. Reference Flessner, Bryd, Bamber and Fike2020; Maxwell Reference Maxwell2016; Sosnoskie and Maloney Reference Sosnoskie and Maloney2021), and Flessner et al. (Reference Flessner, Bryd, Bamber and Fike2020) also found sethoxydim to be safe for use in hemp in greenhouse and field studies. The differences in our results compared to previous studies could be due to the testing of different cultivars. Previous research in other crops has shown that it is common to have differences in herbicide tolerance among cultivars within a crop (Bauer et al. Reference Bauer, Renner, Penner and Kelly1995; Hardcastle Reference Hardcastle1974; Hummel et al. Reference Hummel, Chauhan, Cermak, Mutka, Vijayaraghauan, Boyher, Starker, Bart, Voytas and Taylor2018).
Percent hemp biomass reduction as a result of a 1× application of each respective POST herbicide for two hemp cultivars: CRS-1 (top) and X-59 (bottom). Points represent the percent biomass reduction caused by the 1× rate of each respective herbicide; bars represent the upper and lower confidence intervals. The color of the bar represents the F-test value. Red points mean the cultivars are equal, whereas gray points mean the cultivars are not equal. Active ingredients are arranged from most injurious to least injurious. Numbers next to each active ingredient represent the site of action group number.

Percent hemp biomass reduction as a result of a 0.125× application of each respective POST herbicide for two hemp cultivars: CRS-1 (top) and X-59 (bottom). Points represent the percent biomass reduction caused by the 0.125× rate of each respective herbicide; bars represent the upper and lower confidence intervals. The color of the bar represents the F-test value. Red points mean the cultivars are equal, whereas gray points mean the cultivars are not equal. Active ingredients are arranged from most injurious to least injurious. Numbers next to each active ingredient represent the site of action group number.

Cultivars responded similarly for 11 out of the 17 POST-applied herbicides that could be analyzed (Table 3). These herbicides were clethodim (SOA 1), chlorimuron-ethyl (SOA 2), imazethapyr (SOA 2), 2,4-D (SOA 4), clopyralid (SOA 4), dicamba (SOA 4), atrazine (SOA 5), bentazon (SOA 6), glufosinate (SOA 10), fluthiacet-methyl (SOA 14), and mesotrione (SOA 27). Clethodim and clopyralid were the only two herbicides not to cause >75% biomass reduction at the 1× label rate, with clethodim causing 16.6% and clopyralid causing 21.5% biomass reduction (Figure 3). Chlorimuron-ethyl has previously been found to cause varying biomass reduction (40% to 56%) and reduced height (25% to 46%) in greenhouse studies (Flessner et al. Reference Flessner, Bryd, Bamber and Fike2020). Imazethapyr and bentazon were also found by Flessner et al. (Reference Flessner, Bryd, Bamber and Fike2020) to cause varying biomass reduction (40% to 56%) but not to reduce plant height. Sosnoskie and Maloney (Reference Sosnoskie and Maloney2021) also reported high biomass reduction due to bentazon application, with treated biomass being only 7% that of the nontreated control. Flessner et al. (Reference Flessner, Bryd, Bamber and Fike2020) found POST applications of clopyralid to be safe for application on hemp in both greenhouse and field studies. Sosnoskie and Maloney (Reference Sosnoskie and Maloney2021) reported clopyralid to cause approximately 25% biomass reduction when applied POST.
Effective dose to cause 10%, 50%, and 90% biomass reduction for postemergence application.a,b

a Abbreviations: ae, acid equivalent; ai, active ingredient; ED, estimated dose to reach 10%, 50%, or 90% biomass reduction; SE, standard error; SOA, site of action.
b The use of > indicates that the estimated dose was above the range of doses tested.
The remaining POST herbicides resulted in different responses from the two cultivars tested. These herbicides include chloransulam-methyl (SOA 2), rimsulfuron (SOA 2), fomesafen (SOA 14), lactofen (SOA 14), isoxaflutole (SOA 27), and tembotrione (SOA 27). All resulted in >75% biomass reduction in both cultivars at their respective label rates (Figure 3). Rimsulfuron has been shown to be injurious to hemp in POST applications, causing 16% to 54% biomass reduction in the field (Maxwell Reference Maxwell2016) and approximately 70% biomass reduction in the greenhouse (Sosnoskie and Maloney Reference Sosnoskie and Maloney2021). Flessner et al. (Reference Flessner, Bryd, Bamber and Fike2020) found fomesafen to be relatively safe for POST use on hemp in the greenhouse at a rate of 200 g ai ha−1. However, Sosnoskie and Maloney (Reference Sosnoskie and Maloney2021) found that biomass of POST-applied fomesafen-treated hemp was only 25% that of the control.
Clethodim and clopyralid both caused <25% biomass reduction at the 0.125× label rate, and imazethapyr and dicamba resulted in between 25% and 50% biomass reduction (Figure 4). At the 0.125× label rate, 2,4-D, bentazon, and fluthiacet-methyl caused >50% biomass reduction and chlorimuron-ethyl, atrazine, glufosinate, and mesotrione caused >75% biomass reduction (Figure 4). Fomesafen resulted in 38% biomass reduction in the CRS-1 cultivar at the 0.125× label rate and 67% biomass reduction in the X-59 cultivar. At the 0.125× label rate, lactofen caused >50% biomass reduction in the CRS-1 cultivar but only 39% biomass reduction in the X-59 cultivar. Chloransulam-methyl, rimsulfuron, and isoxaflutole all resulted in >50% reduction at the 0.125× label rate in the CRS-1 cultivar and >75% biomass reduction in the X-59 cultivar. At the 0.125× label rate, tembotrione caused >75% biomass reduction in both cultivars (Figure 4).
Overall, only two herbicides evaluated POST did not cause >50% biomass reduction: clethodim and clopyralid. All other herbicides were very injurious to hemp plants treated at the 5 to 10 cm height. Because even small doses of all POST herbicides tested (except for clopyralid and clethodim) caused significant plant injury or death (25% to 98%), drift and tank contamination should be of concern to hemp growers. Extreme caution should be taken when applying these herbicides near hemp fields.
Our results indicate that hemp is highly sensitive to most of the PRE and POST herbicides tested at the 1× label rates, indicating that at these effective rates for weed control, few candidate products would likely become labeled for hemp. Conversely, management of volunteer hemp in corn and soybean should not be a concern. Of the PRE herbicides tested, clopyralid and saflufenacil are potential candidates for registration on hemp and should be further evaluated under field conditions. Of the POST herbicides tested, clethodim and clopyralid are candidates for potential registration, warranting further evaluation under field conditions. All other POST herbicides tested resulted in >75% biomass reduction at the label rate. Our results also showed different responses between the two cultivars used, indicating that breeding efforts may be able to increase tolerance to some herbicides. Cultivar differences may also explain differences between these results and results of previous studies. Because of hemp’s sensitivity to the label rates of many commonly used herbicides, other means of weed control should be studied and used. Additional research on other hemp cultivars, impact of crop size and developmental stage, and environmental conditions should also be considered to better understand herbicide tolerance of industrial hemp.
Acknowledgments
The authors thank the University of Wisconsin–Madison Soybean and Small Grains and Cropping Systems Weed Science research groups for their technical assistance in establishing field experiments and data collection. Funding for HOC’s graduate research assistantship was provided by UW–Madison Division of Extension and College of Agricultural and Life Sciences Industrial Hemp Capacity Funds and a private donation from Mr. Tim Erdman. No conflict of interest has been declared.


 Open access