


Policy Significance Statement
Budget formulation involves trade-offs across competing objectives under legal, fiscal, and administrative constraints. This study presents an inspectable, reproducible workflow that uses Brazil’s executed federal expenditure by budgetary function (2000–2023) to generate and compare model-conditioned reallocation scenarios (on a standardised scale) under explicit bounds and penalties. The workflow supports structured “what-if” analysis by making assumptions transparent and by showing how evaluation design affects apparent model performance under severe data scarcity. The findings also highlight a practical constraint for policy analytics in Brazil: limited continuity and documentation across changing budget classifications can shorten usable series and make longitudinal comparability difficult to audit. By releasing data and code, the study enables scrutiny, replication, and iterative improvement by public-sector teams and researchers.
1. Introduction
Since the seminal contributions (Key, Reference Key1940; Musgrave, Reference Musgrave1959), the public finance literature has examined criteria for budget allocation and their implications for social welfare. Over time, this debate has increasingly recognised that spending decisions are not determined solely by technical criteria; they also reflect the interaction of economic, social, institutional, and contextual factors (Fozzard, Reference Fozzard2001; Case, Reference Case2008; Musgrave, Reference Musgrave2008; Amin et al., Reference Amin, Haq and Bhatti2020; Esnaashari et al., Reference Esnaashari, Bright, Francis, Hashem, Straub and Morgan2023; Medema, Reference Medema2023).
Traditional budgeting models based on incremental adjustments to historical expenditures have been criticised for rigidity, limited adaptability to changing conditions, and weak alignment between formulation and execution (Lindblom, Reference Lindblom1981; Kunnathuvalappil Hariharan, Reference Kunnathuvalappil Hariharan2017; Galdino and Andrade, Reference Galdino and Andrade2020; Musiega et al., Reference Musiega, Tsofa, Nyawira, Njuguna, Munywoki, Hanson, Mulwa, Molyneux, Maina, Normand, Jemutai and Barasa2023). These critiques have prompted renewed interest in budgeting approaches that incorporate greater flexibility and analytical capacity (Valle-Cruz et al., Reference Valle-Cruz, Fernandez-Cortez and Gil-Garcia2022a; Zatonatska et al., Reference Zatonatska, Pakholchuk, Syzov and Vorontsova2023).
Digital technologies have been discussed as a way to reduce delays and inefficiencies and to strengthen consistency between planning and execution (Valle-Cruz et al., Reference Valle-Cruz, Fernandez-Cortez, López-Chau, Rojas-Hernández, Ortiz-Rodríguez, Tiwari, Sicilia and Nikiforova2022b; Nose, Reference Nose2023; Zatonatska et al., Reference Zatonatska, Pakholchuk, Syzov and Vorontsova2023). Among these technologies, artificial intelligence (AI) can support pattern detection, forecasting, and scenario analysis for budget allocation (Valle-Cruz et al., Reference Valle-Cruz, Fernandez-Cortez and Gil-Garcia2022a; Esnaashari et al., Reference Esnaashari, Bright, Francis, Hashem, Straub and Morgan2023), while also highlighting governance challenges, including transparency and potential algorithmic bias (Zuiderwijk et al., Reference Zuiderwijk, Chen and Salem2021; Valle-Cruz et al., Reference Valle-Cruz, Fernandez-Cortez, López-Chau, Rojas-Hernández, Ortiz-Rodríguez, Tiwari, Sicilia and Nikiforova2022b, Reference Valle-Cruz, García-Contreras and Gil-Garcia2024a). Applied research on AI in budgeting remains limited, particularly in Brazil (Valle-Cruz et al., Reference Valle-Cruz, Gil-Garcia, Sandoval-Almazan, Charalabidis, Medaglia and Van Noordt2024b; Cunha, 2025).
Outside Brazil, applied studies adopt forecasting, prescriptive optimisation, and hybrid prediction–optimisation designs; consequently, they report performance using metrics that differ by objective and validation protocol. This heterogeneity limits direct numerical comparisons across studies and requires interpreting reported performance metrics (e.g., R 2 and MSE/root mean squared error [RMSE]) in relation to evaluation design, especially for time-indexed data.
The literature includes a prescriptive application to the Mexican federal budget (Fernandez-Cortez et al., Reference Fernandez-Cortez, Valle-Cruz and Gil-Garcia2020), forecasting applications evaluated with time-based designs in Switzerland (Santschi et al., Reference Santschi, Grau, Fehrenbacher and Blohm2024) and Romania (Drăgulin et al., Reference Drăgulin, Ștefan, Tăbîrcă, Șcheau, Radu and Munteanu2025), a sectoral hybrid prediction–reallocation exercise in South Korea (Jang, Reference Jang2019), and a global hybrid framework using multi-country data (Valle-Cruz et al., Reference Valle-Cruz, Fernandez-Cortez and Gil-Garcia2022a). Taken together, these studies position the present paper as a hybrid, exploratory application based on a short annual Brazilian series under tight data constraints.
The applied gap addressed here is the lack of end-to-end, inspectable documentation of a prediction–optimisation workflow tailored to Brazilian federal executed expenditure by budgetary function in a small-sample setting. Rather than proposing a new algorithm, the contribution is to (i) adapt an established prediction–optimisation workflow to Brazilian fiscal data and institutional constraints; (ii) make modelling assumptions explicit under severe data scarcity, including synthetic augmentation and its diagnostic implications; and (iii) provide a reproducible codebase and data pipeline that can be inspected, modified, and extended in future applications and robustness checks.
In Brazil, fiscal rules such as the expenditure ceiling (Peres and dos, Reference Peres and dos2020) increase attention to allocative efficiency because relatively small changes can reallocate resources across priorities. In 2024, the Federal Budget and the Social Security Budget totalled approximately BRL 5.5 trillion (about USD 1.1 trillion) (Senado Federal, 2024), indicating the scale at which reallocations may matter.
This study applies a hybrid AI workflow to Brazilian federal budget allocation and assesses its feasibility as an exploratory tool to support budget formulation. The approach combines prediction and optimisation to generate allocation scenarios under explicit constraints. The contribution is empirical and procedural: it documents implementation choices for a short annual series and shows how the adopted data-augmentation and validation strategy conditions interpretation, consistent with the literature on AI in public governance (Zuiderwijk et al., Reference Zuiderwijk, Chen and Salem2021; Zatonatska et al., Reference Zatonatska, Pakholchuk, Syzov and Vorontsova2023; Valle-Cruz et al., Reference Valle-Cruz, Gil-Garcia, Sandoval-Almazan, Charalabidis, Medaglia and Van Noordt2024b).
Accordingly, the central question is how a hybrid workflow that combines prediction and optimisation can be used as an exploratory exercise in Brazilian budget allocation. The workflow has two components: (i) a gradient-boosting model, implemented with XGBoost in Python, to learn a predictive mapping from executed expenditures by budgetary function to socioeconomic indicators and (ii) a Bayesian optimisation step based on the Tree-structured Parzen Estimator (TPE), implemented with Optuna, to search over alternative allocation scenarios that maximise an explicit objective function defined on model-predicted indicators. This approach builds on prior studies and is adapted to the Brazilian context (Jang, Reference Jang2019; Valle-Cruz et al., Reference Valle-Cruz, Fernandez-Cortez and Gil-Garcia2022a; Pinheiro and Becker, Reference Pinheiro and Becker2023).
Executed expenditures by budgetary function are used as independent variables, and GDP growth, inflation, and the Gini index are used as dependent variables, following earlier work (Valle-Cruz et al., Reference Valle-Cruz, Fernandez-Cortez and Gil-Garcia2022a). Because the available information is annual and aggregated, the specification aligns expenditure in year t with macro indicators observed in year t. This should be interpreted as a contemporaneous association in a short series, not as a dynamic or causal transmission mechanism. Lagged specifications were considered but not implemented because they would further reduce the effective sample and increase dimensionality relative to N = 24. The model therefore produces an exploratory simulation of an optimised allocation intended to support scenario comparison, not a prescriptive solution to Brazil’s socioeconomic challenges.
The paper proceeds as follows: it reviews the theoretical framework on budget allocation, presents the methodology, reports and discusses the results, and concludes with the main findings and avenues for future research.
2. Theoretical-conceptual framework
The allocation of public resources is a central process in state activity and forms the basis for performing its three classical functions: allocative, distributive, and stabilising (Musgrave, Reference Musgrave1959, Reference Musgrave2008; Case, Reference Case2008). This normative framework has become a reference for thinking about public finance, but its application faces practical limitations arising from political, institutional, and contextual constraints (Case, Reference Case2008; Desmarais-Tremblay, Reference Desmarais-Tremblay, Backhouse, Baujard and Nishizawa2021; Medema, Reference Medema2023).
Critical literature highlights that budgetary practice often relies on incremental models, in which expenditure history is updated with minor variations, without substantive revision of priorities or incorporation of new social demands (Galdino and Andrade, Reference Galdino and Andrade2020; Zatonatska et al., Reference Zatonatska, Pakholchuk, Syzov and Vorontsova2023). This pattern aligns with Lindblom’s account of incremental decision-making (successive limited comparisons), in which decision-makers evaluate a limited set of marginal alternatives rather than pursuing a rational–comprehensive review of all feasible options (Lindblom, Reference Lindblom1959, Reference Lindblom1981). Attempts to overcome this limitation, such as the Planning, Programming, and Budgeting System introduced in the 1960s, sought to link resource allocation to performance objectives but faced bureaucratic barriers, incentive problems, and a lack of reliable data (Brumby, Reference Brumby and Robinson2007; Zatonatska et al., Reference Zatonatska, Pakholchuk, Syzov and Vorontsova2023).
In this context, allocative efficiency depends not only on normative frameworks but also on the state’s ability to capture and process information on costs, outcomes, and social preferences (Brumby, Reference Brumby and Robinson2007; Afonso et al., Reference Afonso, Schuknecht and Tanzi2010; Wang and Alvi, Reference Wang and Alvi2011). This requirement aligns with recent approaches that advocate data-driven predictive methods to support decision-making (Valle-Cruz et al., Reference Valle-Cruz, Fernandez-Cortez and Gil-Garcia2022a; Valle-Cruz et al., Reference Valle-Cruz, Fernandez-Cortez, López-Chau, Rojas-Hernández, Ortiz-Rodríguez, Tiwari, Sicilia and Nikiforova2022b; Valle-Cruz et al., Reference Valle-Cruz, García-Contreras and Muñoz-Chávez2022c). By incorporating relationships among socioeconomic variables and constructing alternative scenarios under explicit constraints, these methodologies provide tools to assess trade-offs and support public choice (Valle-Cruz et al., Reference Valle-Cruz, Fernandez-Cortez and Gil-Garcia2022a; Esnaashari et al., Reference Esnaashari, Bright, Francis, Hashem, Straub and Morgan2023).
The advancement of AI reinforces this perspective by introducing algorithms capable of identifying patterns in large volumes of data and supporting decision-making in complex environments (Zuiderwijk et al., Reference Zuiderwijk, Chen and Salem2021; Valle-Cruz et al., Reference Valle-Cruz, Gil-Garcia, Sandoval-Almazan, Charalabidis, Medaglia and Van Noordt2024b). Techniques such as machine learning, automated reasoning, and optimisation have been applied in several public sectors, including health, security, infrastructure, and auditing (Fatima et al., Reference Fatima, Desouza and Dawson2020; Zuiderwijk et al., Reference Zuiderwijk, Chen and Salem2021; Abu Huson et al., Reference Abu Huson, Sierra-García and Garcia-Benau2024). In the budgetary field, studies indicate that the integration of forecasting and optimisation can generate efficiency gains by proposing reallocations guided by explicit objective functions linked to macroeconomic indicators (Jang, Reference Jang2019; Valle-Cruz et al., Reference Valle-Cruz, Fernandez-Cortez and Gil-Garcia2022a).
In the applied literature, at least three recurring formats can be identified for the use of artificial intelligence in public budgeting. In the predictive format, the aim is to forecast budget items or aggregates and to assess predictive error using metrics such as the RMSE, the coefficient of determination (R 2), and the mean absolute percentage error (MAPE), often under a time-based test design or a train–test split (Santschi et al., Reference Santschi, Grau, Fehrenbacher and Blohm2024; Drăgulin et al., Reference Drăgulin, Ștefan, Tăbîrcă, Șcheau, Radu and Munteanu2025). In the prescriptive format, the emphasis is on searching for an allocation that maximises an objective function subject to constraints, and results are reported using solution-quality indicators relative to a reference scenario, such as fitness measures in evolutionary approaches (Fernandez-Cortez et al., Reference Fernandez-Cortez, Valle-Cruz and Gil-Garcia2020). In the hybrid format, a predictive component informs an optimisation or reallocation procedure, so studies may report both predictive metrics and the gains associated with the optimised scenario (Jang, Reference Jang2019; Valle-Cruz et al., Reference Valle-Cruz, Fernandez-Cortez and Gil-Garcia2022a).
This typology supports comparison across studies by task type, metric, and evaluation protocol; for time-indexed data, comparability also depends on the validation design. Under non-stationarity, randomised cross-validation may yield overly optimistic generalisation estimates relative to time-ordered or blocked schemes (Schnaubelt, Reference Schnaubelt2019).
In small-sample applications, comparability can also depend on how synthetic augmentation interacts with evaluation, since generating synthetic records prior to splitting can inflate performance estimates relative to designs that generate augmentation only from training data (Liu et al., Reference Liu, Kababji, Mitsakakis, Pilgram, Walters, Clemons, Pond, El-Hussuna and Emam2025). In this study, reported performance metrics are therefore interpreted as internal validation under K-fold cross-validation on an augmented short annual series, not as out-of-time predictive accuracy.
In Latin America, a prescriptive application to the Mexican federal public budget (2018) reports a fitness value of 513.87 for the observed allocation and 520.05 for the authors’ selected “optimal simulation” under a genetic algorithm setup (population size = 100; mutation chance = 0.05; elitism = 20; 1000 generations) (Fernandez-Cortez et al., Reference Fernandez-Cortez, Valle-Cruz and Gil-Garcia2020).
Using Romanian monthly data (January 2016–December 2024; 108 observations) from the Forexebug reporting system, a published study applies a predictive (forecasting) approach to total expenditures, benchmarking econometric and AI models under a chronological split (training 2016–2022, validation 2023, test 2024) and also reporting a blocked hold-out design (84 months for training and 24 months for testing). In the univariate forecasting setting (i.e., using only past values of the expenditure series), their temporal convolutional network achieves R 2 = 0.713132, with RMSE = 0.275900 and MAPE = 26.439529%, where these error values are reported in the study’s evaluation context after the stated preprocessing and scaling procedures (Drăgulin et al., Reference Drăgulin, Ștefan, Tăbîrcă, Șcheau, Radu and Munteanu2025).
At a global scale, a hybrid design using World Bank country-year data (217 countries; 1960–2019) reports mean squared error (MSE) values for alternative neural architectures (selected via a 70/30 split) and then uses NSGA-II to generate multiobjective allocation scenarios targeting GDP growth, inflation, and inequality (Gini) (Valle-Cruz et al., Reference Valle-Cruz, Fernandez-Cortez and Gil-Garcia2022a).
Beyond country-level budgeting, hybrid designs have also been applied to sectoral allocations. For example, a South Korean decision-support framework for public R&D budget allocation combines a machine-learning model to predict R&D output with a robust optimisation step that accounts for uncertainty in those predictions. In an empirical application to a national R&D programme, the optimised allocation is reported to deliver 13.6% higher R&D output than the observed allocation while holding the total budget constant (Jang, Reference Jang2019).
Despite this potential, such models face challenges related to transparency and governance. The literature warns of the risk of the algorithmic “black box,” which hinders the auditability of decisions and may introduce biases or distortions if input data are inconsistent (Goodman and Flaxman, Reference Goodman and Flaxman2017; Xie et al., Reference Xie, Chai and Liu2023).
Cross-country discussions in public financial management indicate that many AI uses remain in pilot or early development stages and that public evidence on costs and impacts is often limited or anecdotal; reported results therefore frequently take the form of operational indicators. For example, during debates on France’s 2024 budget, a language model reportedly summarised 94% of 5400 parliamentary amendments from the National Assembly’s first reading in 10 minutes, with an estimated error rate of 5–10% (Moretti, Reference Moretti2024).
Moreover, in emerging countries (Ghiassi and Simo-Kengne, Reference Ghiassi and Simo-Kengne2021; Zuiderwijk et al., Reference Zuiderwijk, Chen and Salem2021), such as Brazil, where budget information systems exhibit gaps in standardisation and data quality, the effectiveness of these approaches may be compromised.
3. Methodology
3.1. Model architecture
The model employed here adapts and documents methodologies tested in previous research, applying them to the allocation of Brazilian federal public budgetary resources (Jang, Reference Jang2019; Valle-Cruz et al., Reference Valle-Cruz, Fernandez-Cortez and Gil-Garcia2022a; Pinheiro and Becker, Reference Pinheiro and Becker2023; Nadarajah et al., Reference Nadarajah, Mba, Ravonimanantsoa, Rakotomarolahy and Ratolojanahary2025). The core structure follows prior work in coupling a predictive model with an optimisation/search procedure to explore alternative allocation configurations under an explicit objective function, although the specific algorithms and implementations vary across studies. The specific contribution of this implementation is to operationalise that structure with Brazilian executed expenditures by budgetary function (2000–2023) under the standardised classification introduced by Ordinance No. 42/1999 (Ministério de Estado do Orçamento e Gestão, 1999), to document the empirical choices required under N = 24, and to report the implications of the adopted synthetic augmentation and validation strategy for interpretation. In this sense, the study prioritises transparency and reproducibility of an applied workflow over claims of methodological novelty.
Extreme Gradient Boosting (XGBoost) was selected because it is a widely used ensemble method (combining multiple models to generate predictions) capable of capturing complex non-linear relationships in fiscal data (Nadarajah et al., Reference Nadarajah, Mba, Ravonimanantsoa, Rakotomarolahy and Ratolojanahary2025). However, the accuracy of XGBoost predictions depends on careful hyperparameter calibration (e.g., tree depth, learning rate, regularisation coefficients), since inappropriate settings may lead to overfitting or performance loss (Nadarajah et al., Reference Nadarajah, Mba, Ravonimanantsoa, Rakotomarolahy and Ratolojanahary2025).
To address this challenge, Bayesian optimisation using the TPE via the Optuna library was adopted, given its ability to explore a search space more systematically than exhaustive (grid search) or random searches (Nadarajah et al., Reference Nadarajah, Mba, Ravonimanantsoa, Rakotomarolahy and Ratolojanahary2025). In this study, TPE/Optuna was applied in the allocation-search step, guiding the search over feasible budget-allocation vectors under an explicit objective function defined on the model-predicted indicators. Unlike uninformed search strategies, this Bayesian approach uses a probabilistic model to prioritise candidate solutions with higher expected objective values, reducing computational cost and improving the efficiency of scenario exploration (Nadarajah et al., Reference Nadarajah, Mba, Ravonimanantsoa, Rakotomarolahy and Ratolojanahary2025).
Accordingly, the hybrid AI model applied in this exploratory exercise analyses different configurations of budget allocation (Figure 1), with Brazilian federal executed expenditures by budgetary function (Table 1) serving as the independent input variables, and an allocation-search step implemented with TPE/Optuna.
Hybrid AI model for budgetary resource allocation. Note: Author’s own elaboration.

Budgetary functions

Note: Author’s own elaboration, adapted from Ordinance No. 42/1999.
The output (dependent) variables were three socioeconomic indicators—GDP growth, inflation, and the Gini index—following the approach proposed by Valle-Cruz et al. (Reference Valle-Cruz, Fernandez-Cortez and Gil-Garcia2022a). In their framework, fiscal policy can be summarised as a set of interrelated functions involving resource allocation, income distribution, and macroeconomic stabilisation (Musgrave, Reference Musgrave2008), and these indicators are treated as observable “outputs” that approximate those dimensions for empirical assessment. GDP growth is used to represent the activity dimension, reflecting aggregate economic performance that can respond to public spending, potentially including multiplier-type mechanisms. Inflation is included as an indicator linked to stabilisation, since fiscal expansion and demand conditions may interact with price dynamics, and high inflation is associated with greater uncertainty that can affect investment and, indirectly, the budget allocation process. The Gini index is used to capture the distributional dimension, as a standard measure of income inequality that supports evaluating whether the public spending profile is associated with more equal outcomes and related welfare considerations (Valle-Cruz et al., Reference Valle-Cruz, Fernandez-Cortez and Gil-Garcia2022a).
The dataset covers the period from 2000 to 2023, chosen due to the standardisation of budgetary functions established by Ordinance No. 42/1999, which ensured consistency and comparability of the information over time (Ministério de Estado do Orçamento e Gestão, 1999). Despite this advantage, the series comprises only 24 annual observations, which reduces the statistical power of the model and limits the generalisation of the results. This restriction stems from the incompatibility of earlier records, which used different classifications and thus could not be integrated into the dataset analysed.
The variables used in this study are observed at an annual frequency, and expenditures are measured as executed amounts within each fiscal year. The baseline specification therefore maps the vector of executed spending in year t to the macro indicators observed in year t. This should be read as an empirical association under annual aggregation and short historical coverage, not as evidence of an immediate effect of each spending category on GDP, inflation, or inequality. In practice, several functions—such as education, science and technology, or infrastructure—may operate with multi-year lags. Lagged features (e.g., t − 1 or t − 2 expenditures) were not included in the present implementation because the resulting loss of observations and the expansion of the feature space would aggravate the small-sample and overfitting risks. Testing alternative lag structures is identified as a priority for future robustness checks.
3.2. Dataset and variables
Table 2 below provides a detailed description of the variables selected for the simulation conducted by the hybrid model:
Variable description

Note: Author’s own elaboration.
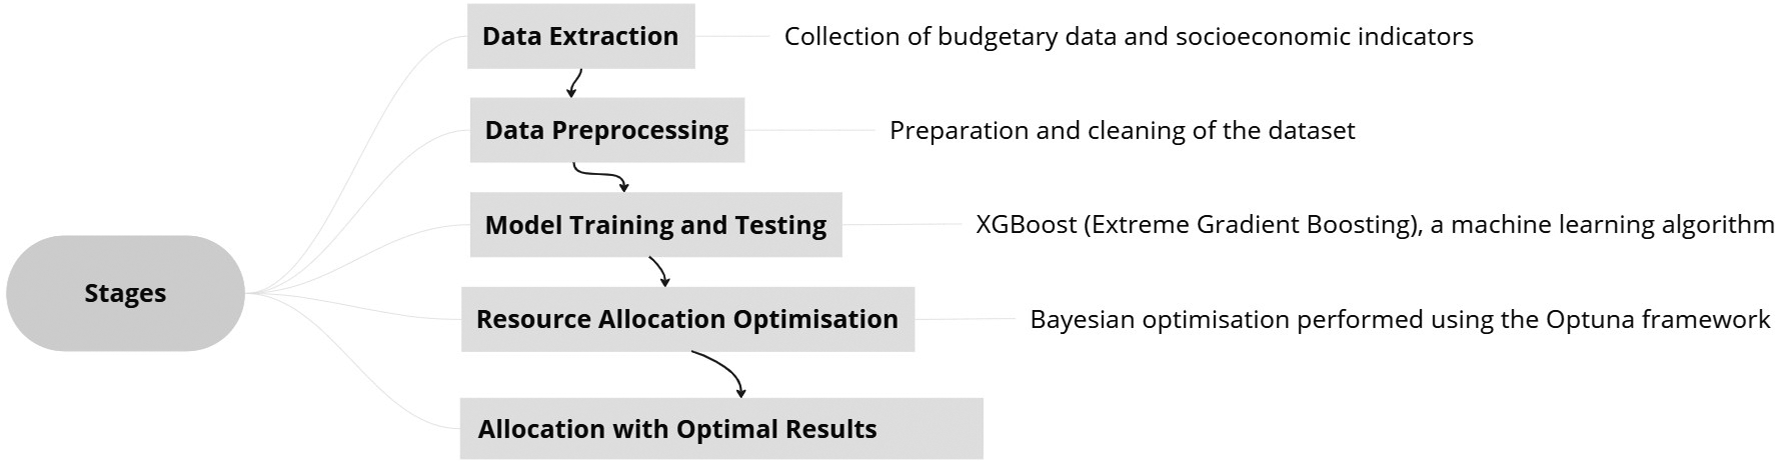
Figure 2 illustrates the methodological steps followed to apply the hybrid model for the optimised allocation of public resources, in alignment with the research objectives. The modelling process was structured to ensure replicability, with code and datasets properly documented to guarantee transparency.
Stages of the process for optimising public budgetary resources using AI. Note: Author’s own elaboration.

3.3. Synthetic data generation
Given the available data, the limited sample size (N = 24) restricted the model’s ability to capture patterns and generalise effectively. To mitigate data scarcity, synthetic data generation was employed to augment the dataset used in modelling, following prior discussions on budget simulations with machine learning in small-sample settings (Valle-Cruz et al., Reference Valle-Cruz, Fernandez-Cortez, López-Chau, Rojas-Hernández, Ortiz-Rodríguez, Tiwari, Sicilia and Nikiforova2022b). Three augmentation procedures were applied. First, controlled noise injection was implemented by adding Gaussian noise (standard deviation 0.05) to the input variables (budget functions) and to the output variables (GDP growth, inflation, and the Gini index). Second, bootstrap resampling was conducted by drawing 1000 paired samples of (X, y) with replacement using a fixed random seed (Scikit-Learn Developers, 2007).
Third, a variational autoencoder (VAE) was trained on the standardised input matrix X (29 budget functions) to reconstruct observed input patterns, using a MSE reconstruction loss with a linear decoder output; the reconstructed X was included as an additional synthetic block; the corresponding outputs were kept equal to the original observed values (TensorFlow Community, 2022). The resulting augmented set corresponds to 24 (noise) + 1000 (bootstrap) + 24 (VAE reconstruction) = 1048 synthetic observations.
It is recognised that these synthetic observations do not replace real historical data and do not validate causal or structural relationships between budget allocations and macroeconomic outcomes. In small-sample tabular settings, reported gains from augmentation vary across datasets and evaluation may become optimistic if synthetic records are generated prior to the train–test partition, due to information leakage between augmented and original observations (Liu et al., Reference Liu, Kababji, Mitsakakis, Pilgram, Walters, Clemons, Pond, El-Hussuna and Emam2025). In this study, augmentation was performed once using the full series (N = 24) and the resulting augmented dataset was then evaluated through K-fold cross-validation (Scikit-Learn Developers, 2007; NumPy Developers, Reference NumPy Developers2008; TensorFlow Community, 2022).
Accordingly, the reported performance metrics should be interpreted as internal validation under this augmentation-and-evaluation scheme, and they may overstate generalisation relative to designs that generate synthetic records only from the training portion of each fold or that preserve a fully held-out set of real observations for testing (Liu et al., Reference Liu, Kababji, Mitsakakis, Pilgram, Walters, Clemons, Pond, El-Hussuna and Emam2025). For these reasons, results are interpreted as exploratory scenario outputs conditional on the adopted data-augmentation approach and the available dataset.
A robustness check was implemented in which synthetic records are generated only from the training portion of each cross-validation fold and then evaluated on the held-out real fold (i.e., the original observations only), reducing leakage risk relative to a one-shot augmentation.
Future evaluations could isolate real observations for testing (e.g., temporal splits) and include ablation tests for each augmentation block (noise-only, bootstrap-only, VAE-only).
3.4. Training and evaluation—machine-learning algorithm (gradient boosting)
XGBoost is a supervised learning algorithm based on Gradient Boosting, widely employed for its computational efficiency and its ability to model complex relationships among variables (Friedman, Reference Friedman2001; Chen and Guestrin, Reference Chen and Guestrin2016; Vaid et al., Reference Vaid, Somani, Russak, Freitas, Chaudhry, Paranjpe, Johnson, Lee, Miotto, Richter, Zhao, Beckmann, Naik, Kia, Timsina, Lala, Paranjpe, Golden, Danieletto, Singh, Meyer, O’Reilly, Huckins, Kovatch, Finkelstein, Freeman, Argulian, Kasarskis, Percha, Aberg, Bagiella, Horowitz, Murphy, Nestler, Schadt, Cho, Cordon-Cardo, Fuster, Charney, Reich, Bottinger, Levin, Narula, Fayad, Just, Charney, Nadkarni and Glicksberg2020; Montomoli et al., Reference Montomoli, Romeo, Moccia, Bernardini, Migliorelli, Berardini, Donati, Carsetti, Guerci, Ince, Frontoni, Hilty, Alfaro-Farias, Vizmanos-Lamotte, Tschoellitsch, Meier, Aguirre-Bermeo, Apolo, Martínez, Jurkolow, Delahaye, Novy, Losser, Wengenmayer, Rilinger, Staudacher, David, Welte, Stahl, Pavlos, Aslanidis, Korsos, Babik, Nikandish, Rezoagli, Giacomini, Nova, Fogagnolo, Spadaro, Ceriani, Murrone, Wu, Cogliati, Colombo, Catena, Turrini, Simonini, Fabbri, Potalivo, Facondini, Gangitano, Perin, Grazia Bocci, Antonelli, Gommers, Rodríguez-García, Gámez-Zapata, Taboada-Fraga, Castro, Tellez, Lander-Azcona, Escós-Orta, Martín-Delgado, Algaba-Calderon, Franch-Llasat, Roche-Campo, Lozano-Gómez, Zalba-Etayo, Michot, Klarer, Ensner, Schott, Urech, Zellweger, Merki, Lambert, Laube, Jeitziner, Jenni-Moser, Wiegand, Yuen, Lienhardt-Nobbe, Westphalen, Salomon, Drvaric, Hillgaertner, Sieber, Dullenkopf, Petersen, Chau, Ksouri, Sridharan, Cereghetti, Boroli, Pugin, Grazioli, Rimensberger, Bürkle, Marrel, Brenni, Fleisch, Lavanchy, Perez, Ramelet, Weber, Gerecke, Christ, Ceruti, Glotta, Marquardt, Shaikh, Hübner, Neff, Redecker, Moret-Bochatay, Bentrup, Studhalter, Stephan, Brem, Gehring, Selz, Naon, Kleger, Pietsch, Filipovic, Ristic, Sepulcri, Heise, Franchitti Laurent, Laurent, Wendel Garcia, Schuepbach, Heuberger, Bühler, Brugger, Fodor, Locher, Camen, Gaspert, Jovic, Haberthuer, Lussman and Colak2021).
Its functioning relies on the sequential construction of decision trees, where each new tree aims to correct the errors of previous predictions by adjusting the weights according to the gradient of the loss function. This process gradually reduces residuals and enhances the model’s generalisation capacity across different datasets (Chen and Guestrin, Reference Chen and Guestrin2016; XGBoost developers, 2022).
In the present study, XGBoost was applied to predict three socioeconomic indicators—GDP growth, inflation, and the Gini index—based on standardised (z-score) budgetary data. Hyperparameters were empirically defined through experimentation using K-fold cross-validation and statistical metrics such as MSE, RMSE, and R 2, to support model selection under the adopted evaluation protocol. Given the annual time structure and the short series, K-fold results are interpreted as internal validation for an exploratory exercise rather than as out-of-sample evidence of policy forecasting performance. Because the series is time-indexed and may be non-stationary, estimated generalisation performance can vary across validation protocols; randomised K-fold schemes may therefore yield different error profiles than approaches that preserve temporal order (Schnaubelt, Reference Schnaubelt2019).
The implementation estimates a multi-output specification using a wrapper (MultioutputRegressor) around XGBoost, fitting one regressor per target under a shared input matrix.
Because the evaluation is conducted on an augmented dataset that includes synthetic observations derived from the original records, cross-validation metrics may overstate generalisation to unseen real-world conditions. The learning curve was also analysed to evaluate the relationship between model performance and training sample size.
To better characterise generalisation under data scarcity, future robustness checks could evaluate performance on the original 24 observations under time-aware splits (e.g., rolling or blocked validation), compare results against simpler baselines (e.g., linear models), and test sensitivity to augmentation choices by re-estimating the model under ablations (noise-only, bootstrap-only, VAE-only, and no augmentation) and across different random seeds. These checks would clarify how much of the reported fit is driven by the augmentation design versus stable relationships in the underlying historical series.
3.5. Optimisation procedure—TPE
The TPE is a Bayesian optimisation method that guides search over a parameter space by iteratively proposing promising candidates based on past evaluations (Frazier, Reference Frazier2018; Joy et al., Reference Joy, Rana, Gupta and Venkatesh2020; Optuna Contributors, 2020; Ozaki et al., Reference Ozaki, Tanigaki, Watanabe, Nomura and Onishi2022; Rajalakshmi and Sulochana, Reference Rajalakshmi and Sulochana2023). In this study, TPE/Optuna is used to search over alternative budget allocation scenarios (decision variables) within bounds defined from the historical data, maximising an explicit objective function computed on the model-predicted socioeconomic indicators.
The Optuna library, which implements TPE, can run optimisation trials in parallel, reducing computational cost and improving the robustness of the results (Frazier, Reference Frazier2018; Akiba et al., Reference Akiba, Sano, Yanase, Ohta and Koyama2019; Parra-Ullauri et al., Reference Parra-Ullauri, Zhang, Bravalheri, Nejabati and Simeonidou2023).
In the model, TPE was employed to maximise the objective function defined as: score = (w₁·GDP_growth) − (w₂·Inflation) − (w₃·Gini_index) − penalty, prioritising budget-allocation combinations that increase economic activity while reducing inflationary pressure and income inequality, under the imposed statistical constraints. All optimisation results are conditional on this same-year (year t to year t) alignment between expenditures and outcomes, which represents a static mapping for scenario exploration rather than a dynamic policy path with distributed lag effects.
The choice of GDP growth, inflation, and the Gini index follows the adapted approach of Valle-Cruz et al. (Reference Valle-Cruz, Fernandez-Cortez and Gil-Garcia2022a), which operationalises fiscal policy trade-offs using output indicators aligned with the interrelated functions of public finance—economic activity, stabilisation, and distribution—also consistent with the conceptual framing adopted in this paper (Musgrave, Reference Musgrave1959). In the present implementation, w₁ = w₂ = w₃ = 1 (equal weights).
Because the dependent variables are evaluated on standardised (z-score) scales, equal weights should be read as a neutral baseline that treats a one-standard deviation improvement in each indicator symmetrically for exploratory scenario construction. This choice does not represent revealed social preferences, an official policy welfare function, or a recommended weighting scheme. This simplification does not fully capture the trade-offs inherent in real economic policy choices and is treated as a modelling assumption that conditions the resulting allocation scenario. Future robustness checks could evaluate sensitivity to alternative weight combinations (w₁, w₂, and w₃) and to different penalty strengths, to better reflect heterogeneous political priorities across contexts.
4. Results
First, the behaviour of the 1048 synthetic data points was evaluated against the 24 original observations; z-score normalisation was applied to ensure comparability across variables and model stability. As shown in Table 3, the synthetic data exhibited only minor shifts in mean values (GDP growth: −0.02; inflation: 0.02; Gini index: 0.04), while standard deviations remained close to 1 and the minimum–maximum ranges were similar to those of the original data. This result suggests that the synthetic data generation methods preserved both the central tendency and variability of the distributions observed in the original dataset.
Descriptive statistics of output variables (original versus synthetic data)

Note: Author’s own elaboration.
The boxplots in Figure 3a–c show that the synthetic data largely preserve the central structure of the original distributions, with similar medians and interquartile ranges across GDP growth, inflation, and the Gini index. Differences are concentrated in the tails: GDP growth displays a more pronounced lower tail in the synthetic series, and inflation shows more upper-tail outliers, while the Gini distribution remains closely aligned in range, with only small differences in dispersion between original and synthetic observations.
Distribution comparison: boxplots (a–c). Note: Author’s own elaboration.

4.1. Learning curve analysis
Figure 4 reports the learning curve under cross-validation on the augmented dataset, relating MSE to training-set size. Training error remains low and increases slightly as the training set grows, while validation error stays higher throughout. The validation curve is lowest at intermediate sizes and then rises modestly, approaching approximately 0.04 at the largest training-set sizes, consistent with the internal cross-validated MSE in Table 4. The persistent training–validation separation indicates that, under this evaluation setup and data constraints, the model fits the training partitions more closely than the held-out partitions, which limits interpretation to exploratory scenario comparisons rather than claims of stable predictive accuracy for unseen observations or tail-risk conditions.
Learning curve. Note: Author’s own elaboration.

Performance of the machine-learning model under two validation protocols

Note 1: Author’s own elaboration.
Note 2: “Internal validation” refers to randomised K-fold cross-validation on the augmented dataset. “Anti-leakage” refers to cross-validation on the 24 real observations, generating synthetic records only from the training portion of each fold.
Note 3: Adjusted R 2 is not reported for the anti-leakage protocol because the evaluation is performed on small real test folds (n varies by fold), making adjusted-R 2 unstable and not directly comparable.
4.2. Predictive performance evaluation of the XGBoost model
The predictive performance of the model was assessed using two standard statistical metrics for regression: MSE and R 2. The MSE corresponds to the average of the squared differences between observed and predicted values and is more sensitive to large deviations (James et al., Reference James, Witten, Hastie, Tibshirani and Taylor2023; Kumar et al., Reference Kumar, Kedam, Sharma, Mehta and Caloiero2023; Pu et al., Reference Pu, Leader, Ali, Geng and Wilson2023; Segovia et al., Reference Segovia, Toaquiza, Llanos and Rivas2023). R 2, in turn, indicates the proportion of data variability explained by the model, with values closer to 1 indicating greater explained variance (James et al., Reference James, Witten, Hastie, Tibshirani and Taylor2023).
Adjusted R 2 was also reported, accounting for the number of predictor variables; unlike R 2, it penalises the inclusion of predictors that do not improve fit, supporting comparison across specifications (James et al., Reference James, Witten, Hastie, Tibshirani and Taylor2023).
Table 4 presents the performance of the XGBoost model under two validation protocols: (i) internal validation via randomised K-fold cross-validation on the augmented dataset (N = 1072 observations; 24 real +1048 synthetic) and (ii) an anti-leakage design in which cross-validation is performed on the 24 real observations and synthetic records are generated only from the training portion of each fold.
Under internal validation on the augmented dataset, the model explained, on average, about 97% of the data variability (mean R 2 = 0.97) and achieved a mean squared error of 0.04; the mean adjusted R 2 (0.96) indicates that the inclusion of predictors preserved explanatory power under this evaluation setup. Across targets, mean MSE values were similar (0.03–0.04), with inflation showing the lowest mean MSE (0.03) and the Gini index the highest mean R 2 (0.97).
Under the anti-leakage protocol, performance deteriorated substantially (overall mean MSE = 1.03; overall mean R 2 = −0.45), with negative R 2 for GDP growth and inflation and a positive R 2 only for the Gini index (0.60). These contrasts indicate that fit metrics are sensitive to the evaluation protocol under severe data scarcity and should be interpreted as conditional on the adopted augmentation-and-evaluation scheme rather than as evidence of out-of-sample forecasting accuracy on independent real-world data.
4.3. Forecast accuracy
Table 5 presents the first five and last five rows of the augmented dataset (after shuffling); values are reported as z-scores. The results indicate that, under this internal validation protocol, predicted values are often close to the observed values across the central range of the sample. For example, for GDP growth, observation 4 has an observed value (z-score) of 1.22 and a corresponding prediction of 1.21. For the Gini index, observation 1071 has an observed value of 1.92, whereas the predicted value is 1.90. For inflation, observation 1069 has an observed value of −1.75 and a prediction of −1.75.
Comparison between actual and predicted values by the model (z-score)

Note: Author’s own elaboration.
Under internal K-fold validation on the augmented dataset, predictions generally align more closely with observed values in the mid-range, whereas Figures 5 and 6 show wider departures in the distribution tails.
Comparison of actual and predicted values (a–c). Note: Author’s own elaboration.

Scatter plots (a–c). Note: Author’s own elaboration.

The graphs (Figure 5a–c) plot observed and predicted values across the full set of samples. Visually, the predicted series tracks the observed series closely across much of the sample, with substantial overlap between markers throughout the central range of each variable. Where discrepancies are visible, they occur mainly at sharp transitions and at some high or low values, where the predicted points depart from the observed points and the predicted variation appears less pronounced than the observed variation in those segments.
The scatter plots (Figure 6a–c) compare observed and predicted values against the identity line. Across the three outcomes, the points are concentrated near the identity line in the central range, indicating close agreement for many observations around the middle of the distributions. At the lower and upper ends, dispersion around the identity line becomes more visible, with a smaller set of points showing larger deviations (both under- and overprediction relative to the observed values), especially in the GDP growth and inflation panels.
4.4. Optimised budget allocation
The optimisation results indicated that, in this run, the model predicted GDP growth at approximately 1.15 standard deviations above the historical mean, while inflation and the Gini index were estimated at about 0.04 and 0.17 standard deviations below the mean, respectively. Since the data were standardised, these values represent relative variations compared to the original distributions. The optimisation is a quantitative, exploratory exercise only.
In this scenario (Figure 7), the optimised allocation vector implies higher values (on the standardised input scale: z-score) for culture (+0.60), agriculture (+0.33), administration (+0.24), and legislative (+0.24), while lower values are assigned to labour (−1.04), Agrarian organisation (−0.80), sports and leisure (−0.68), health (−0.64), and social security (−0.60).
Optimised allocation.

Because inputs were standardised (z-scores), these magnitudes are expressed in standard-deviation units relative to the historical distribution used in modelling and summarise the direction and magnitude within the dataset scale rather than budget shares or nominal amounts. Under this allocation, the model predicts (in standardised output units: z-score) GDP growth = 1.15, inflation = −0.04, and Gini index = −0.17, which corresponds to the objective function used in the optimisation step. These outputs remain conditional on the predictive model and the imposed search space and penalties, and they should be interpreted as an exploratory scenario rather than as budget guidance.
5. Discussion
This study implements a hybrid prediction–optimisation workflow to organise exploratory scenario analysis for Brazilian federal budget allocation rather than to automate decisions. Because budget formulation is mediated by legal constraints, political bargaining, and administrative capacity (Fozzard, Reference Fozzard2001; Case, Reference Case2008; Medema, Reference Medema2023), the workflow serves to make modelling assumptions explicit and to enable transparent comparison across feasible allocation counterfactuals.
The choice of GDP growth, inflation, and the Gini index as model outputs follows applied hybrid work (Valle-Cruz et al., Reference Valle-Cruz, Fernandez-Cortez and Gil-Garcia2022a) and offers empirical proxies for the allocative, stabilisation, and distributive dimensions commonly used to frame fiscal-policy trade-offs (Musgrave, Reference Musgrave1959, Reference Musgrave2008). Within that framing, equal weights on standardised outcomes operate as a baseline convention for scenario construction, avoiding an exogenous priority ordering that cannot be inferred from the data and that would, in practice, vary across political contexts.
The results show how strongly data constraints shape what the workflow can credibly support. The synthetic augmentation procedures preserve central tendency and dispersion in ways that remain close to the observed distributions, while differences are more visible in the tails. Predictive diagnostics are consistent with this profile, indicating closer correspondence between observed and predicted values in the central range and larger deviations at extremes. Since the optimisation step ranks candidate allocations using model-predicted outputs, scenario ordering and the resulting allocation vector remain contingent on the predictive component’s behaviour, particularly where predictive error increases.
The “optimised” allocation is therefore best read as a model-conditioned counterfactual defined within the imposed bounds and penalties, with more cautious interpretation for configurations that push the search into sparsely represented regions of the data.
A related implication emerges from the contrast between the two evaluation protocols. Internal cross-validation on the augmented dataset yields high fit metrics, whereas the anti-leakage design—where augmentation is restricted to training folds and evaluation is confined to held-out real observations—shows substantial deterioration for GDP growth and inflation, with positive performance remaining only for the Gini index.
This divergence is consistent with two mechanisms that can yield optimistic performance estimates in small, time-indexed settings: validation designs that do not preserve temporal structure can overstate generalisation, and augmentation performed before train–test separation can leak information into evaluation metrics (Schnaubelt, Reference Schnaubelt2019; Liu et al., Reference Liu, Kababji, Mitsakakis, Pilgram, Walters, Clemons, Pond, El-Hussuna and Emam2025). In this study, the comparison across protocols functions as a diagnostic of sensitivity to evaluation design under data scarcity rather than as evidence of stable out-of-sample forecasting accuracy for macroeconomic outcomes.
The optimisation component also inherits structural limits from the modelling specification. In this application, expenditure in year t is mapped to outcomes observed in the same year t, a pragmatic choice in annual, aggregated “country-year” datasets and one that matches the data structure used in related hybrid applications (Valle-Cruz et al., Reference Valle-Cruz, Fernandez-Cortez and Gil-Garcia2022a). This specification does not represent lagged or dynamic policy effects. With N = 24, introducing lagged expenditure features would further reduce the effective sample while expanding the feature space, increasing sensitivity to specification choices and weakening interpretability.
The estimated relationships should therefore be read as contemporaneous associations on the dataset’s standardised scale, without support for claims about timing, transmission mechanisms, or causal impact. Because the objective function is computed on model-predicted outputs, scenario results remain conditional on predictive uncertainty; in hybrid decision-support work, this dependence can be addressed by explicitly incorporating robustness to prediction error in the optimisation stage (Jang, Reference Jang2019).
The paper’s limits also sit upstream of modelling, in data governance conditions that shape what can be assembled, checked, and compared. The public-sector AI literature points to recurring challenges in data acquisition and integration, discontinuities in record-keeping, and gaps in standardisation and documentation; where data quality is weak, model outputs can be distorted and may embed bias rather than reduce it (Zuiderwijk et al., Reference Zuiderwijk, Chen and Salem2021). In applied budgeting, these constraints determine the coherence and length of usable series and condition the degree of scrutiny that results can sustain, including through transparency sufficient for replication (Zuiderwijk et al., Reference Zuiderwijk, Chen and Salem2021).
In the Brazilian case examined here, function-level expenditure analysis is effectively confined to the period covered by the post-2000 functional classification. Earlier series cannot be integrated into the same analytical pipeline without reliable, publicly documented crosswalks that link successive taxonomies, preserve definitional continuity, and make explicit how each reclassification affects historical comparability. Where crosswalks, metadata, and version histories are incomplete, longitudinal analysis becomes sensitive to coding and harmonisation choices that are hard to audit, and apparent trends cannot be distinguished with confidence from artefacts produced by shifting labels and recording practices.
The same constraint extends to cross-country analysis: where budget systems use different functional taxonomies and accounting conventions, comparability relies on explicit crosswalks and transparent rules for aggregation and reconciliation. When series are short, or mappings are incomplete, apparent cross-national differences may reflect measurement and recording practices rather than substantive variation in allocation patterns.
This paper makes the workflow fully inspectable by releasing both the data and the code, and by packaging the approach as a reproducible pipeline. That design allows readers to audit preprocessing, modelling, validation, and optimisation choices and to compare iterations consistently (Budget_AI.br, 2026). It also enables cumulative improvement, for example by modularising the codebase, standardising evaluation routines, logging parameters and random seeds, automating data-quality checks, and documenting harmonisation rules. By stating limitations explicitly while keeping the implementation transparent, the study creates a practical basis for collaboration and reuse, extending the workflow’s value for applied budget analysis in the public sector.
6. Conclusion
This paper examined how a hybrid prediction–optimisation workflow can be used as an exploratory exercise for Brazilian federal budget allocation under severe data constraints. Using executed expenditure by budgetary function (2000–2023), the workflow first learns an empirical mapping between spending profiles and three macro indicators and then searches, within explicit bounds and penalties, for allocation vectors that maximise a stated objective function. In this sense, the workflow is used to organise scenario exploration and to make trade-offs explicit under a transparent set of modelling choices, rather than to generate prescriptive budget guidance.
The empirical results show that conclusions about model performance, and therefore about optimisation outputs, depend on how uncertainty enters and is evaluated in the pipeline. The augmented dataset remains close to the original series in central tendency and dispersion, with differences concentrated in the tails. Under internal cross-validation on the augmented dataset, predictive fit appears high, yet performance deteriorates materially under the anti-leakage protocol based on held-out real observations. These contrasts support a narrow interpretation: the workflow can produce scenarios for comparison, but the outputs remain conditional on the adopted augmentation strategy, the validation design, and the short annual series.
Within those conditions, the optimisation step succeeded in identifying an allocation that satisfies the objective function on the model’s standardised output scale, yielding GDP growth = 1.15, inflation = −0.04, and Gini index = −0.17. Because both inputs and outputs are expressed in z-scores, these values summarise direction and intensity relative to the historical distribution used in modelling, rather than nominal amounts or budget shares.
The study also indicates that the main binding constraint lies upstream of modelling, in the limits imposed by the available fiscal record for consistent longitudinal work. When function-level classifications change without reliable, publicly documented mappings that preserve comparability over time, the usable series shortens and results become more sensitive to harmonisation choices that are difficult to audit. This narrows what can be estimated credibly and constrains comparability across contexts.
Future research should strengthen the evidential basis of this exploratory workflow by (i) prioritising time-aware evaluation designs on real observations, (ii) benchmarking against simpler predictive baselines, and (iii) conducting robustness checks that isolate real test folds and include ablation and sensitivity analyses for augmentation choices, random seeds, and objective-function parameters (weights and penalties). Future work should also test external validity by applying the pipeline to other datasets, including those from other countries, while making harmonisation and crosswalk rules explicit where fiscal classifications differ. Future research should then examine lagged relationships, transmission mechanisms, and causal effects using data structures and identification strategies appropriate for causal inference.
Data availability statement
All scripts, trained models, intermediate outputs, and datasets used in this study are publicly available. A citable, archived version of the materials is deposited on Zenodo (Budget_AI.br, 2026).
-
• GitHub: https://github.com/Budget11340/Orcamentacao_Inteligente
-
• Zenodo (v1.1.0): https://doi.org/10.5281/zenodo.18405977.
Author contribution
S.O.N.: conceptualization, data curation, methodology, project administration; M.F.M.: supervision, validation, writing – review & editing; D.P.: formal analysis, methodology, supervision, validation, writing – review & editing; D.V.L.: conceptualization, supervision, writing – review & editing; G.R.N.P.: formal analysis, methodology, and validation.
Funding statement
This research did not receive any specific grant from funding agencies in the public, commercial, or not-for-profit sectors.
Competing interests
The authors declare that they have no known competing financial interests or personal relationships that could have appeared to influence the work reported in this paper.
Ethical statement
This study used only publicly available and aggregated data from official Brazilian government and World Bank sources. No individual-level, confidential, or personally identifiable information was accessed; therefore, no ethical approval was required.
Declaration of generative AI use
The authors declare that generative AI was used only for text refinement and code adjustments, and not for generating scientific content.


 Open access
Comments
No Comments have been published for this article.