

INTRODUCTION
Prenatal alcohol exposure is among the leading causes of mental retardation (National Institute on Alcohol Abuse and Alcoholism, 2000; Pulsifer, 1996). Despite the prevalence of the condition, this population is underdiagnosed and associated deficits are not fully understood. Increasing evidence confirms neurocognitive deficits in exposed individuals, even in the absence of facial dysmorphology and growth abnormality (e.g., Mattson et al., 1999; Streissguth et al., 1991) required for diagnosis of fetal alcohol syndrome (Bertrand et al., 2004; Hoyme et al., 2005; Jones & Smith, 1973; Jones et al., 1973; Stratton et al., 1996). Terminology has evolved to describe exposed populations with varying degrees of effects, focusing on the extensive and debilitating cognitive effects that may occur with such exposure. The nondiagnostic umbrella term, fetal alcohol spectrum disorders (FASD), will be used herein to describe individuals with central nervous system dysfunction and heavy prenatal alcohol exposure, with or without physical abnormalities (Bertrand et al., 2004).
Without physical markers, identifying the FASD population can be difficult, especially because information on prenatal alcohol exposure is often limited. Rather than relying on single neurobehavioral measures, differential diagnosis could improve with the identification of a consistent neurobehavioral profile in this population. Determination of such a profile requires improved delineation of the cognitive deficits (e.g., executive function) associated with FASD as well as comparison to other clinical groups. A recent study demonstrated the ability to accurately distinguish alcohol-exposed children from nonexposed controls with two commonly used measures, the Freedom from Distractibility index score from the Wechsler Intelligence Scale for Children-Third Edition and the Attention Problems scale from the Child Behavior Checklist (Lee et al., 2004). Using these measures, over 90% of children were correctly classified. Thus, it is possible to clinically distinguish children with FASD from nonexposed children based on neurocognitive performance.
The ability to distinguish children with FASD from other clinical groups has not been adequately tested. Children with FASD often have comorbid attention-deficit/hyperactivity disorder (ADHD) and, therefore, are likely to present clinically with symptoms of hyperactivity, attention deficits, impulsivity, and perseveration (Fryer et al., 2007; Steinhausen et al., 1993). A recent investigation examining psychopathological outcomes in a clinically referred sample found that 95% of alcohol-exposed individuals have a comorbid ADHD diagnosis (Fryer et al., 2007). Because the attention deficits and hyperactivity in children with FASD often overlap with those seen in nonexposed children diagnosed with ADHD (American Psychiatric Association, 1994), differential diagnosis between these two groups can be challenging. In addition, there has been a recent impetus to improve diagnostic specificity of ADHD. Due to the heterogeneity of the currently defined disorder and comorbidity with other clinical disorders, ADHD may be better conceptualized as a group of conditions with different etiologies (Spencer, 2006). Identifying alcohol-exposed individuals as one subgroup of ADHD would provide valuable information toward this conceptualization.
The only two studies comparing children with FASD to those with ADHD or Attention Deficit Disorder (ADD) have had somewhat conflicting results (Coles et al., 1997; Nanson & Hiscock, 1990). One study found that children with FASD and ADD had similar attention deficits when assessed by parental report or by impulsive errors on computer-based tasks, although FASD children performed more slowly than controls and ADD participants responded more quickly than controls (Nanson & Hiscock, 1990). The second study showed that children with a primary diagnosis of ADHD were more impaired than children with FAS on behavior checklists and measures of focused and sustained attention, while children with FAS were more impaired on visual–spatial tasks, encoding of information, and flexibility in problem solving (Coles et al., 1997). Therefore, participants with FAS and participants with ADHD had distinct neuropsychological profiles and could be distinguished from one another on attention measures. The latter study also included a measure of executive function on which children with FAS were more impaired than children with ADHD (Coles et al., 1997).
The shared behavioral disinhibition and attention deficits associated with FASD and ADHD may be related to a deficit in executive function (EF). Neuropsychological measures of EF assess organization, planning, working memory, inhibition of inappropriate responses, and set-shifting (Bennetto & Pennington, 2003). Converging evidence suggests EF is a core deficit in both FASD (Kodituwakku et al., 1995, 2001; Mattson et al., 1999; Schonfeld et al., 2001) and ADHD (Barkley, 1997; Lawrence et al., 2004; Nigg, 2005; Romine et al., 2004; Willcutt et al., 2005). In addition, evidence from neuroimaging studies shows that FASD and ADHD children have structural and functional abnormalities in frontal–subcortical circuits (Durston et al., 2003; Riley et al., 2004), which are brain areas associated with EF (Posner, 1994). Finally, behavioral data suggest that FASD and ADHD populations show deficits in global adaptive abilities associated with EF. For example, individuals with FASD demonstrate maladaptive social behaviors, including failure to consider consequences and impaired understanding of social cues (Streissguth et al., 1991). Similarly, behavioral characteristics in children with ADHD (impulsivity, poor planning and judgment, distractibility) have been compared with those seen in persons with frontal lobe damage (Scheres et al., 2004). Thus, EF appears to be a core deficit in both populations. It should be noted, however, that some research suggests that EF impairment in ADHD may be associated only with response inhibition and not set-shifting dimensions (Bennetto & Pennington, 2003; Pennington & Ozonoff, 1996), and some studies find inconsistent or no significant neuropsychological deficits for ADHD on EF measures (Geurts et al., 2005).
Relatively more information is available on overall intellectual functioning in these two populations. In studies of FASD, IQ scores range from 20 to 120, with an average between 65 and 72 (Mattson et al., 1998), although nondysmorphic individuals tend to have slightly higher IQ scores than dysmorphic individuals (Mattson et al., 1997). Studies of ADHD typically report distributions of IQ similar to those seen in the general population (Schuck & Crinella, 2005), which overlaps with the upper end of the IQ range in FASD. Thus, integrating IQ scores with measures of other functional domains is useful in determining relative strengths and weaknesses. Comparing neuropsychological performance of children with FASD and children with ADHD may also assist in differentiating effects due to alcohol exposure from those secondary to attention deficits.
A better understanding of the nature and pattern of EF in children with FASD and how it relates to EF deficits seen in children with ADHD may improve differential diagnosis by contributing to the development of a neurobehavioral profile for each group, leading to early intervention and better outcomes. In the current study, we compared performance of children with FASD and children with ADHD on three well-known measures of EF: the Wisconsin Card Sorting Test (WCST; Heaton et al., 1993), the Controlled Oral Word Association Test (COWAT; Strauss et al., 2006), and the Trail Making Test (TMT; Strauss et al., 2006). EF deficits were anticipated in ADHD and FASD groups, but the pattern of these deficits was expected to differ, with greater and more diffuse EF deficits in the FASD group than in the ADHD group. In addition to overall group comparisons, comparisons of specific measures were selected to allow for isolation of EF from other task components. Specifically, we compared letter versus category fluency and TMT-B versus TMT-A, because in each case, the former is a more taxing measure of EF than the latter (Lezak et al., 2004). Finally, WCST and IQ scores were compared to examine the relationship between EF and general intellectual ability. This measure was chosen for comparison with IQ because of the availability of standard scores for the WCST and a sufficient sample size within our investigation. Based on previous findings as outlined above, we hypothesized that deficits in EF would be observed both in children with FASD and in unexposed children with ADHD. We further hypothesized that the children with FASD would show greater relative deficits in letter versus category fluency and on the TMT-B versus TMT-A than children with ADHD, but that relative deficits on the WCST compared with IQ would be greater in the ADHD group.
METHOD
General Methods
Three groups of children were included in this study: children with heavy prenatal alcohol exposure (ALC), nonalcohol-exposed children with ADHD (ADHD), and a control group of children with neither prenatal alcohol exposure nor ADHD (CON). All children were recruited as part of a larger ongoing study of the behavioral teratogenicity of alcohol. As part of this larger study, alcohol-exposed and nonexposed children are assessed using a variety of neuropsychological, cognitive, and behavioral measures (cf., Mattson et al., 2006; Mattson & Roebuck, 2002). Alcohol-exposed children are recruited into this larger study via several mechanisms, including professional- or self-referral. The subset of alcohol-exposed children included in this investigation was selected so that the group met DSM-IV (1994), Fourth Edition, criteria for ADHD and was matched to the nonexposed ADHD group on age, sex, and race/ethnicity. Nonexposed participants are recruited from the community via advertising at various agencies and child-related venues and word of mouth. While children with ADHD were not specifically targeted for recruitment, all children are screened for this diagnosis and nonexposed children who met diagnostic criteria for ADHD and subsequently enrolled were included in the ADHD group in the current study. Following informed consent and assent, children are administered a battery of neuropsychological tests, including measures of general intelligence, language, learning, memory, visual–spatial and visual–motor ability, motor performance, academic performance, and executive function. The specific measures included in the current study are described below. For the ALC group, teratogenic exposure history was determined through multisource collateral report, including review of available medical, social service, and adoption agency records and maternal report, when available. Direct maternal report generally was not available as many children with heavy prenatal alcohol exposure no longer reside with their biological families. To be considered for inclusion in the ALC group, maternal consumption of at least 4 drinks per occasion at least once per week or 14 drinks per week during pregnancy was required. The majority of children in the control and ADHD groups reside with their biological mothers. Therefore, teratogenic exposure in these groups was determined through direct maternal report. Mothers of these children reported little (i.e., <1 oz AA/day before pregnancy recognition) alcohol use during pregnancy.
Children in the ALC group were evaluated by a dysmorphologist with expertise in FAS. Exams are based on physical measurements (e.g., growth, head circumference), craniofacial structure analysis (e.g., palpebral fissures, philtrum), alcohol exposure history, and historical record review. Of the 20 alcohol-exposed children in the study, 10 met criteria for FAS, whereas 10 had heavy prenatal alcohol exposure without meeting full diagnostic criteria for FAS.
ADHD diagnoses were determined through parent interview for all children. Two measures were used, either the computerized NIMH Diagnostic Interview Schedule for Children (Shaffer et al., 2000) or the Schedule for Affective Disorders and Schizophrenia for School Aged Children: Lifetime Version Interview (Kaufman et al., 1997). A previous study comparing these measures in an epidemiological sample demonstrated moderate agreement (Cohen et al., 1987). Most alcohol-exposed children who participate in our ongoing research program have comorbid ADHD diagnoses (Fryer et al., 2007). None of the children in the CON group met criteria for ADHD, nor did their parents report any concerning behavioral problems upon enrollment in the study. All procedures were approved by the Institutional Review Board at San Diego State University.
Participants
Sixty children (7–13 years of age) participated in this study. Twenty children were included in each group, and groups were matched on age, sex, and race/ethnicity. At the time of initial recruitment, 25% of children in the ADHD group and 35% of children in the ALC group were taking stimulant medications.
Measures
Three measures of executive function were selected from a larger battery of neuropsychological tests: the WCST, COWAT, and TMT. Test protocols were administered and scored using standard procedures and normative data as available. Performance on the WCST was evaluated in terms of five standard scores (%Errors, %Perseverative Responses, %Perseverative Errors, %Nonperseverative Errors, and %Conceptual Level Responses). Only children 8 years of age and older were administered the TMT as follows: 10 CON, 8 ADHD, and 18 ALC. All children were assessed for general levels of functioning (Full Scale IQ, FSIQ) using the Wechsler Intelligence Scale for Children–Third Edition.
Statistical Analyses
Demographic information
Demographic data were analyzed using χ2(sex, race/ethnicity, handedness) or analysis of variance (ANOVA) techniques (age, FSIQ, and socioeconomic status as measured by Hollingshead). Significant group differences were followed up with pairwise comparisons.
Executive functioning
Data from the three EF tests were analyzed separately using standard scores for the WCST and TMT and raw scores (due to the age range tested) for the COWAT. A multivariate ANOVA (MANOVA) was used for the analysis of the multiple measures of the WCST to examine overall WCST performance. ANOVA with group (ALC, ADHD, CON) as the between-subjects variable was used for COWAT and TMT analyses. Because raw scores were used for the COWAT analysis and preliminary analysis failed to reveal differential effects of age across the three groups, age at time of testing was included as a covariate. Variance ratios for the TMT were examined between the reduced sample groups and values were not appreciably different; therefore, the reduced sample TMT analyses were appropriate. Significant group differences were followed up by pairwise comparisons.
Measure contrasts
To examine group differences in test contrasts (i.e., TMT-A vs. TMT-B, WCST vs. IQ, and letter vs. category fluency), repeated measures ANOVAs were conducted with test score as the within-subject factor and group as the between-subjects factor. For these analyses, the WCST was defined as the average of the 5 WCST scores. Preplanned comparisons of the within-group contrasts were also carried out as justified by the expectation of interscore differences in each clinical group and the absence of such differences for the controls. To the extent that IQ is comprised, in part, of measures of EF, controlling for this variable would have removed variance of interest. For this reason, IQ was not included as a covariate in analysis.
RESULTS
Demographics
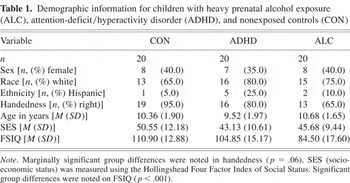
The groups were similar on demographics; there were no significant group differences in sex or race/ethnicity distributions, socioeconomic status, or age. The groups were marginally different on handedness (p = .060); fewer children in the ADHD and ALC groups were right handed. In addition, the groups differed on FSIQ [F(2,57) = 16.26; p < .001], and pairwise comparisons indicated that, as expected, the mean FSIQ score of the ALC group was lower than the other two groups (p < .001), which did not differ from each other (p = .217). See Table 1.
Demographic information for children with heavy prenatal alcohol exposure (ALC), attention-deficit/hyperactivity disorder (ADHD), and nonexposed controls (CON)
Group Differences
Results of analysis of the WCST using MANOVA revealed an overall effect of group [Pillai's F(10,108) = 2.24; p = .021]. Univariate group comparisons on each of the component WCST measures were also significant for all five scores (p < .05). Pairwise comparisons revealed that on all measures, the CON group performed better than the ALC (p < .01) and the ADHD (p < .05) groups, which did not differ from each other (p > .10). See Figure 1.
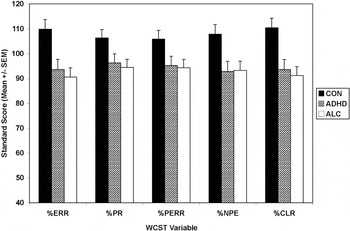
Comparison of Wisconsin Card Sorting Test (WCST) performance of children with heavy prenatal alcohol exposure (ALC, n = 20), attention-deficit/hyperactivity disorder (ADHD, n = 20), and nonexposed controls (CON, n = 20). Variables displayed are percent errors (%ERR), percent perseverative responses (%PR), percent perseverative errors (%PERR), percent nonperseverative errors (%NPE), and percent conceptual level responses (%CLR). Data are presented as mean ± standard error of the mean (SEM).
Using ANCOVA, pairwise comparisons indicated that, for letter fluency, the ALC group performed more poorly than both the ADHD and CON groups (p < .05) and the ADHD group performed marginally worse than the CON group (p = .052). On category fluency, the ALC group performed worse than the ADHD group (p = .012) and marginally worse than the control group (p = .059). See Figure 2.
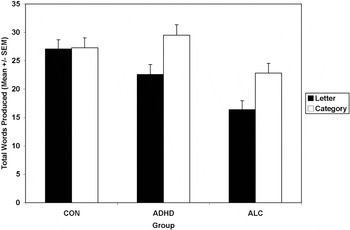
Fluency performance for children with heavy prenatal alcohol exposure (ALC, n = 20), attention-deficit/hyperactivity disorder (ADHD, n = 20), and nonexposed controls (CON, n = 20). Data are presented as mean ± standard error of the mean (SEM).
Pairwise comparisons indicated that none of the groups differed on TMT-A (p > .10) and on TMT-B, and only the ALC group differed from the CON group, with CON significantly better than ALC (p = .023). No other group differences were apparent (p > .10). See Figure 3.
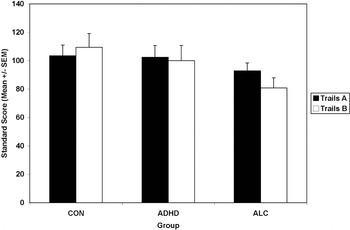
Trail Making Test performance in children with heavy prenatal alcohol exposure (ALC, n = 18), attention-deficit/hyperactivity disorder (ADHD, n = 8), and nonexposed controls (CON, n = 10). Data are presented as mean ± standard error of the mean (SEM).
Measure Contrasts
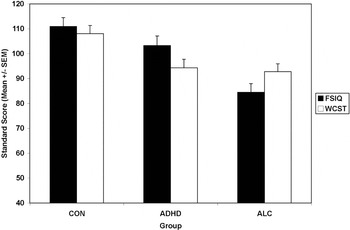
The Group × Test interaction was significant for the WCST versus IQ contrast [Pillai's F(2,57) = 7.32; p = .001]. Preplanned comparisons indicated that, for both the ALC and ADHD groups, WCST composite scores were significantly different from IQ scores. However, they differed in opposite directions: for the ALC group, WCST > IQ (p = .019) while for the ADHD group, WCST < IQ (p = .004). The CON group's WCST scores did not differ significantly from IQ (p > .10). See Figure 4. Additional analyses comparing the arithmetic difference between FSIQ and WCST composite revealed a main effect of group [F(2,57) = 7.32; p = .001] and pairwise comparisons indicated that the ALC group was significantly different from the CON group (p = .049) and the ADHD group (p < .001). The ADHD group and CON group were marginally different (p = .075).
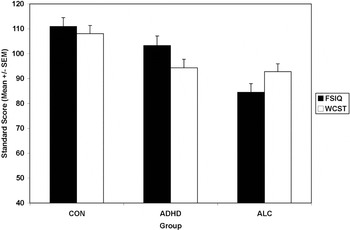
Comparison of FSIQ score and Wisconsin Card Sorting Test (WCST) composite score for children with heavy prenatal alcohol exposure (ALC, n = 20), attention-deficit/hyperactivity disorder (ADHD, n = 20), and nonexposed controls (CON, n = 20). Data are presented as mean ± standard error of the mean (SEM).
The Group × Test interaction for letter versus category fluency on the COWAT was also significant [Pillai's F(2,56) = 3.82; p = .028]. Both the ALC and ADHD groups demonstrated poorer performance on letter than category fluency (p < .005), whereas for the CON group, category and letter fluency were not significantly different (p > .10).
The Group × Test interaction for the TMT-A versus TMT-B contrast was marginally significant [Pillai's F(2,33) = 2.74; p = .079]. The main effect of Group was also nonsignificant [F(2,33) = 2.18; p = .129]. For the ALC group, TMT-A performance was significantly better than TMT-B performance (p = .014), although this difference was not seen in the CON or ADHD groups (p > .10).
DISCUSSION
We examined performance on three EF tasks in three groups of children: children with histories of heavy prenatal alcohol exposure and a diagnosis of ADHD, children with ADHD but without a history of alcohol exposure, and typically developing controls. Our results indicate that a history of heavy prenatal alcohol exposure or a diagnosis of ADHD without alcohol exposure influences performance on EF tasks. In addition, alcohol-exposed children display different patterns of functioning from both nonexposed children with ADHD and controls. In comparison to typically developing controls, our alcohol-exposed group displayed deficits on all tasks except for TMT-A, although the group difference on category fluency was only marginally significant (p = .059). These deficits are consistent with previous reports of deficits on the WCST (Carmichael Olson et al., 1998; Connor et al., 2000; Kodituwakku et al., 1995), verbal fluency (Kodituwakku et al., 1995; Mattson & Riley, 1999; Schonfeld et al., 2001), and trail making (Mattson et al., 1999) in this population. In addition, the ALC group displayed significantly poorer performance on letter fluency than category fluency, which is consistent with previous findings suggesting that letter fluency is better than category fluency at discriminating children with FASD from controls (Kodituwakku et al., 1995; Mattson & Riley, 1999).
In comparison to typically developing controls, children in the ADHD group displayed deficits on the WCST and on letter fluency, although this latter group difference was only marginally significant (p = .052). Although WCST deficits have been reported in studies of ADHD, results are not consistent. For example, according to one meta-analysis of several EF tests, 46% of studies examined found significant differences between controls and ADHD participants on WCST perseverative errors (Willcutt et al., 2005). Effect sizes for those studies reporting significant results were in the medium range, and ADHD participants had consistently poorer performance than controls. However, another meta-analysis examining the specificity and sensitivity of the WCST in childhood disorders found that, across all studies reviewed, individuals with ADHD demonstrated fairly consistent deficits on all of the WCST measures (Romine et al., 2004).
Existing results regarding verbal fluency in ADHD populations are also mixed. Some studies have found impairments on letter verbal fluency tasks (Barkley et al., 1992; Grodzinsky & Barkley, 1999; Pineda et al., 1999), whereas others have found no significant group differences (Barkley et al., 2001). In contrast, the majority of studies including category fluency indicate no significant group differences between ADHD and control participants (Barkley et al., 1992; Pineda et al., 1999). Thus, the current results are in line with some but not all prior findings. However, as in the ALC group, the ADHD group had poorer performance on letter fluency than category fluency, which is consistent with previous reports in this population (Sergeant et al., 2002).
The performance of the ADHD group was similar to that of the CON group on the TMT, which is consistent with most previous reports (Grodzinsky & Barkley, 1999; Tripp et al., 1999). Although some previous research suggests that ADHD participants have poorer performance on TMT-B, results are not overwhelming and suggest that visual–motor sequencing and set-shifting, as measured by TMT-B, may not be especially impaired in ADHD individuals. However, when compared with WCST findings, meta-analytic results of studies using TMT-B yielded larger and more consistent significant effect sizes distinguishing ADHD performance from controls (Willcutt et al., 2005), with 57% of studies reporting significant group differences.
Similarities and differences were noted between the two clinical groups in this study. Both groups displayed similar deficits on the WCST and had worse letter than category fluency. However, the levels of their fluency performances differed significantly (ALC < ADHD), and they had different patterns of performance on the TMT-B when compared with controls (ALC < CON = ADHD). The finding of poor performance in both clinical groups on the WCST, which requires integration of several parallel and higher order demands (e.g., working memory, attention, visual–spatial ability) may indicate that the task is challenging and sensitive to EF impairment in these populations. One previous study (Coles et al., 1997) compared these two groups on the WCST, and deficits occurred in the dysmorphic alcohol-exposed group but not the ADHD group. Groups included in this study were relatively matched on IQ. Unfortunately, only raw data were presented, making direct comparison to our results impossible. Our data suggest that performance on this task is similar between these two groups, despite differences in overall intellectual ability, which is not consistent with the previous findings (Coles et al., 1997). Different results may be related to unique sample characteristics. Continued investigations along a spectrum of exposure and with diverse populations will hopefully clarify this issue.
Both groups demonstrated the same pattern of performance on fluency tasks, with letter fluency significantly weaker than category fluency. These findings support previous reports that letter fluency is a more sensitive indicator of impairment than category fluency in both groups and can be used to distinguish affected individuals from typically developing controls. Letter fluency is thought to be a more difficult measure of EF than category fluency, lacking the structure present in category fluency (Lezak et al., 2004). In adult populations, there is support for greater brain activation in temporal regions during category fluency tasks, and greater involvement in frontal regions during letter fluency tasks (Baldo et al., 2006; Gourovitch et al., 2000). Thus, the finding of relatively worse letter than category fluency suggests children with ADHD and FASD may have more difficulty with less-structured verbal tasks, possibly due to more significant brain abnormality in the frontal lobe relative to the temporal lobe. However, in comparison to controls, the ALC group, but not the ADHD group, was impaired on category fluency, although the difference in the ALC group was marginally significant, suggesting the possibility of additional abnormalities in temporal regions in alcohol-exposed children. Similarly, only the ALC group was impaired on TMT-B and performance was significantly weaker than performance on TMT-A. The ADHD group was not impaired on either TMT task. Adult neuroimaging studies have demonstrated that psychomotor set-switching ability required in the TMT-B is mediated by the frontal lobes (more left than right; Segalowitz et al., 1992; Zakzanis et al., 2005) as well as the left middle and superior temporal gyrus (Zakzanis et al., 2005) when compared with TMT-A task completion. Therefore, deficits on the TMT-B seen only in the ALC group may be a result of more specific left frontal damage and temporal lobe abnormality. However, these investigations focused on adult populations. Focusing on child clinical populations using neuroimaging to examine COWAT and TMT performance may illuminate underlying brain regions involved in each task. If supported by future research, differences in performance on category fluency and TMT-B may prove useful in distinguishing children with FASD from nonexposed children with ADHD. Another possible explanation for the less consistent finding of EF dysfunction for the ADHD group in this investigation is that children with ADHD may be relatively more heterogeneous in EF performance than children with FASD (i.e., some impaired and some proficient; Nigg et al., 2005). These findings may also be related to the recruitment of children with ADHD from the community rather than from clinics. Future investigations with larger sample sizes may consider the possibility of substantive subgroups of ADHD based on performance on EF measures.
Another important difference between the ALC and ADHD groups was evident in the comparison between IQ and WCST performance. Although the groups displayed similar impairment, WCST performance of the ALC group was significantly better than predicted by IQ, whereas in the ADHD group, the opposite was true. Other studies in alcohol-exposed children and adults have reported EF deficits that remain after IQ is controlled or that are worse than predicted based on IQ deficits (Carmichael Olson et al., 1998; Connor et al., 2000; Kerns et al., 1997; Schonfeld et al., 2001). Although the reason for these conflicting results is unclear, it may be due to task or sample differences. Some studies of EF performance in ADHD populations have found that deficits remain after controlling for IQ, suggesting that certain EF deficits cannot be explained by IQ (Willcutt et al., 2005). Our finding of relatively worse EF than predicted by IQ scores in children with ADHD provides additional support for the finding that EF dysfunction, as measured by the WCST, may be a “primary deficit” in ADHD individuals.
The relationship between diminished IQ and EF dysfunction is unclear and a matter of current debate. Although some research suggests a modest association between intelligence and executive function (Duncan et al., 1996; Schuck & Crinella, 2005), the overlap in function changes over time as EF continues to develop through early adulthood. The relationship is more complex in clinical disorders, when EF and/or IQ are impaired. Some researchers suggest that, to define a “primary deficit” within a clinical population, the deficit must exist after controlling for IQ as well as other confounding variables (Engle et al., 1999; Willcutt et al., 2005). However, some of these authors also emphasize that deficits in EF may directly diminish IQ scores and so controlling for IQ in these cases may inappropriately remove variance explained by EF (Willcutt et al., 2005). Of interest, some research on ADHD suggests that discriminability of EF measures may change with varying levels of IQ; for example, differences in EF seen at average levels of intelligence were less apparent at high IQ levels (e.g., Mahone et al., 2002). Future research comparing EF performance in clinical groups matched on IQ might add important information to this debate.
Neuroimaging findings of affected brain areas in children with FASD and ADHD suggest that brain regions associated with EF are abnormal in each population. Children with ADHD have been found to have subtle overall volumetric reductions, with more pronounced abnormalities in the right frontal lobe and caudate nucleus (Filipek et al., 1997; Semrud-Clikeman et al., 2000). The limited brain imaging research on individuals with FASD suggests that the caudate nucleus (Archibald et al., 2001) and frontal lobes (Sowell et al., 2002) are affected. Therefore, both populations have shown impairments in the frontal–subcortical circuitry, which has been associated with executive function (Casey et al., 2002). However, individuals with FASD have also shown significant alterations in more diffuse areas including parietal and temporal lobes (Archibald et al., 2001; Sowell et al., 2001) and corpus callosum (Bhatara et al., 2002; Riley et al., 1995), which may explain greater overall deficits in children with alcohol exposure and different patterns of EF between the two groups. There have been no direct comparisons in neuroimaging studies of FASD and ADHD groups. Such a study would provide valuable information regarding possible neuropathological bases of the observed behavioral deficits.
Limitations
Sample sizes prohibited a comparison of ADHD subtypes in this study. Some research suggests that ADHD subtypes may have different neuropsychological performance (Houghton et al., 1999; Lockwood et al., 2001); however, other results suggest that combined and inattentive subtypes do not differ on most domains of EF (Nigg et al., 2002). Larger sample sizes may also allow for greater statistical power to detect group differences. While the marginal Group × Test omnibus interaction in the TMT analyses were followed up with specific planned comparisons in these analyses, replication is necessary to determine whether this is a robust effect. In addition, it is possible that a subset of alcohol-exposed individuals would have ADHD independent of exposure due to other factors (e.g., genetics). However, the high comorbidity of alcohol exposure and ADHD suggests a larger risk and a direct relationship between alcohol exposure and attention deficits (Fryer et al., 2007). In addition, analyses to compare difference scores of TMT and fluency abilities to IQ ability were not conducted. It is possible that patterns of scores observed in the groups on these measures could be attributed to differences in IQ scores. Future investigations including IQ comparisons could clarify this issue. Finally, the frontal lobes and related executive abilities develop through adulthood, and the exact nature of this trajectory in typical or clinical child populations is unknown. Thus, additional research, perhaps of a longitudinal nature, might provide further insight.
Future Directions
These results may assist in diagnostic specificity of alcohol-exposed versus unexposed children with ADHD by contributing information on EF to emerging neurobehavioral profiles for each population. Direct comparison between similar clinical groups on EF measures demonstrates how patterns of performance may assist in differential diagnosis. For example, whereas exposed and unexposed children with attention deficits may be difficult to distinguish by subjective behavioral measures, the unique patterns of performance reported here may assist in distinguishing alcohol-exposed children from nonexposed children with ADHD in a clinic setting. Specifically, although both groups met clinical criteria for ADHD, the alcohol-exposed children displayed impairments on the WCST smaller than expected based on IQ, and impairments in the letter fluency and TMT-B tasks. In contrast, children in the ADHD group displayed deficits on the WCST greater than expected based on IQ, and no fluency or trail making deficits. Both groups displayed weaker letter fluency than category fluency as well as generally reduced WCST performances. Neither group was impaired on TMT-A. Within the research community focusing on FASD, there is an impetus to define a specific profile of functioning (Riley et al., 2003). Identification of affected individuals should not hinge on a particular test or even one cognitive function, but will be improved by comparing clinical populations across functional domains. Although these data provide important information that will help define this functional profile, further research to replicate current findings, to compare profiles of performance across ADHD subgroups, and to determine other possible sensitive diagnostic measures is recommended.
ACKNOWLEDGMENTS
The authors thank the members of the Center for Behavioral Teratology and the families who graciously participate in our studies. This manuscript and information included in this manuscript have not been previously published, electronically or in print. Research was supported by NIAAA Grants R01 AA010820, R01 AA010437, and T32 AA013525.