


1. Introduction
This paper provides new estimates of Mexican incomes and the distribution of incomes for the years 1895, 1910, 1930 and 1940. Mexico is important in itself, as both the second most populated country and second-biggest economy in Latin America. Moreover, the country is also a captivating case study for the debate on inequality, where factors such as industrialisation (Kuznets, Reference Kuznets1955) and political revolutions (Piketty, Reference Piketty2014; Scheidel, Reference Scheidel2017)—both of which occurred in Mexico during the period under study—play a major role. From the state-led liberal modernisation of the 1860s to the complex Revolution of the 1910s—marked by contradictory forces but centred on the crucial struggle over land ownership—the analysis of this period of Mexican economic history offers a compelling insight into political economy dynamics.
New archival work allows us to present fine-grained estimates of incomes per social group in Mexico in these years, involving eighteen groups over the entire 1895-1940 period. Therefore, our study presents long-run income inequality in a much more comprehensive way than previous analyses which have relied on social tables of four groups (Arroyo Abad and Astorga Junquera, Reference Arroyo Abad and Astorga Junquera2017), on body heights (López-Alonso, Reference López-Alonso2015) and wages alone (Bleynat et al., Reference Bleynat, Challú and Segal2021).
Our results indicate that in the late 19th century income inequality was relatively high; with a Gini coefficient of 0.52 in 1895, which increased to 0.57 in 1910. There was a break associated with the Revolution, during which the Gini coefficient decreased to 0.54 in 1930, before rising again to 0.62 in 1940. Our quantitative results for the 1930s are somewhat surprising, showing rising inequality during the more egalitarian period of the Revolution's land reforms. These results, however, are in line with the social and political history literature on the Revolution's achievements and shortcomings (Wasserman, Reference Wasserman1993; Joseph and Buchenau, Reference Joseph and Buchenau2013).
The equalisation that emerged from the Revolution was propelled mainly by developments in the agrarian sector that led to redistribution from hacienda owners to peasants. Meanwhile, the urban sector witnessed much less consistent redistribution. The combination of uneven income growth between industry and agriculture along with a growing informal sector in the 1930s increased income inequality once again. This indicates that the Revolution did not achieve lasting equalisation.
Over the long run, combining our results for 1895-1940 with previous research on the post-1950 period, we find that income inequality in Mexico has remained consistently stable since the late 19th century. While there are many fluctuations, there is no overall trend. We discuss this lack of 20th-century equalisation in relation to our interpretation of the Mexican Revolution and its legacies.
2. The Mexican case
Our investigation begins with the modernising and so-called «positivist» oligarchical dictatorship of Porfirio Diaz, who had led the country since 1877. The efforts to integrate Mexico into the global economy and begin the industrialisation process were not unique to Mexico as many Latin American countries were pursuing similar goals during that period (Bértola and Ocampo, Reference Bértola and Ocampo2012, pp. 102-104).
As railroads were built and the domestic market became more integrated, the state grew stronger vis-à-vis local power brokers. However, Mexico's economy functioned as an oligarchical system characterised by monopoly rents and the repression of labour organisations (Haber, Reference Haber1989, Reference Haber, Bortz and Haber2002; Beatty, Reference Beatty, Bortz and Haber2002; Bortz, Reference Bortz, Bortz and Haber2002; Kuntz, Reference Kuntz, Bortz and Haber2002). Earlier literature has pointed to the widespread growth of inequality during this period. One frequently cited finding indicates that real wages in 1910 were only one-fourth of what they had been in 1810, despite the industrial growth that took place under Porfirio Díaz (Burns, Reference Burns, Burns and Skidmore1979, pp. 72-74). Newer research on wages has corrected this picture of the Díaz period, finding instead that wages stagnated (Challú and Gómez-Galvarriato, Reference Challú and Gómez-Galvarriato2015; Arnaut, Reference Arnaut2018). Meanwhile, overall inequality appears to have grown, as evidenced by López-Alonso's (Reference López-Alonso2015) finding of rising class disparities in body height and by Bleynat et al.'s (Reference Bleynat, Challú and Segal2021) finding that wages grew more slowly than GDP.
Another important study that shows severe inequality at the end of the Díaz regime is Arroyo Abad and Astorga Junquera's (Reference Arroyo Abad and Astorga Junquera2017) social table study, which categorises four broad social groups. Their findings indicate that income inequality remained stable from the 1830s to 1910, with a wage Gini coefficient ranging from 0.40 to 0.45. This level of inequality is significantly higher than what they observed in Argentina and Chile during the same period and somewhat higher than in Colombia and Venezuela.
The Díaz regime was marked by numerous internal contradictions. Although the regime believed that large-scale capitalist farming would be beneficial, the privatisation of communal lands adversely affected peasants' subsistence. Conflicts between workers and employers, particularly in the northern mines, intensified in the early 1900s. Additionally, various regional powerbrokers and interest groups were also dissatisfied with the ageing dictator.
In 1910, the various sources of discontent coalesced, leading to the collapse of the regime and the emergence of a vacuum that triggered a 10-year power struggle. The new president, Francisco I. Madero, though is not significantly different from Diaz. In contrast, other revolutionary factions, such as Pancho Villa's and Emiliano Zapata's agrarian movements, pursued much broader social ambitions (Katz, Reference Katz1998, pp. 267-292; Womack, Reference Womack1970, pp. 394-404; Joseph and Buchenau, Reference Joseph and Buchenau2013, pp. 38-41).
The political history of the Revolution, with its myriad shifts in the presidency during the 1910s and 1920s, is far too complex to summarise here. What is relevant for our study is the role of inequality and power throughout this period. As the dominance of Villa's and Zapata's movements indicates, land reform was a powerful motivation for rural smallholders participating in the Revolution. In 1922, three million hectares of agrarian land were redistributed, followed by another five million hectares in 1925 (Joseph and Buchenau, Reference Joseph and Buchenau2013, pp. 5, 94, 98). Over the coming decades, a total of 56 million hectares were redistributed (Flores, Reference Flores1969, pp. 86-87).
Working-class mobilisation was another major aspect of the Revolution (Knight, Reference Knight1984; Dion, Reference Dion2010; Gómez-Galvarriato, Reference Gómez-Galvarriato2013). The Revolution brought about pro-worker reforms, notably Article 123 of the 1917 constitution, which allowed union organisation, collective bargaining and strikes (Joseph and Buchenau, Reference Joseph and Buchenau2013, p. 82). As one revolutionary leader argued in 1913, «We lack laws that favor workers and peasants; but these will be passed by them, since it is they who will triumph in this social and vindictive struggle» (Dion, Reference Dion2010, p. 54).
The traditional explanation for Latin America's status as the most unequal region in the world traces this inequality back to the colonial period (cf. discussion in Williamson, Reference Williamson2015). The emphasis on the enduring influence of colonialism, combined with the upheaval of the 1910-40 Revolution, poses an interesting question for the Mexican case: how much can a political revolution change economic inequality? Political historians have examined whether the Revolution succeeded in replacing the old ruling class of hacendados and industrialists with a new one (Wasserman, Reference Wasserman1993). Our investigation provides a parallel analysis of the economic impact of the revolution.
In this context, the analysis of economic inequality in Mexico between 1895 and 1940 is highly relevant. Our benchmarks cover interesting years: the 1895-1910 period is the latter part of the Porfirio Díaz era, associated with rapid growth in industry and exports, as well as increasing social polarisation. The 1910-1930 and 1930-1940 periods cover the core years of the Revolution, making them particularly pertinent for analysing inequality.
We connect our findings for 1895-1940 with existing research on inequality from 1950, when modern data sources on income distribution for Mexico become available. The extensive literature on economic inequality in Mexico since 1950 suggests that income inequality has been consistently high and increasing, with Gini coefficients ranging from 0.59 to 0.80 (Bustos and Leyva, Reference Bustos and Leyva2017; Campos-Vazquez et al., Reference Campos-Vázquez, Domínguez, Márquez, Bértola and Williamson2017; Reyes et al., Reference Reyes, Teruel and López2017). Our study adds historical depth to the discussion of Mexican inequality by offering a more detailed measurement than previously available, including the assessment of elite incomes. As Piketty (Reference Piketty2014) highlights, the analysis of elite incomes is crucial for understanding overall inequality.
3. Data, sources and methods
To reconstruct Mexican incomes and their distribution in a historical setting, we created social tables for the four benchmark years. The social table methodology involves constructing comprehensive datasets that include: (a) the distribution of the population across various economic groups, such as small farmers, estate owners, metal industry workers, etc. and (b) the average income for each group. The social table methodology is an essential tool for reconstructing income distribution series for periods before 1989, when survey data on Mexican incomes became available. It has been used extensively in research on Latin America (e.g. Bértola et al., Reference Bértola, Castelnovo, Rodríguez Weber and Wilebald2009; Arroyo Abad and Astorga Junquera, Reference Arroyo Abad and Astorga Junquera2017). In the Mexican case, the social table approach has been applied by Arroyo Abad and Astorga Junquera (Reference Arroyo Abad and Astorga Junquera2017), but our data are more detailed. While they assumed four broad social groups, we used eighteen, providing much more information on the incomes of the elites, such as hacienda owners, whose incomes are crucial for understanding overall inequality. In online Appendix D, we provide a detailed comparison of our results with theirs, as well as with an analysis of our data using a broad HISCO classification of social groups. These comparisons clearly demonstrate the advantage of the detailed social classification used in our study.
To construct the social tables for Mexico for the years 1895, 1910, 1930 and 1940, we began with the census data for these years (cf. Bértola et al., Reference Bértola, Castelnovo, Rodríguez Weber and Wilebald2009; Rodríguez Weber, Reference Rodríguez Weber2014, Reference Rodríguez Weber2016). We calculated incomes using a diverse range of primary and secondary sources. The methodology is discussed below and a more detailed presentation of the sources and approach can be found in online Appendix A.
3.1 Building the social tables
The first official census was conducted in 1895 by the General Directorate of Statistics (Dirección General de Estadística). Two additional censuses were carried out under the Díaz government, in 1900 and 1910. While the 1895 and 1910 censuses share the same structure, listing 149 occupational categories, the 1900 census differs by reporting more aggregated categories, making it less precise. Therefore, we prefer to use the 1895 and 1910 censuses. To align the social group calculations from these censuses with the income data, we consolidated the occupational categories into eighteen groups. This approach balances precision with feasibility.
The income data are obtained from the Institute of National Statistics, Geography and Information (INEGI) (2020), drawing on Fernando Rosenzweig's work (Reference Rosenzweig1965) and available in digital format. We complement this with salary information for bureaucrats and other professionals from the statistical yearbooks of 1893-1907, following Rodríguez Weber (Reference Rodríguez Weber2014, Reference Rodríguez Weber2016). Additionally, we include recruitment advertisements from private employers, such as those from the Engineers' School of Guadalajara (Escuela de Ingenieros de Guadalajara).
For top incomes—paid to the large landowner class, industrialists and merchant-financiers—we used a combination of primary and secondary sources. For the large landowners, the hacendados, we estimated their number to be around 830-850 men and their families. We assessed their incomes based on estimated returns to land, combining these estimates with biographical studies of very wealthy families, such as the Maderos (using their archive) and the Creels (using Wassserman's biographical study of 1985). Additionally, we consulted wills that detail the wealth of the hacendados (Castañeda Garza and Krozer, Reference Castañeda Garza and Krozer2023). For further details, see online Appendix A.
For the industrialists, known as bacerlonettes, we had to reconstruct their labour and capital incomes. To estimate labour income, we used Galán's work (Reference Galán2010), which provides salary data for owners of textile companies and stores in the state of Veracruz and in Mexico City. We then cross-checked this information with archives records from the Mexico City Historical Archive of Notaries (Archivo Histórico de Notarías de la Ciudad de México), which report salaries and firms' shares. Using the register of firms' shares and their owners, we calculated the value of capital. We then derived the capital income for this group by applying Haber's (Reference Haber1989) estimates of the rate of return on capital for leading Mexican firms from 1896 to 1938.
There are three important occupational groups for which data tend to be scarce: peasants (known as jornaleros), domestic employees and people without occupation. For peasants, we have relied on historical literature and agrarian censuses from 1930 and 1940 (see online Appendix A for details). For domestic workers, we used Goldsmith Corelly (Reference Goldsmith Corelly1992), which estimates wages paid to female domestic workers from the late 19th century to 1940.
The group «without occupation» is a significant portion of our social tables, comprising 29 per cent of the population in 1895 and 35 per cent in 1910Footnote 1. The treatment of this group is a debated issue in social table research. Some researchers, such as Bolt and Hillbom (Reference Bolt and Hillbom2016), include them, while others, including Gómez León and De Jong (Reference Gómez León and De Jong2019) and Rodríguez Weber (Reference Rodríguez Weber2014, Reference Rodríguez Weber2016), choose to exclude them.
As Gómez León and De Jong (Reference Gómez León and De Jong2019) argue, including the group people without occupation might lead to double counting people who live on family income, such as schoolchildren and spouses, potentially overstating inequality. Conversely, excluding them overlooks a significant portion of the population and, since we cannot distinguish between the truly unemployed and those double-counted, it might lead to an underestimation of inequality.
To address this issue, we generated two sets of estimates: one including people without occupations and one excluding them. This approach provides a lower bound (without including those without occupations) and an upper bound (including those without occupations) for inequality levels. We prefer the upper bound estimates, as they offer a more comprehensive view.
For imputing monetary income to the subsistence class (those without occupation) in 1895 and 1910, we followed Milanovic et al. (Reference Milanovic, Lindert and Williamson2011), assuming a subsistence yearly income level of 400 dollars equivalent to the 1990 value in pesos at that time.Footnote 2 This very low standard of living for a rather large share of the population seems reasonable given the evidence on body heights and material consumption (López-Alonso, Reference López-Alonso2007, Reference López-Alonso2015; Challú and Gómez-Galvarriato, Reference Challú and Gómez-Galvarriato2015).
The social group sizes and incomes are presented in Table 1. The column «population share» reveals that the peasants, or jornaleros Footnote 3, were a significant 43 per cent of the population in 1895 and 39 per cent in 1910. This indicates that agrarian sector inequality and the status of peasants are crucial for understanding overall inequality. By comparison, manufacturing workers made up 9 per cent of the population in both years—an important figure but still underscoring the agrarian sector's dominance in the Mexican economy during this period. In online Appendix C, we cross-check our income estimates with GDP per capita estimates from the Maddison project. This comparison demonstrates that our assumptions for groups without actual income data are reasonable, as the GDP per capita estimates derived from our social tables align closely with those from the Maddison project, despite the different methodologies used.
Social tables: 1895, 1910, 1930 and 1940
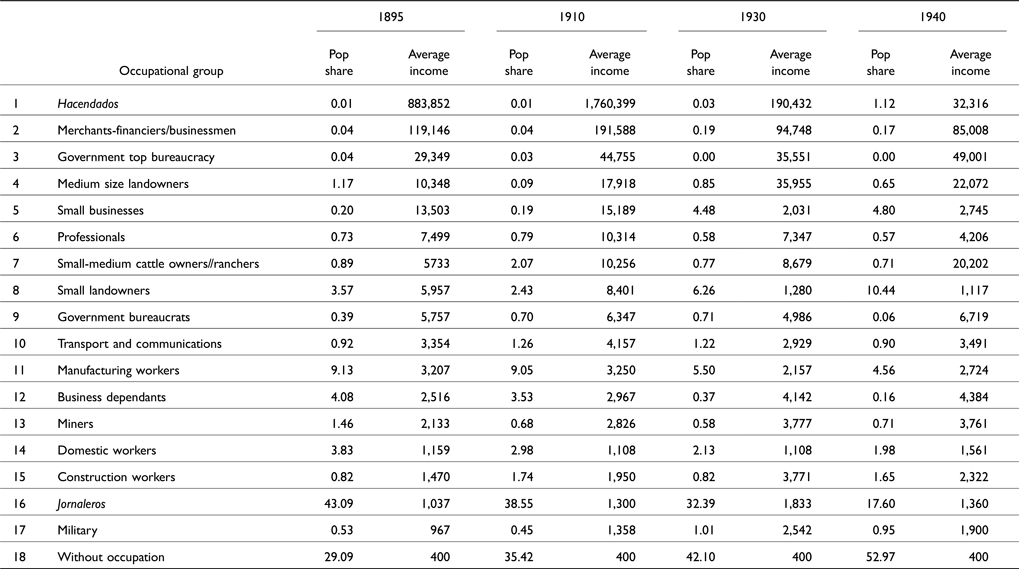
Source: Authors' own calculations. Incomes in 1990 US dollars. Pop share = share of the total population in this group.
Note: The 1930 and 1940 hacendado class is derived from the agrarian censuses. After the Revolution, the hacendado class disappeared from public discourse. To ensure our data are comparable over time, we retain the hacendado label for 1930 and 1940, using large landowners as the equivalent. In the agrarian censuses, large plots of land are defined as greater than 5 hectares. The larger number of hacendados reported in 1940 is likely due to the intensification of land reform and the partition of large haciendas among family members to avoid the reform, resulting in a greater number of individual plots of land. Thus, there are more large landowners in the reports.
For 1930 and 1940, sources are more comprehensiveFootnote 4. While we continue using the same eighteen social groups, in online Appendix B we present more complex social tables with 98 groups in 1930 and 101 groups in 1940. These groups were derived from the censuses and matched with income data from statistical yearbooks and other sources.
Wages for many worker categories were sourced from the statistical yearbooks for the years 1930, 1938, 1941 and 1946, following Rodríguez Weber (Reference Rodríguez Weber2014, Reference Rodríguez Weber2016). These were combined with data from the industrial censuses of 1930 and 1940 and the agrarian censuses of 1935 and 1940.
For the top incomes, we employed the same series of rates of returns between 1896 and 1938 (Haber, Reference Haber1989). For hacendados, we followed the process described above, consulting the agrarian censuses for information on land holdings and production. Although hacendados lost some land during the Revolution (Katz, Reference Katz1998; Aguilar Camín, Reference Aguilar Camín1996), we assume they retained the most profitable land when possible.
For domestic workers, we continue to use Goldsmith Corelly's (Reference Goldsmith Corelly1992) wage estimates. For the group without occupation, we followed the same logic as in the construction of the 1895 and 1910 social tables.
To validate our estimates, we compared the per capita income derived from the social tables to Mexico's per capita income from the Maddison project (Bolt and van Zanden, Reference Bolt and Van Zanden2014) (see online Appendix C). The GDP per capita estimates derived from our social tables align closely with those from the Maddison project, despite the different methodologies used. This strengthens our confidence in the reliability of our Mexican income estimates. Additionally, as a further robustness check, we used alternative estimates for the rents and earnings of large landowners to calculate an alternative social table for 1940 (see online Appendix E). This shows that even with different incomes for the hacendado and ejidatorio groups, the general trend in the estimates remains consistent with our reconstruction.
4. Results: Mexican inequality, 1895-1940
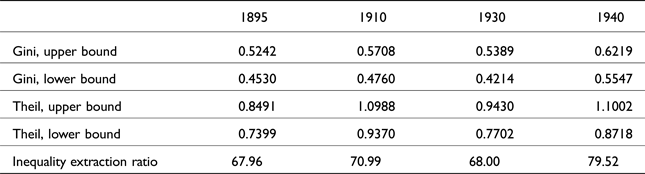
Table 2 presents our estimates of the Gini coefficient of Mexican incomes in 1895, 1910, 1930 and 1940. Our preferred estimate includes the group «without occupation» represented as the upper bound estimate in the table. Alternatively, we also calculated inequality excluding this group, yielding the lower bound estimate.
Mexican income inequality in 1895, 1910, 1930 and 1940

Source: see discussion in the text, and Table 1.
Note. Our preferred estimate, the upper bound, includes people recorded as without occupation in the censuses. The lower bound estimate excludes this group.
Next, we analyse Mexican inequality in light of the country's social, economic and political development during the period 1895 to the 1930s.
Inequality grew between our initial benchmarks, with the Gini coefficient rising from 0.5242 in 1895 to 0.5708 in 1910, based on our preferred estimate. Subsequently, there was a notable decline in the Gini coefficient to 0.5389 in 1930, which was then followed by a pronounced rise during the 1930s, culminating in a peak of 0.6219 by 1940. The alternative estimate, which excludes the group «without occupations», shows Gini coefficients approximately 10 points lower, yet the general trends observed remain consistent.
To perform a comparative-historical analysis on Mexico's inequality during the years studied, we estimate the Inequality Extraction Ratio (IER), a concept developed by Milanovic et al. (Reference Milanovic, Lindert and Williamson2011). The IER relates measured income inequality to income per capita, indicating how unequal an economy is vis-à-vis its maximum potential inequality. The rationale is that in wealthier societies with larger surplus, higher inequality can be sustained without inducing starvation among the poor. A comparison with one of the most unequal societies ever registered, Nueva España circa 1790 reveals that Porfirian Mexico had a similar level of inequality. To be sure, in 1790 Nueva España had an IER of 63.7. By 1895, Mexico's IER had increased to 68.0, escalating further to 79.5 by 1940Footnote 5.
4.1 Mexican inequality in times of an oligarchic modernisation project, 1895-1910
The late 19th century in Mexico, as in several other Latin American countries, was a period of oligarchical modernisation (Collier and Collier, Reference Collier and Collier2002, Ch. 4; Bértola and Ocampo, Reference Bértola and Ocampo2012, pp. 81-104). Hence, it is not surprising to find an increase in inequality from 1895 to 1910.
Comparing estimated levels of inequality is difficult in this historical setting, due to the varied sources available and the different methodological choices. The estimates presented here are more suitable for drawing conclusions about changes over time within Mexico rather than comparisons with other countries. However, to provide context, we will make brief comparisons with other Latin American countries. The study by Bértola et al. (Reference Bértola, Castelnovo, Rodríguez Weber and Wilebald2009) of Argentina, Brazil, Chile and Uruguay similarly finds an increase in income inequality in all four countries from 1870 to 1910. While comparisons of levels must be taken cautiously due to varying sources and methods, the inequality found for Mexico in 1895 (a Gini coefficient of 0.52) falls within the range of the countries surveyed by Bértola et al. in 1870 (Argentina 0.52, Brazil 0.39, Chile 0.59 and Uruguay 0.48). The levels in 1910 are also similar: we find a Gini coefficient of 0.57 in Mexico, while the above authors estimate 0.57 for Argentina, 0.60 for Brazil, 0.64 for Chile and 0.56 for Uruguay.
Mexico's inequality level is notably high for an agrarian and relatively poor country. Over 70 per cent of the Mexican population lived in rural areas (Estadísticas Históricas de México, Tomo I). According to the Maddison dataset, Mexico's GDP per capita in 1910 (in 1990 US dollars) was $1,694, compared to $3,822 in Argentina, $769 in Brazil, $3,000 in Chile and $3,136 in in Uruguay (Maddison Project Database, see Bolt and van Zanden, Reference Bolt and Van Zanden2014). Given that wealthier economies can distribute larger surpluses, Mexico, with an inequality level similar to Argentina's Gini coefficient, was closer to its maximum feasible inequality than Brazil, a poorer nation (adapted from Milanovic et al., Reference Milanovic, Lindert and Williamson2011).
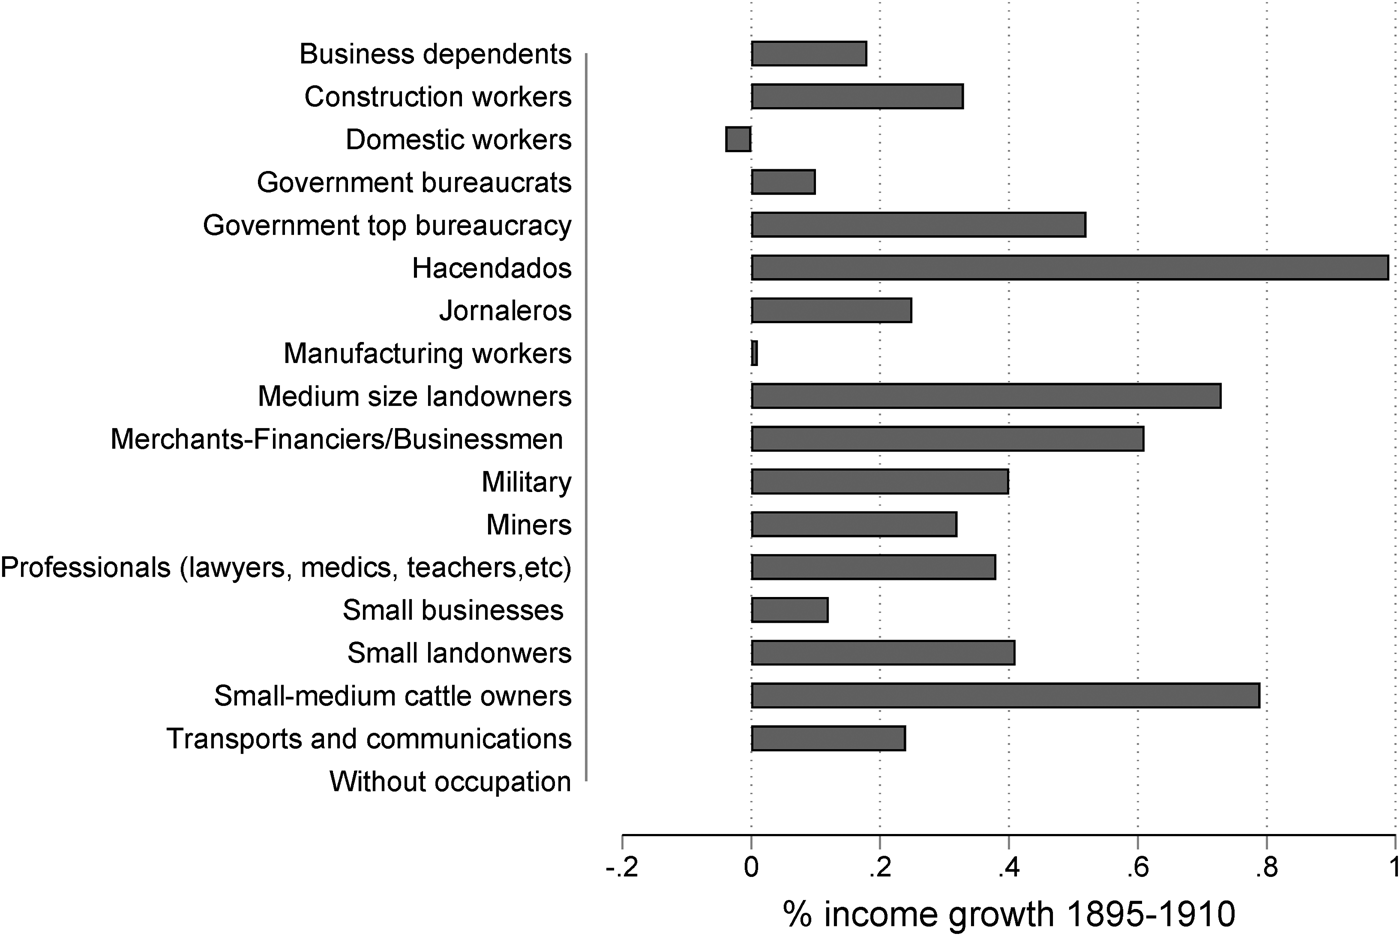
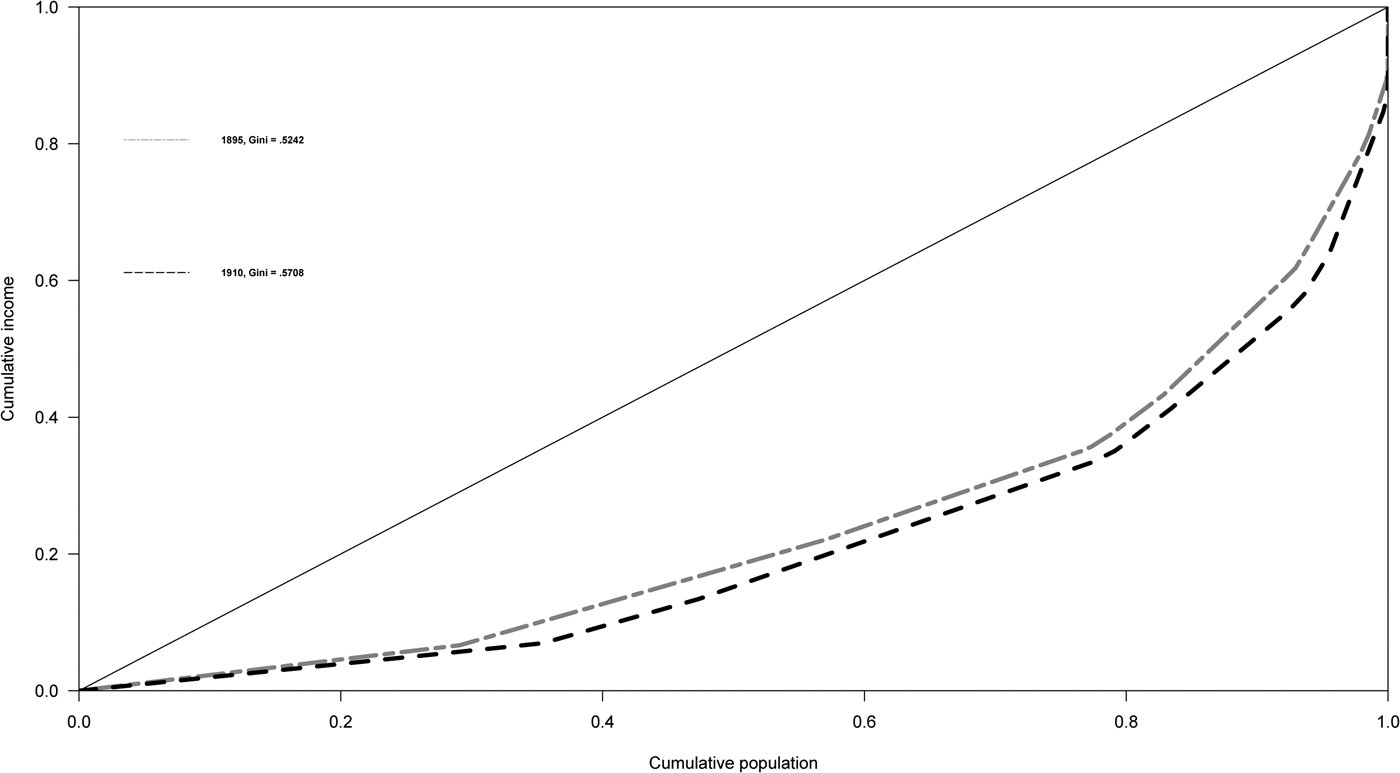
Which were the primary drivers of Mexican inequality?Footnote 6 Figure 1 provides a more disaggregated perspective, illustrating group-by-group changes in average real income between 1895 and 1910 (cf. Lakner and Milanovic's (Reference Lakner and Milanovic2016) growth incidence curves). Figure 2 complements this information with Lorenz curves for incomes in 1895 and 1910.
Winners and losers, 1895-1910.
Sources: see discussion in the text, section 3.

1895 and 1910 Lorenz curves.
Sources: see discussion in the text, section 3.

As Figure 1 demonstrates, real incomes increased between 1895 and 1910. Yet, these gains were unevenly distributed across groups. Hacienda owners (hacendados), medium-sized landowners and cattle ranchers (rancheros) experienced the most significant income growth. Business owners and high-ranking government officials also prospered. Conversely, small business owners, manufacturing workers, peasants (jornaleros) and construction workers witnessed considerably smaller improvements. This disparity contributed to increased inequality.
The substantial increase in inequality, driven primarily by significant gains for elites such as businessmen and hacendados, aligns well with the historical literature. This literature emphasises that during this period, the mining sector expanded, and the years leading up to 1905 were a «gilded age» for the «creole aristocracy» and foreign investors, particularly in mining (Joseph and Buchenau, Reference Joseph and Buchenau2013, p. 24). The prosperity of the hacendados is understandable, given the Díaz administration's hacendado-friendly policies, including the infamous privatisations of communal land in the 1880s. While these privatisations aimed to increase land use efficiency, they impoverished indigenous rural populations and heightened social tension (Coatsworth, Reference Coatsworth1981; Haber, Reference Haber1989)Footnote 7. The gains of entrepreneurs were further bolstered by the «crony capitalism» of the Díaz regime, characterised by political arrangements of rents and protectionist policies that defended the interests of the regime's allies (Haber, Reference Haber1989; Beatty, Reference Beatty, Bortz and Haber2002; Kuntz, Reference Kuntz, Bortz and Haber2002).
Capital income growth outpaced average income growth, in line with Piketty's (Reference Piketty2014) r > g argument. Rates of return were around 7 per cent from 1896 to 1910, while GDP growth was only 3.2 per cent per year (Haber, Reference Haber1989; Bolt and van Zanden, Reference Bolt and Van Zanden2014). It is important to acknowledge that this r > g dynamic was politically enforced in a crony capitalist setting. While rents were high, working conditions for the agrarian population were harsh and wages were low. The German agronomist Karl Kaerger (Reference Kaerger1902), on a research mission from the German Kaiser, studied Mexican agriculture to determine if Germany could replace imports from the United States with Latin American imports in case of war. In his report, he mentions the low wages paid to Mexican peasants and illustrates how these labour conditions, along with low labour costs and potential high profits in agricultural exports, were favourable for German investments.
The older literature tended to portray a very negative view of the evolution of peasant and working-class living conditions during the Díaz years (e.g. Burns, Reference Burns, Burns and Skidmore1979, pp. 72-74). However, we do find improvements for jornaleros from 1895 to 1910, in line with recent findings of some real wage growth during these years (cf. Arnaut, Reference Arnaut2018). Despite these gains for workers, inequality grew as their improvements did not match the overall economic gains.
As Arnaut (Reference Arnaut2018, p. 60) asks in his recent study of real wages for this period: «where did all the fruits of economic growth go if Mexican laborers did not capture it in its entirety?» The Lorenz curves for 1895 and 1910 in Figure 2 further illustrate this development, revealing the social pyramid of winners and losers from the liberal modernisation project of the Díaz government. The left-hand side of the 1910 curve, symbolising the shares of the relatively poor, was pushed down compared to the 1895 curve, indicating growing inequality. This reflects what we have already seen in Figure 1: workers and jornaleros did not gain as much from the economic development 1895-1910 as the middle and upper-class groups did.
Standard economic theory, such as the Stolper–Samuelson theorem and the Heckscher–Ohlin model, would predict that global economic integration—like the integration into international trade and capital flows experienced by Mexico before 1910—would lead to a more intensive use of unskilled labour, the abundant factor of production in a country like Mexico. Hence, unskilled labour would gain from trade, while nationally scarce factors such as skilled labour and capital would lose (Williamson, Reference Williamson1999). However, this is not what occurred in Mexico during the so-called period of external growth (Knight, Reference Knight, Cárdenas, Ocampo and Thorp1999).
Most likely, government intervention prevented the free market's distributional forces from taking effect. Historical literature indicates that the regime protected well-connected industrialists and repressed workers' organisations. The internal contradictions of the Díaz regime intensified in the first decade of the 20th century, particularly in 1906-1907 when strikes in the mining and textile industries ended in massacres (Knight, Reference Knight1984, pp. 69-70; Gómez-Galvarriato, Reference Gómez-Galvarriato, Bortz and Haber2002; Joseph and Buchenau, Reference Joseph and Buchenau2013, pp. 25-37).
This growth of inequality under an oligarchic regime is very similar to what Rodríguez Weber (Reference Rodríguez Weber2017, pp. 54-55) has found for Chile in the same period, which also saw the repression of unions and violent strike-breaking in the mining sector. The growing inequality in Latin America from 1870 to 1910 has prominently been related to commodity booms (Williamson, Reference Williamson2015). However, in the Mexican case, increasing inequality occurred within the context of Porfirio Díaz's oligarchical modernisation project.
4.2 The revolution and income inequality, 1910-1930
Inequality was high from 1895 to 1910, but then fell to 1930: the Gini coefficient decreased from 0.5708 to 0.5389. What accounts for this movement? The Mexican Revolution is the obvious starting point of the analysis. As our discussion of the 1895-1910 highlighted, social tensions were growing in the final years of the Díaz regime, when many people had reasons for discontent. Although the revolution overthrew the Díaz regime, it did not have a unified ideological agenda or goals. For this reason, the country's development during and after the Revolution was contradictory and multi-faceted (Knight, Reference Knight1992; Gómez-Galvarriato, Reference Gómez-Galvarriato, Bortz and Haber2002)Footnote 8.
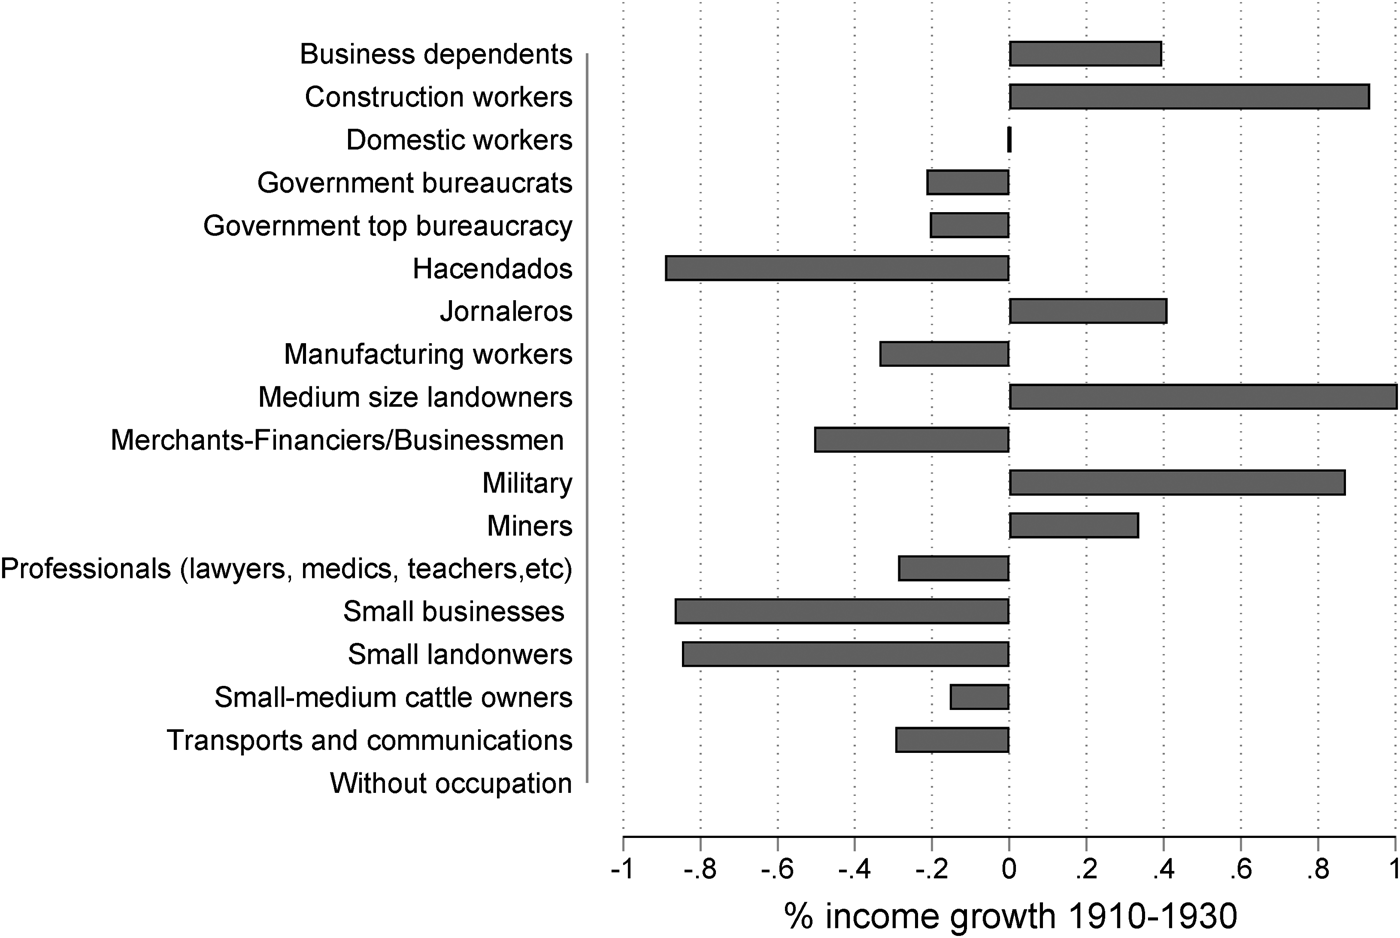
The stages of the Revolution resembled a civil war, with weak governments rapidly succeeding one another. In the 1920s, the so-called Sonorans, broadly liberal leaders from the emerging capitalist north of the country, took control. In contrast, the 1930s saw more radical leadership under President Cárdenas (cf. Fowler Salamini, Reference Fowler Salamini and Brading1980; Wasserman, Reference Wasserman1993; Joseph and Buchenau, Reference Joseph and Buchenau2013, Chs. 5-6). The outcomes for economic inequality from 1910 to 1930 are not a foregone conclusion. Figures 3 and 4 break down the change of inequality—from a Gini coefficient of 0.57 to 0.54—using group-by-group analysis and the Lorenz curve.
Winners and losers, 1910-1930.
Sources: see discussion in the text, section 3.

1910 and 1930 Lorenz curves.
Sources: see discussion in the text, section 3.
Note. The 1910-1930 Lorenz curves do not show Lorenz dominance, as the curves cross each other at different points. This indicates that different groups at the bottom and top of the income distribution made gains. Meanwhile, some groups in the middle of the distribution suffered income losses. Despite this, the Gini and Theil measures confirm that the income distribution in 1930 was less unequal than in 1910, indicating weak Lorenz dominance.
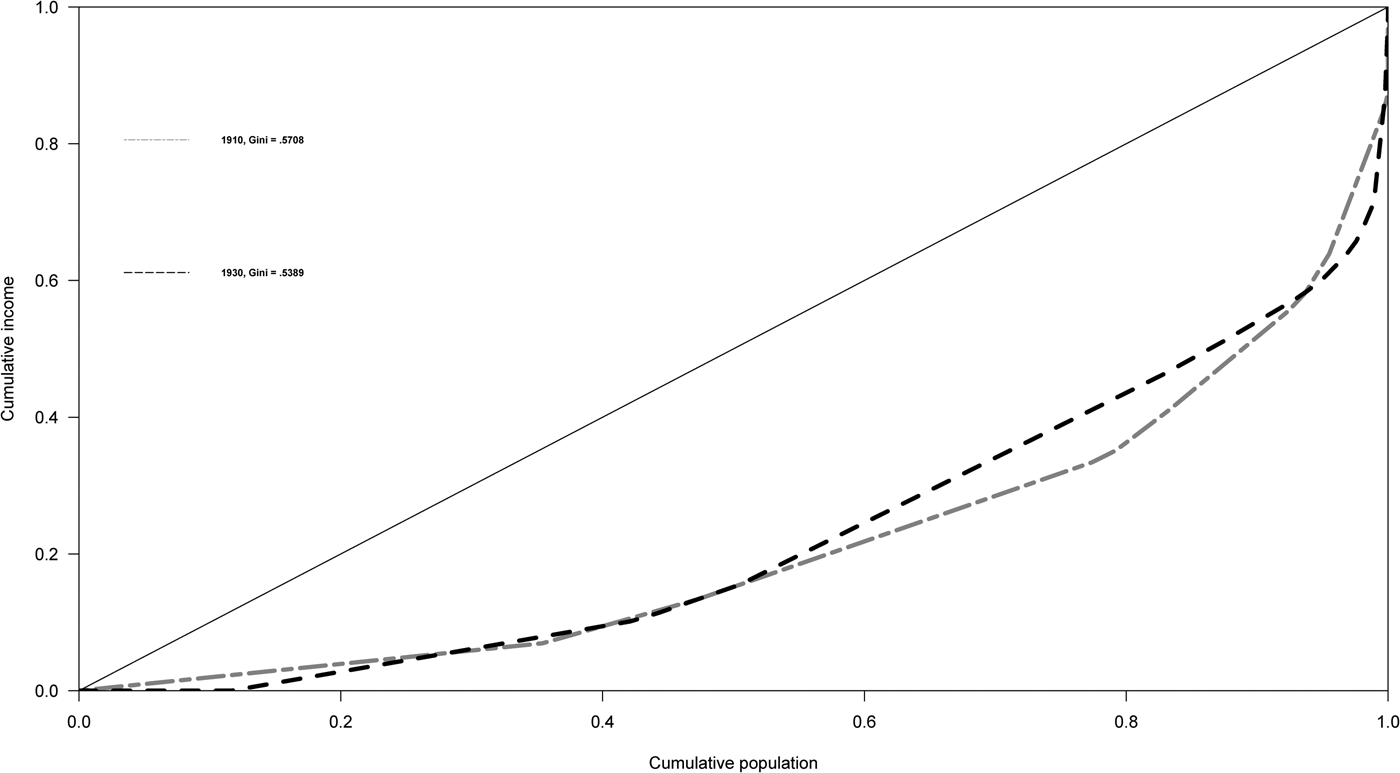
Figure 3 shows that «medium size landowners» were the major beneficiaries from 1910 to 1930, along with construction workers, the military, jornaleros, miners and construction workers. The major losers of the period were hacendados, followed by small landowners and small businesses; merchants–financiers were also losers in this period. The distribution pattern had a slightly pro-equality profile, but not consistently so; for example, manufacturing workers were among the losers. As we have seen, the Gini coefficient dropped by only four points, from 0.5708 to 0.5389.
Regarding the revolution, the most significant equalising factor appears to be the redistribution of land, which reduced the incomes of the hacendados while benefiting jornaleros and medium-size landowners. Scheidel (Reference Scheidel2017, pp. 241-242) cites the Mexican revolution and its agrarian reform as a case that demonstrates the importance of revolutionary violence in reducing inequality. We agree that these reforms were crucial for reducing inequality and we see a strong similarity in this process of political concessions to the lower classes and the concessions to working-class demands in European countries during the First World War (cf. Scheve and Stasavage, Reference Scheve and Stasavage2010).
In Mexico, peasants and landless actively campaigned for access to land, with prominent movements led by Pancho Villa and Emiliano Zapata. During the 1910s and 1920s, various presidents oversaw the redistribution of 25 million acres of land. Under President Cárdenas, from 1932 to 1940, an additional 49.6 million acres were redistributed (Joseph and Buchenau, Reference Joseph and Buchenau2013, p. 127). This land redistribution significantly impacted income distribution between groups such as hacendados and jornaleros. As a result, the share of the population classified as «small landowners» grew from 2.4 in 1910 to 6.3 per cent in 1930 (see Table 1).
Significant changes were also implemented in tax policy. Income and inheritance taxes were introduced in 1924 and 1926, respectively. The initial top marginal rate for income tax was 2 per cent for individuals and 4 per cent for businesses, which was later increased to up to 12 per cent in subsequent reforms under the government of Lazaro Cárdenas (Flores Zavala, Reference Flores Zavalan.d.). The inheritance tax, on the other hand, was highly progressive, ranging from 4 per cent up to 64 per cent depending on the size of the bequest and level of kinship between the proprietor and the heirs (Lozano Noriega, Reference Lozano Noriega1963).
However, as highlighted in Cárdenas' 1933 electoral manifesto and government plan, both the income and inheritance taxes needed to be revised to achieve true progressivity. The aim was to «avoid only taxing the waged labourers» and to «prevent the perpetuation of great fortunes» (Partido Nacional Revolucionario, 1933, pp. 333-334). The issues of tax avoidance and lack of progressivity also contributed to regional fiscal inequality and economic divergence (Campos Vazquez et al., Reference Campos-Vázquez, Domínguez, Márquez, Bértola and Williamson2017).
For the working class as a whole, the evidence is mixed. While the trends for miners and construction workers are positive, those for manufacturing workers are slightly negative. This is surprising given the pro-labour reforms of the period, notably the 1917 Constitution, which guaranteed the rights to unionise and strike. Additionally, the labour movement saw advancements in industries such as textiles and regional concessions were made by state governors, including Luis F. Domínguez from Tabasco and Candido Aguilar from Veracruz. These governors implemented minimum wage increases, regulated maximum working hours per day, abolished debt peonage and prohibited physical punishment at factories (Bortz, Reference Bortz, Bortz and Haber2002).
It seems, however, that these pro-labour policies were not sufficient to significantly impact the inequality statistics. Although real wages for manufacturing workers increased, especially in the 1920s (cf. Gómez-Galvarriato, Reference Gómez-Galvarriato, Bortz and Haber2002), the overall growth from 1910 to 1930 was not remarkable and the manufacturing worker population remained relatively small.
The limited growth of the manufacturing worker group has implications for inequality. Keesing (Reference Keesing1969, p. 723) argues that while Mexican manufacturing expanded in the decades leading up to 1930, the labour-saving technology used did not result in a significant increase in demand for workers. Gómez León (Reference Gómez León2019) found that Brazil experienced a «rise of the middle class» in the early 20th century, driven by the expansion of the urban non-agrarian sector and economic diversification.
In Mexico, the situation was different due to its turbulent political and social climate. While the small business owner group expanded substantially, both the professionals group and the ranchero groups stagnated (see Table 1). The evolution of income distribution from 1910 to 1930 is scattered, with notable gains among the agrarian lower classes and corresponding losses at the top, rather than significant changes in the middle (see Figure 3). This is also reflected in the lack of Lorenz dominance shown in Figure 4.
4.3 Inequality in the 1930s
Between our 1930 and 1940 benchmarks, we observe an increase in inequality, with our preferred measure of the Gini coefficient rising from 0.54 to 0.62. This increase occurred during a period of expanding social rights and public services. To be sure, the presidency of Lazaro Cárdenas from 1934 to 1940 has been described «without a doubt the most progressive phase of the Mexican revolution» (Joseph and Buchenau, Reference Joseph and Buchenau2013, p. 118). Cárdenas accelerated land reform and nationalised the oil industry in 1938 (for a detailed narrative, see Gilly, Reference Gilly1994). His administration also increased welfare state expenditure on education and health (cf. Campos-Vázquez et al., Reference Campos-Vázquez, Domínguez, Márquez, Bértola and Williamson2017). However, organised labour was less central to the Cárdenas coalition than it was, for example, in Perón's similarly populist regime in Argentina in the 1940s. In the Cárdenas coalition, peasants were at least as important as workers (Collier and Collier, Reference Collier and Collier2002, pp. 232-247, 332-344).
The increase in income inequality during the 1930s, despite the progressive political tendencies in Mexico, can be explained by economic and demographic factors. Industry's share of GNP rose from 13.6 per cent in 1930 to 16.3 per cent in 1940, compared to 11.28 per cent in 1910 (Bank of Mexico, Reference Banco De México1989). However, the share of manufacturing workers in our social tables remained stagnant (Table 1), while the group «without occupation» grew by 10 percentage points in the 1930s.
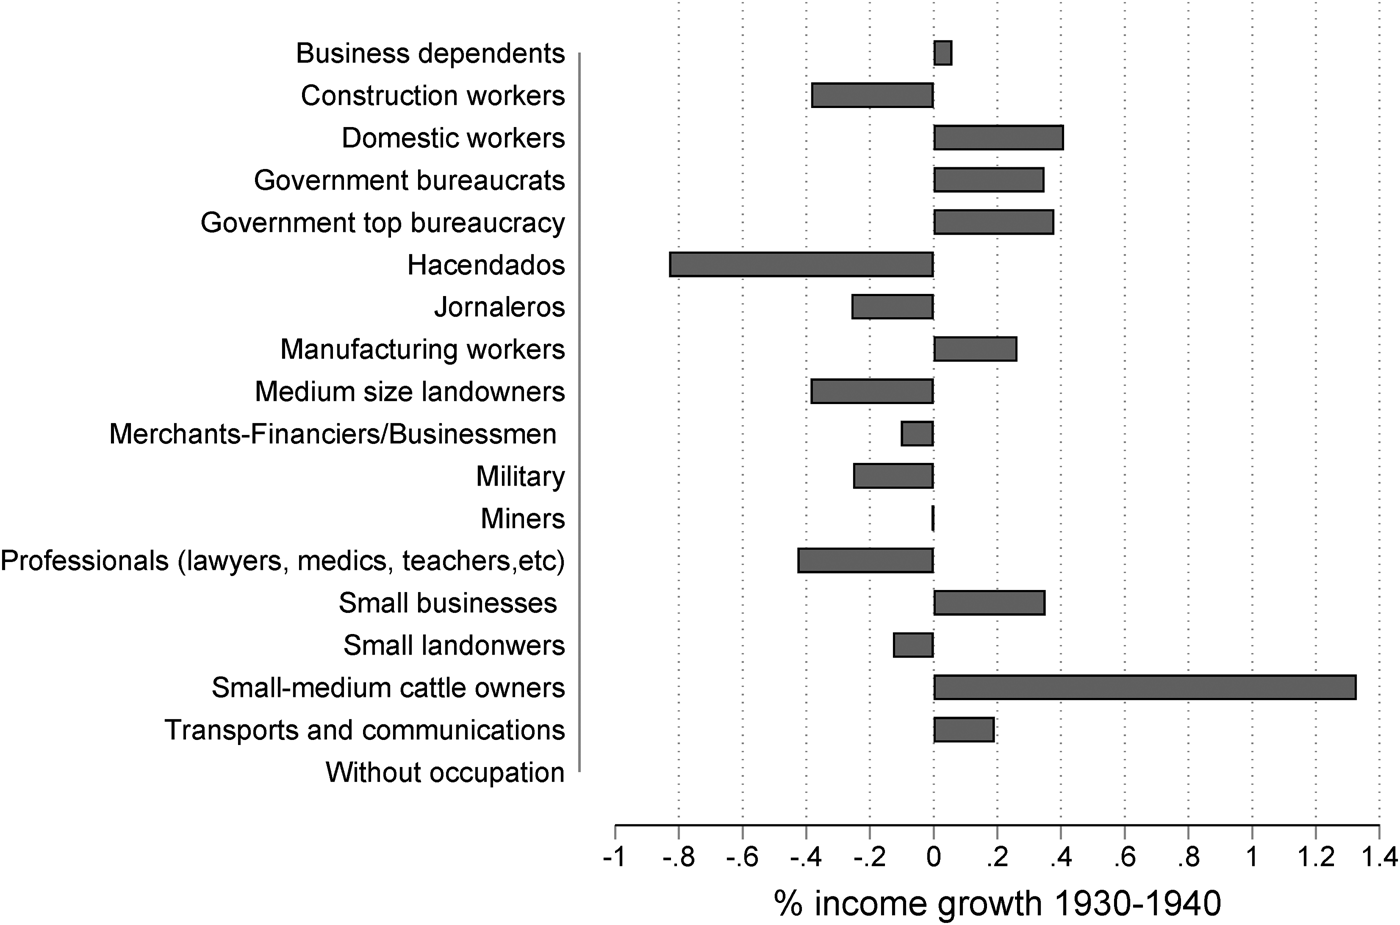
Figure 5 shows that the income gains from 1930 to 1940 were not particularly skewed towards the wealthy. Instead, the increase in inequality was driven by the changing relative sizes of social groups, particularly the growth of the group «without occupation» (Table 1). The main winners in the income race in the 1930s were the small businesses and manufacturing workers. Although peasants, especially the newly created ejidatarios made significant gains, these were overshadowed by the income gains in industrial occupationsFootnote 9.
Winners and losers, 1930-1940.
Sources: see discussion in the text, section 3.
The issue, as Keesing (Reference Keesing1969) noted, was that not enough manufacturing jobs were created. Bértola and Ocampo (Reference Bértola and Ocampo2012, p. 46) have pointed out that during this period, inequality decreased in Argentina, Chile and Uruguay, but not in countries like Brazil and Mexico, which had large rural labour surpluses and strongly segmented labour markets. In these countries, inequality only fell when the rural labour surplus had diminished and education levels had risen.
The pattern observed in Mexico during the 1930s aligns well with this argument. During the Great Depression, a significant number of Mexicans were forcibly expelled from the United States to Mexico; recent estimates suggest about 500,000 people were affected (cf. Lee et al., Reference Lee, Peri and Yasenov2017)Footnote 10. In the 1930s, the population of the three largest cities—Mexico City, Guadalajara and Monterrey—grew by an average of 35 per cent (Joseph and Buchenau, Reference Joseph and Buchenau2013, p. 128). The increase in the group «without occupation», a group reasonably assigned low incomes in the social tables, is likely related to this combination of urbanisation and adjustments to U.S. policies during the Depression. In 1942, the Mexican state began encouraging labour migration to the United States as a part of its national development strategy (cf. Sandos and Cross, Reference Sandos and Cross1983), reflecting the ongoing issue of labour surpluses in Mexico.
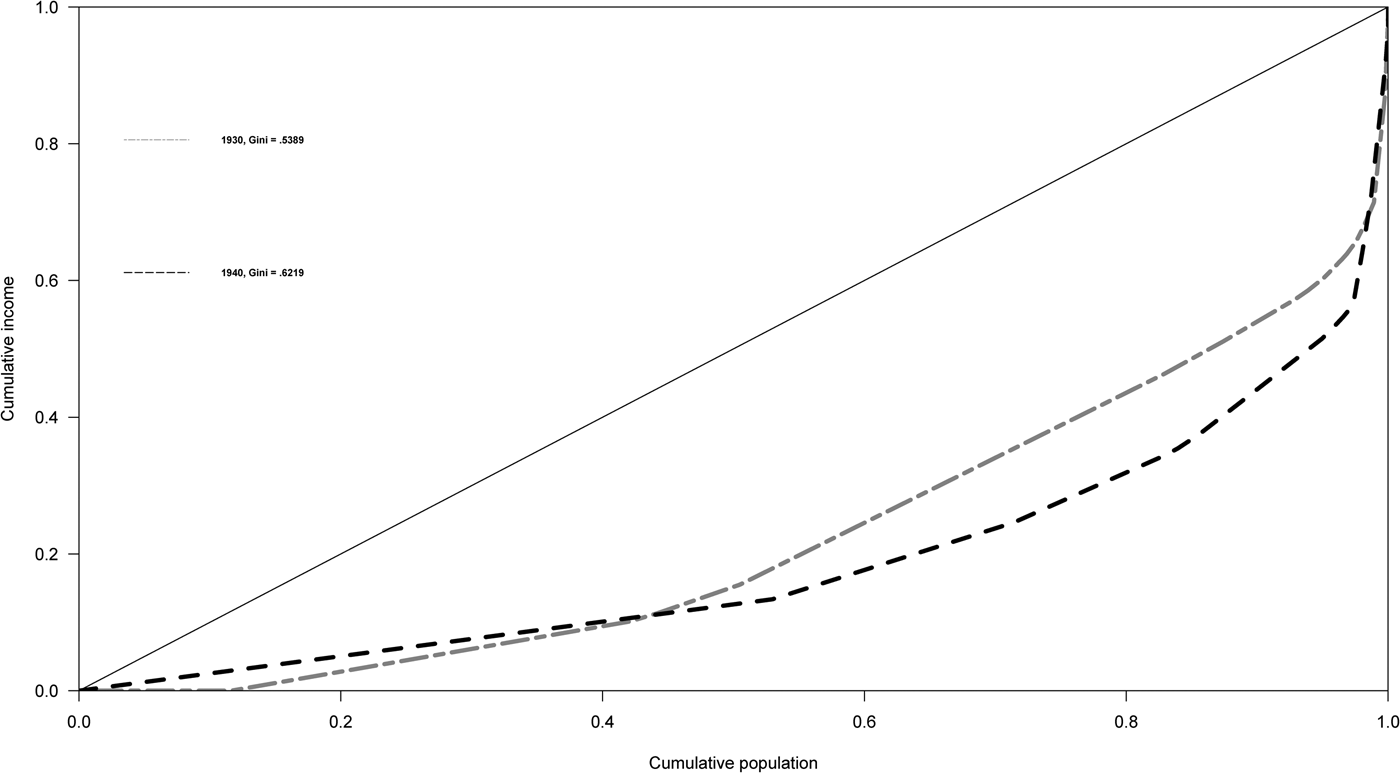
The Lorenz curves for 1930 and 1940 shown in Figure 6 reveal that inequality increased during the 1930s due to a reduction in income shares among the middle-class—roughly percentiles 50-90—while the elites benefited. This pattern underscores the erosion of the middle class and the relative scarcity of well-paying jobs in sectors like manufacturing, as previously discussed. The strong performance of the elite can be attributed to their ability to weather the turbulence of the revolution. As Wasserman (Reference Wasserman1993) notes, the old agrarian elite employed several strategies to survive, such as dividing their lands to avoid land reform, selling property to foreign investors, diversifying their investments and marrying into the new regime. These strategies likely contributed to the rise in inequality between 1930 and 1940. We will revisit this discussion in the concluding remarks.
1930 and 1940 Lorenz curves.
Sources: see discussion in the text, section 3.
Note. The Lorenz curves for 1930-1940 show no clear dominance, as the curves intersect at various points. This indicates that different groups experienced income losses both at the bottom and top of the income distribution in 1940, while those in the middle saw gains. Despite these fluctuations, the Gini and Theil measures confirm that income distribution in 1940 was more unequal than in 1930, reflecting weak Lorenz dominance.

5. Conclusions and further discussion
Mexican income inequality between 1895 and 1940 exhibited a volatile pattern. It began at high levels and increased from 1895 to 1910, followed by a decline after the Revolution, only to rise again during the 1930s. From our estimate for 1940 to Székely's (Reference Székely2005) estimate for 1950, when the Revolutionary Party (PRI) regime had been stabilised, inequality decreased slightly to approximately 0.55.
Consequently, the Revolution did not significantly and permanently reduce inequality. As previous studies, including Székely's, have emphasised, inequality remained high and persistent in the decades following 1950. While a comprehensive explanation for the fluctuations in Mexican income inequality is beyond this paper's scope, we will conclude by examining several key factors. This discussion can serve as inspiration for further research.
Politics, economics and demography all influenced Mexican income inequality during this period. The failure of unskilled labour, the abundant factor of production, to benefit substantially from the 1895-1910 liberalisation likely stems from the oligarchic and repressive political regime, which ultimately precipitated its downfall in the 1910s. The Revolution, however, did not radically depart from the past (cf. Gilly, Reference Gilly1971). Among historians, the notion of a revolutionary tabula rasa has lost credibility (Knight, Reference Knight1992; Wasserman, Reference Wasserman1993, pp. 67-69). Although agrarian elites in states like Morelos suffered significant economic losses due to the land reforms of the 1920s and 1930s, their influence in the local community, bolstered by their authority as local power brokers, did not disappear. In fact, the various revolutionary regimes depended on negotiating with local elites to maintain power (cf. Joseph, Reference Joseph and Brading1980; Wasserman, Reference Wasserman1993, Ch. 5).
Even more critical to the inequality patterns measured here for 1930 and 1940 was that inequality reduction in Mexico, during times of reform, was held back by the dualism of the economy. The large pool of available, low-skilled, low-paid or informally paid labour created a significant disparity between this group and the highly paid individuals in more dynamic sectors (cf. Pinto, Reference Pinto1973; Bértola and Ocampo, Reference Bértola and Ocampo2012, p. 46).
Ironically, despite Mexico's revolution characterised by peasant mobilisation and peasant-friendly reforms, it did not achieve a lasting decrease in inequality. In contrast, Chile, which did not experience a revolution, significantly reduced inequality from 1940 to 1970, as noted in Rodriguez Weber's nuanced analysis (2017, pp. 57-59). Thus, while the Porfiriato demonstrates the necessity of considering political, as well as economic factors, in the historical analysis of inequality, the experience of the 1930s reveals that even during revolutionary periods, the forces of labour supply and demand cannot be disregarded.
The lack of lasting equalisation during and after the Revolution presents an intriguing avenue for further study, particularly with more disaggregated social tables. As explored by Hidalgo (Reference Hidalgo2018), the failure after the Revolution to improve the rights of domestic workers, in contrast to those of industrial workers, serves as a particularly relevant example. Additionally, Dion (Reference Dion2010, Ch. 3) underscores the stark contrast between the expanding rights of public sector workers, who enjoyed political influence over working conditions, pensions and related issues, and the stagnant conditions in the private sector, where employers resisted such changes.
The inequality between the formal and informal sectors, as well as between high-paid and low-paid positions, during and immediately after the Revolution, merits further research. Other aspects that have not been sufficiently explored here include gender and regional inequalities. Previous research indicates that economic gender inequality was widespread and saw little improvement after the Revolution (Joseph and Buchenau, Reference Joseph and Buchenau2013, pp. 113-114). While the sources used in this study do not provide sufficient information to comprehensively analyse gender disparities, this remains a critical area for further historical research on Mexican inequality. Additionally, a more in-depth examination of regional disparities should be incorporated into future research.
Supplementary material
The supplementary material for this article can be found at https://doi.org/10.1017/S021261092400017X.
Acknowledgements
The paper was presented at the CLADHE VI conference in Santiago de Chile 23-25 July 2019. We are deeply grateful to the participants there and to Pablo Astorga and Branko Milanovic for their constructive comments and suggestions. We also appreciate the helpful comments and criticisms from two anonymous referees and the journal editor, Anna Carreras-Marín.
Sources and official publications
Sources are from Departamento de la Estadística Nacional, Dirección General de Estadística, Instituto Nacional de Geografía, Estadística e Información, as well as other government institutions and private archives, such as the Francisco I. Madero archive in Mexico City. For a detailed list and discussion of the sources, please see online Appendix A.


 Open access