

Evidence suggests that nutritional intake during particularly critical periods such as early childhood is related to the growth, development and well-being of children(Reference Dietz1, Reference Kleinman2). To characterize food consumption in early life, a valid, precise and practical dietary assessment method is essential. FFQ are commonly used for dietary intake assessment in infants and toddlers(Reference Marriott, Robinson and Poole3–Reference Marriott, Inskip and Borland5), and are relatively inexpensive, easy and quick to administer(Reference Subar6, Reference Cade, Thompson and Burley7). However, only a limited number of foods can be included in an FFQ(Reference Cade, Thompson and Burley7). The increasing variation in foods consumed may not be validly assessed, since it may be difficult to accurately assess the foods consumed during the transition from an infant diet to a toddler diet and subsequently to a family diet. To obtain detailed information on the diets and feeding patterns of toddlers, a more comprehensive dietary assessment tool/method may thus be more appropriate.
Other instruments for collecting more detailed information on foods and beverages consumed are the dietary recall, weighed dietary record and estimated food record. Dietary recalls are usually dependent on the memory of respondents, and are often not possible due to financial and human resources constraints(Reference Biro, Hulshof and Ovesen8, Reference Buzzard9). Weighed dietary records are regarded as a gold standard in nutrition assessment(Reference Bingham, Cassidy and Cole10). However, they are expensive, time-consuming and require considerable commitment on the part of the participants(Reference Buzzard9). Estimated food records, which do not rely on participants’ memory, can provide a greater amount of detail on dietary intakes than FFQ and are also easy to administer. For estimated food records, portion size can be estimated using household measures or food models(Reference Biro, Hulshof and Ovesen8).
The present study is based on an estimated food record (EFR), which was developed to assess usual food and beverage consumption in toddlers in the large-scale cross-sectional German Representative Study of Toddler Alimentation (GRETA) that focused on the dietary intake and feeding patterns of toddlers in Germany. Our aim was to determine the relative validity of a 3 d EFR used to assess energy and nutrient intakes in toddlers, using a 3 d weighed food record (WDR) as the reference method.
Participants and methods
GRETA study sample
GRETA was designed as a cross-sectional study. Its aims were: (i) to obtain information on the diets and feeding patterns of infants or toddlers between 10 months and 3 years of age in Germany; and (ii) to collect information on nutrition-based desires and attitudes, as well as on the behavioural patterns, of parents and infants. The data collection for GRETA was carried out by TNS Healthcare (Munich, Germany), applying its proprietary TNS Access Panel of voluntarily participating households in Germany. This continuously updated panel collects accurate information from all households that participate frequently in TNS Healthcare's research studies on various topics. The household sample for GRETA was selected in accordance with the following three characteristics combined: (i) child's age at the date of the survey; (ii) social level (characterized by household income, level of parental education and professional status of the principal earner); and (iii) regional distribution. All selected households were invited to participate in GRETA. The households that agreed to participate received a questionnaire (including a screening question on their willingness to participate in a follow-up study to validate results) and an estimation protocol, which facilitated the estimation of daily food and beverage consumption over seven consecutive days. During this investigational phase, study participants could contact a toll-free support hotline, in case of potential questions.
Validation study sample
For the validation of the EFR, a subsample of GRETA households (recruited by the screening question) was asked to report the food and beverage intakes of their child using an EFR concurrently with a WDR over three consecutive days. All participants received a box of materials necessary for this validation study. This box included a cover letter describing the validation study, dietary record forms (one EFR and one WDR), an electronic food scale (which could be kept by the participants after completion of data collection as a token of thanks for their participation) and a collection box for food packet labels, which were collected to help the classification of any commercial infant/toddler food products consumed. Data evaluations of the EFR and WDR, as well as further analyses, were conducted by the Research Institute of Child Nutrition in Dortmund, Germany. In total, sixty-seven toddlers whose parents had simultaneously completed an EFR and a corresponding WDR over a 3 d recording period were included in the present analysis.
3 d Estimated food record – test method
Parents were asked to record the frequency with which each food and beverage was consumed and the amount consumed by their child over three consecutive days in a single EFR booklet (Fig. 1; this EFR booklet is available from the authors). On the front page of this record booklet were instructions on how the record should be completed. For each food item, parents were asked to provide the amount their children had consumed, using a line to indicate a single portion. The estimation of portion sizes in terms of household measures and report units (e.g. half a banana was considered one report unit) was given special attention. The EFR booklet included photographs as well as the names of foods (e.g. noodles, wholegrain bread) and pictures of serving sizes in common household measures (e.g. 1 spoon). In total, approximately 200 food items were included in this booklet, following a preliminary analysis of foods and beverages commonly consumed by toddlers in the DONALD (DOrtmund Nutritional and Anthropometric Longitudinally Designed) Study(Reference Kroke, Manz and Kersting11) conducted by the Research Institute of Child Nutrition. These 200 food items were hierarchically organized in seventeen food groups: (i) infant and toddler foods; (ii) beverages; (iii) fruits; (iv) bread; (v) spreads (e.g. jam, butter); (vi) dairy foods; (vii) vegetables; (viii) savouries; (ix) sweets; (x) ice cream; (xi) eggs and egg dishes; (xii) meats and sausages; (xiii) fish and fish products; (xiv) side dishes (potatoes/pasta/rice); (xv) muesli; (xvi) dressings; and (xvii) other foods. In accordance with a toddler's typical meal structure, this EFR incorporated seven meal occasions: (i) after waking up/before breakfast; (ii) breakfast; (iii) mid-morning; (iv) lunch; (v) mid-afternoon; (vi) dinner; and (vii) before bed. The foods and beverages consumed by the participants were reported according to this meal structure in the EFR.
(colour online) Examples of the food list (A, food group of beverages; B, food group of muesli; C, food group of fruit) in the 3 d estimated food record (EFR). The EFR was structured to include seven meal occasions: (i) after waking up/before breakfast; (ii) breakfast; (iii) mid-morning; (iv) lunch; (v) mid-afternoon; (vi) dinner; and (vii) before bed. Food example for beverages is baby-tea (half a glass), food example for muesli is cornflakes (6 tablespoons) and food example for fruit is banana (half a banana)

Apart from the list of 200 food items, two tables were included in the EFR. One was a table of ‘other foods’, i.e. foods which were not included in the list of 200 items, with the food from the list that they most closely corresponded to (e.g. pineapple could be recorded as apple; Fig. 2A). The second was a table of ‘items not found’, an open table (Fig. 2B) in which any foods that could neither be found in the list of 200 food items nor in the table of ‘other foods’ could be recorded. This EFR was thus a combination of a quantitative assessment of daily intake and an FFQ.
(colour online) Two tables (A, ‘other foods’; B, ‘items not found’) in the 3 d estimated food record (EFR), additional to the food list. (A) In the table of ‘other foods’, the first column shows the sought foods: pineapple, eggplant, bier ham, swiss roll, beans. The second column shows they are recorded as: apple, other vegetable, slicing sausage, cream cake, other vegetable. (B) Table of ‘items not found’: this table was an empty table structured to include seven meal occasions. Foods and beverages which were neither listed in the 200 food items list nor in the ‘other foods’ table could be noted in this table; for example, coconut flakes, 1 teaspoon

In addition, if an infant was breast-fed, parents were asked to record the number of milk feeds in the EFR. Parents were also asked to note specific information for infant and toddler foods (i.e. package details, brand name, description, age information and producer name), in order to distinguish commercial infant/toddler foods from home-made foods or table foods. For home-made food, information on recipes was also requested.
3 d Weighed dietary record – reference method
As the reference method, a 3 d WDR was simultaneously completed on the same consecutive three days as the EFR. Parents were asked to weigh all foods and beverages consumed by their children to the nearest 1 g with the help of an electronic food scale (Soehnle Digita). Semi-quantitative recording (e.g. number of spoons, scoops, etc.) was allowed when exact weighing was not possible. Information on recipes, or the types and brands of food items, was also requested.
Data coding and evaluation
The quantities of foods and beverages reported in the EFR were converted from portion sizes and household measures into grams using mean portion sizes for each food and beverage in toddlers calculated from the DONALD Study. The estimation of breast milk consumption was performed using the approach reported by Schoen et al. based on estimated total energy requirements(Reference Schoen, Sichert-Hellert and Kersting12).
The individual mean intakes of energy and fourteen nutrients (protein, total fat, carbohydrate, linoleic acid, linolenic acid, retinol, ascorbic acid, folic acid, thiamin, Ca, Mg, Fe, Zn and iodine) on the 3 d reported in EFR and WDR were calculated using the in-house nutrient database, LEBTAB(Reference Sichert-Hellert, Kersting and Chahda13).
Anthropometric and parental characteristics
In GRETA, the height and weight of the toddlers were taken from the children's medical check-up booklets. Sex- and age-independent Z-scores were calculated using the WHO reference curves for weight and height, separately. In addition, parents provided information about family and socio-economic characteristics.
Statistical analysis
Procedures of the SAS® statistical software package version 8·02 (SAS Institute Inc.) were used for all data analyses. All analyses were performed with significance level at P < 0·05, except for any interactions, where P < 0·1 was considered significant. To test for an interaction with sex, we used linear regression models with energy and nutrient intakes estimated from the WDR as the dependent variables, and energy and nutrient intakes estimated from the EFR, and sex, as the independent variables. Analyses indicated no interaction with sex. Thus, data from girls and boys were pooled for all analyses. Since most nutrients were not normally distributed, non-parametric methods were used to evaluate the validity of the EFR in comparison to the WDR.
Differences in intakes of energy and nutrients between the EFR and the WDR were tested using the Wilcoxon signed-rank test. To assess the association between the energy and nutrient intakes obtained by both methods, Spearman rank correlation coefficients were calculated. In addition, participants were grouped into quartiles for intake of energy and each nutrient, to test the agreement in ranking participants according to their dietary intakes as estimated by the two methods. The proportions of participants classified into the same, the adjacent or the opposite quartile by each method were calculated. The degree of agreement was evaluated using the weighted kappa coefficient (κ).
Finally, Bland–Altman plots were used to illustrate the difference in energy and nutrient intakes between the EFR and the WDR against the mean of the two methods. Log-transformation of the data for the study participants was performed to normalize data(Reference Bland and Altman14). The horizontal dashed line indicates the mean of the differences (EFR – WDR); the limits of agreement are calculated as the mean difference plus or minus two standard deviations (d ± 1·96 sd). To examine whether the agreement between the methods varied with the magnitude of energy and nutrient intakes, the differences between the methods were plotted against their means. Pearson correlation coefficients were calculated to test the association between the differences and the means of the two methods. Ideally, the mean difference between the methods should be zero with no discernible bias, i.e. the mean differences should cluster on the horizontal continuous line of equality (y = 0). Any deviation of the mean difference line from the line of equality indicates a bias. Moreover, any systematic variation of the differences in dietary intakes across the range of dietary intakes suggests the presence of an additional systematic bias, which would provide further evidence of a limited agreement between the methods(Reference Bland and Altman14–Reference Grouven, Bender and Ziegler16).
Results
Overall, 50·7 % (n 34) of the participants included in the present analyses were girls. Children were on average 22·0 (sd 7·5) months old, with an age range from 10 to 36 months. Parental social class was uniformly distributed. In this population, mean Z-score was −0·11 (sd 0·90) for weight and −0·28 (sd 1·06) for height.
The sample's median energy and nutrient intakes, and the median differences in dietary intakes and the correlation of dietary intakes between the EFR and WDR, are presented in Table 1. Except for intakes of carbohydrate and iodine, dietary intakes recorded in the EFR were slightly higher than dietary intakes recorded in the WDR. The median intakes of linoleic acid (P = 0·001) and retinol (P = 0·004) were significantly higher in the EFR than in the WDR, while intakes of energy and other nutrients did not differ between the EFR and the WDR. For all dietary intakes, Spearman rank correlation coefficients between the EFR and the WDR ranged from 0·35 to 0·80. High correlation coefficients (≥0·70) were observed for intakes of Fe, iodine and Ca. The correlation coefficients were moderate (0·40 to 0·69) for intakes of energy and ten nutrients (protein, total fat, linoleic acid, α-linolenic acid, carbohydrate, retinol, folic acid, Mg, Zn and thiamin), while the correlation was low for ascorbic acid intake (<0·40).
Median daily intakes of energy and nutrients reported in the 3 d estimated food record (EFR, test method) and the 3 d weighed dietary record (WDR, reference method), differences between dietary intakes calculated from the EFR (test method) and the WDR (reference method) and Spearman rank correlation coefficients between the two methods, German toddlers aged 10 to 36 months (n 67)

Q1, first quartile; Q3, third quartile.
*For difference between EFR and WDR obtained by Wilcoxon signed-rank test.
The potential misclassification of energy and nutrient intakes reported in the EFR in comparison to the WDR is presented in Table 2. The proportion of toddlers classified within the same or the adjacent quartile ranged from 75 % for ascorbic acid intake to 96 % for Fe intake. Classification into the opposite quartile was 9 % or less for all dietary intakes, with highest levels of opposite classification for folic acid intake (8·96 %) and ascorbic acid intake (8·96 %). A moderate agreement (κ = 0·41 to 0·60) in ranking the participants according to their intake between the EFR and the WDR was observed for energy and nine nutrients (protein, fat, carbohydrate, retinol, Fe, iodine, Ca, Mg and Zn). An acceptable agreement (κ = 0·21 to 0·40) was seen for the other five nutrients (linoleic acid, α-linolenic acid, folic acid, thiamin and ascorbic acid).
Cross-classification for agreement between daily intakes of energy and nutrients reported in the 3 d estimated food record (EFR, test method) and the 3 d weighed dietary record (WDR, reference method) in German toddlers aged 10 to 36 months (n 67)

In addition, the Bland–Altman plots were considered for energy and nutrient intakes: Fig. 3 presents the Bland-Altman plots for energy, fat and Fe intakes as examples. The Bland–Altman plot of energy intake showed that the individual differences did not vary across the range of energy intake (Fig. 3A). The individual differences in energy intake between the two methods were not significantly associated with the mean from the two methods (Pearson correlation coefficient = 0·12, P = 0·3), which indicates that the variability and direction of the difference did not depend on intake level. The geometric mean difference for energy intake between the two methods (EFR –WDR) of 1·01 MJ/d indicated that, on average, the EFR overestimated energy intake by 1 % compared with the WDR. The upper and lower limits of agreement of 0·63–1·63 MJ/d indicated that the EFR could estimate the energy intake, for most participants, within a range of 63 % above to 37 % below the energy intake reported in the WDR.
Bland–Altman plots of agreement between dietary intakes reported in the 3 d estimated food record (EFR, test method) and the 3 d weighed dietary record (WDR, reference method) in German toddlers aged 10 to 36 months (n 67): (A) energy intake (MJ/d); (B) fat intake (g/d); (C) iron intake (mg/d). Data are log-transformed values. The differences between dietary intakes calculated from EFR (test method) and dietary intakes estimated from WDR (reference method) for each participant (y-axis) are plotted against the mean dietary intakes averaged from the two methods (x-axis). — · — represents the mean of the differences; – – – (upper and lower) represent the upper and lower 95 % limit of agreement (mean±2 sd), respectively; —— represents the line of equality (y = 0). The Pearson correlation coefficient of the individual differences of dietary intakes between the two methods with the mean reported by the two methods was 0.12 (P = 0·3) for energy intake, −0.13 (P = 0·3) for fat intake and −0.14 (P = 0·3) for iron intake
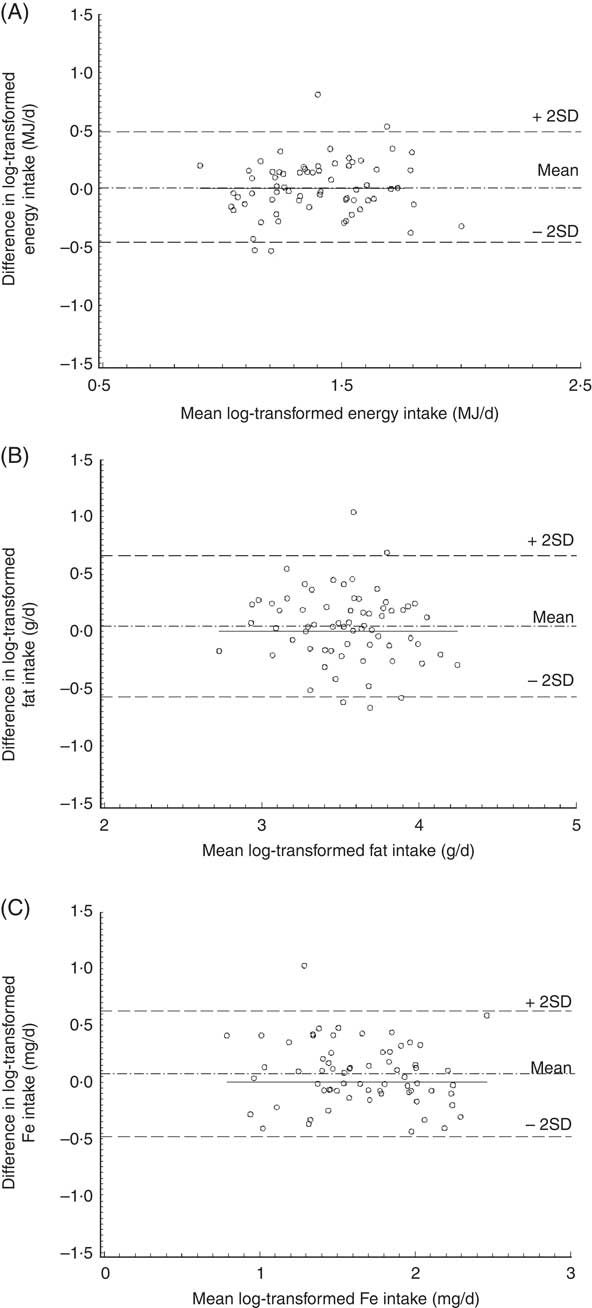
Similarly, the variability and direction of the individual differences in fat intake between the EFR and the WDR did not depend on intake level (Pearson correlation coefficient = −0·13, P = 0·3). On average, the EFR overestimated fat intake by 5 % compared with the WDR. Furthermore, for most participants, the EFR estimated fat intake within a range of 93 % above to 43 % below the fat intake reported in the WDR (Fig. 3B).
Figure 3C shows that there was no clear relationship of the individual differences in Fe intake between the two methods with the mean reported by the two methods (Pearson correlation coefficient = −0·14, P = 0·3). On average, Fe intake was overestimated in the EFR by 8 % compared with the WDR. For most participants, the EFR could estimate the Fe intake within a range of 87 % above to 38 % below the Fe intake reported in the WDR. Similar Bland–Altman plots to these three examples were found for the other nutrient intakes (data not shown).
Discussion
In the present study, we compared the dietary intakes of German toddlers estimated using a 3 d EFR with intakes estimated using a 3 d WFR as the reference. Our results suggest that this EFR provides valid estimations of dietary intakes in toddlers at the group level.
Correlation coefficients are useful to determine whether there is a linear trend in the responses between the test and reference methods. Except for intakes of linoleic acid, folic acid, thiamin and ascorbic acid, the correlation coefficients for energy and nutrient intakes in our study were higher than 0·5, which has been proposed to indicate validity(Reference Brunner, Stallone and Juneja17). However, since all foods and beverages consumed over the 3 d were recorded in one EFR, the within-person variance in the EFR (deattenuation) cannot be checked. In addition, correlation coefficients address only one aspect of the validation procedure; additional statistical assessments employing weighted κ and Bland–Altman statistics are required to ascertain validity. The weighted κ statistic should be >0·4 to confirm at least moderate agreement(Reference Landis and Koch18, Reference Masson, McNeill and Tomany19). A previous study revealed that it is more useful and meaningful to present the weighted κ value along with percentages of items correctly classified and misclassified (the recommendation is >50 % correctly classified and <10 % misclassified), since the weighted κ provides a single value to represent agreement(Reference Masson, McNeill and Tomany19). In our study, most of the κ values for dietary intakes were higher than 0·4. The proportions of our participants correctly classified were higher than 75 %, and the misclassification was 9 % or less for all dietary intakes. Although the classification of our participants into the same or the adjacent quartile was high, the absolute differences between quartiles for several nutrients were moderate to large (data not shown). In addition, Bland–Altman plots were produced as a comparative tool for assessment of different methods(Reference Bland and Altman15). The Bland–Altman plots in our analysis suggest a good agreement for the dietary intakes estimated from the EFR. As evidenced from correlation coefficients, cross-classifications and Bland–Altman plots, the overall level of validity of energy and nutrient intakes in our study was thus moderate to good at the group level.
To our knowledge, the present study is the first one to validate dietary intakes reported using an EFR against dietary intakes estimated from a WDR in a sample of toddlers. Comparisons with other study results are thus possible only to a limited extent. Similar studies in groups of children were conducted using FFQ(Reference Marriott, Robinson and Poole3, Reference Marriott, Inskip and Borland5, Reference Marshall, Eichenberger Gilmore and Broffitt20–Reference Araujo, Yokoo and Pereira24) or WDR(Reference Bokhof, Gunther and Berg-Beckhoff25). The correlation coefficients observed in our study are comparable with those reported in infants(Reference Marriott, Robinson and Poole3, Reference Marriott, Inskip and Borland5, Reference Marshall, Eichenberger Gilmore and Broffitt20, Reference Andersen, Lande and Arsky21) and children(Reference Parrish, Marshall and Krebs22, Reference Blum, Wei and Rockett23, Reference Bokhof, Gunther and Berg-Beckhoff25). Moreover, the percentages of participants correctly classified for energy and nutrient intakes in the present study are higher than those in other studies(Reference Andersen, Lande and Arsky21, Reference Araujo, Yokoo and Pereira24, Reference Bokhof, Gunther and Berg-Beckhoff25). Even though Bland–Altman plots are considered a gold standard in studies of methodical comparisons(Reference Grouven, Bender and Ziegler16), few validation studies in nutritional epidemiology in children have used this method over the past few years(Reference Marriott, Robinson and Poole3, Reference Marriott, Inskip and Borland5, Reference Bokhof, Gunther and Berg-Beckhoff25). The Bland–Altman plots in our study compare favourably with those in these studies(Reference Marriott, Robinson and Poole3, Reference Marriott, Inskip and Borland5, Reference Bokhof, Gunther and Berg-Beckhoff25).
The EFR used in our study slightly overestimated energy and nutrient intakes compared with the WDR. The estimation of portion size introduces imprecision into the diet record(Reference Biro, Hulshof and Ovesen8). In our study, for some foods and beverages, the dietary habits of toddlers and their commonly consumed portion sizes (e.g. half a banana) were used to predefine serving sizes in the EFR. In this way, parents may have overestimated the consumption of those foods or beverages. For individuals, these overestimations may be large; however, when calculating mean intakes at a group level, this error may be small and of little importance(Reference Bingham, Nelson and Paul26). In nutritional epidemiology participants are commonly grouped by their intake level, so such slight overestimations are acceptable for analyses of groups.
In the current study, the EFR proved to be a valid assessment method for estimating dietary intakes in toddlers at the group level compared with the WDR. It appears worthwhile to consider the characteristics of the study which may have resulted in the high level of validity seen. Nutritional intake was recorded by the toddlers’ parents. Most parents are highly committed when it comes to the food consumption of their children at these ages, and they are also well informed. Extending the food list in the EFR to include foods commonly consumed by German infants and toddlers may be another reason for a valid estimation of dietary intake for this population. Furthermore, the detailed information noted in the EFR for commercial infant/toddler foods and home-made or table foods may also have contributed to the high validity observed. In addition, the possibility of including foods in the EFR for which a close match can be selected to foods already existing in the food list, or noting when a particular food is not listed in the menu, is vital for avoiding underestimation of food intake. Finally, the meal occasions in the EFR, which are listed according to the typical meal structure in toddlers, may have improved the concentration and accuracy of parents performing the dietary recording.
This EFR was well accepted by most of our participants’ parents. It was easy to understand and more easy for parents to complete than the WDR. For the researcher, this EFR may incur more error than the WDR due to estimation of amounts of foods consumed. However, the possibility of noting foods in this EFR which are not listed in the menu and the inclusion of exact portion sizes in this EFR could reduce large errors. This EFR is more accurate than methods that measure past dietary intake, resulting in fewer foods and beverages consumed being missed out or forgotten. In addition, this EFR offers an advantage in terms of personnel costs, compared with costs for completion of a WDR.
Our study has several additional strengths including its representative study sample. In the current study, five age groups ranging between 10 months to 36 months were considered, and the parental social classes were uniformly distributed. The conclusion from the present results can thus be extended to general populations, e.g. to those toddlers and their parents whose dietary patterns are similar to those in Germany. Unlike other studies, which may be confounded by the use of standard sizes to turn raw information into nutrient data, we carefully converted the dietary intakes recorded in the EFR from serving sizes and household measures into grams using data of mean intakes for each food and beverage group in toddlers from the DONALD Study. A further advantage lies in the use of different statistical methods to determine agreement: Spearman correlation coefficients, cross-classification and Bland–Altman plots, which are considered a gold standard in studies of methodical comparisons.
Some limitations should be mentioned as well. First, the study has a relatively small sample size. However, our sample size of sixty-seven toddlers is acceptable compared with other validation studies in infants and toddlers. Second, potential bias due to energy under-reporting remains a possibility. However, analyses excluding under-reporters (n 2) yielded similar results. Having the two dietary instruments completed on the same days is another limitation. It may have confounded our results, since the order in which each instrument was completed may have had an impact on the estimation of food and beverage intakes. Moreover, all foods and beverages consumed over the 3 d were recorded in a single EFR, i.e. measurement error (within-person variance) could not be checked. Since biomarkers are recognized as the best parameters to assess validity, the lack of external biomarkers in the current study may be a further limitation. However, urinary or blood biomarkers are hardly feasible in an observational study in young children.
Conclusion
Our study suggests that this EFR is a valid assessment instrument for estimating the food and beverage consumption of toddlers at the group level. The 3 d EFR used in GRETA is a suitable tool for ranking energy and nutrient intakes in toddlers.
Acknowledgements
This work was supported by a research grant from Nestlé Nutrition GmbH, Frankfurt, Germany. None of the authors have any personal or financial conflicts of interest. G.C. conducted the analyses and wrote the manuscript. A.H. provided dietary data. M.K. supervised the study. All authors critically reviewed the manuscript for important intellectual content. The participation of all families in the study is gratefully acknowledged. The authors thank also the staff of TNS Healthcare, Munich, Germany for collecting the nutritional and other information of the study participants. The interpretation and reporting of these data are the sole responsibility of the authors.


