

1. INTRODUCTION
One of Portugal’s most important products is Port wine, which has been produced for centuries in the vineyards of Alto Douro, the valley region ~100 km east of Oporto. Several authors certify that Douro’s vineyards were first described by the Romans, indicating that they were cultivated by native people of the area and discovered by the troops of Julius Caesar and Pompeus (following the writings of Strabo and Appian of Alexandria). However, production improvements in the early 17th century based on the inclusion of brandy in the recipe and the maturation process in oak barrels generated the first Port wines, a refined predecessor to the current diversity of Port wine available (Stevenson Reference Stevenson2007). The role of Portuguese wine in the country’s economic growth has always been significant as a major agricultural contributor (Costa et al. Reference Costa, Palma and Reis2015).
England has always been the major importing country of Port wine (Martins Reference Martins1988). Even when Sebastião José de Carvalho e Melo (the Marquis of Pombal) founded the Companhia Geral da Agricultura e Vinhos do Alto Douro (Douro Wine Company) in 1756, England retained its position as the major customer for Port wines (Martins Reference Martins1988; Cardoso Reference Cardoso2003). The «Companhia» has already been discussed as one of the most important — and timeless — elements of Pombal’s mercantilist policies. In fact, its regulatory effects, its efforts towards regional organisation, its role in the development of northern Portugal and its political consequences have clearly surpassed both Pombal’s ambitions and even the Company’s longevity (Sousa and Pereira 2008). The mercantilist Pombal’s other Companhias (such as the Brazilian Companhias of Grao-Para and Maranhao, 1755-78, or Pernambuco and Paraíba, 1759-80) were neither as influential nor as enduring as Douro (Sousa and Pereira 2008).
Although England was the main export destination for Port wine, Brazil was its secondary market (Sousa and Pereira 2008). Since the creation of the Douro Companhia, Brazil received a yearly average of 3 per cent of the Port wine produced. The difference in import volume between England and Brazil is significant, which can be interpreted as a failure of Pombal’s intention to reduce the Portuguese dependency on the English market, which was also the final destination of much Brazilian gold (Crouzet Reference Crouzet1990). There are other reasons why Brazil was in second place, however, including the difficulty of reaching high levels of consumption of Port wine due to the Brazilian climate and the absence of a large Portuguese or English-born bourgeoisie, who were the main consumers of Port wine in Europe, as we shall examine further below.
In this work, however, we will observe that up until 1826, the export of Port wine reveals deeper implications concerning the Atlantic triangular trade (Braudel Reference Braudel2005) and the role of European political and military instability (namely the Napoleonic Wars), which generated structural breaks in the Port wine series which have been minimised until now.
We will examine these factors through time series processes, namely the detection of structural breaks and cointegration analyses on several historical series related to Port wine exports to Brazil.
The remainder of this paper is organised as follows. Section 2 reviews the literature on the history of the Port wine company and the main events occurring until 1826. Section 3 describes the empirical method used to evaluate the significance of these episodes in explaining the oscillations of the Companhia’s exports to Brazil, namely, the analysis of recurring structural breaks and vectors of error correction models. Section 4 concludes.
2. REVIEW OF THE LITERATURE
The Companhia Geral da Agricultura e Vinhos do Alto Douro was officially created by a royal charter signed on 10 September 1756. Its creation was a consequence of the mercantilist policies of the Marquis of Pombal (under the sovereignty of the Portuguese King Dom José I), who sought to alleviate the pressure of influential local landlords with interests in the Douro’s vineyards (Johnson Reference Johnson1989). There were additional pressures to diversify agricultural production in order to compensate taxation losses, mainly generated by the Brazilian gold crisis. Additionally, there is a large body of literature on the mercantilist and centralist reasons behind the stimulus for Pombal and King Jose I to develop the company, similar in kind to the English and Spanish India Companies. Madureira (Reference Madureira1997) also discusses the objectives of export market diversification behind this stimulus. Important studies on this topic include those of Falcon (Reference Falcon2005)Footnote 1 , Costa (Reference Costa2010) and Sousa and Pereira (2008).
The official intentions behind the creation of the Companhia were the protection of the authenticity of Port wine, the regulation of the wine-pricing system, and the minimisation of English influenceFootnote 2 on the Portuguese wine trade (Sousa and Pereira 2008). 1834 (Nunes Reference Nunes2004) is usually considered as the final year in which the Companhia functioned under the direct management of the Court.
The first of Pombal’s companies were those of Grão-Pará and Maranhão and Pernambuco and Paraíba (Rodrigues and Sangster Reference Rodrigues and Sangster2012), strategically linked with the administrative changes in the colony of Brazil, which was promoted to the status of Vice-Kingdom in 1775. However, the Brazilian gold and sugar crises of 1750 and 1760 led to the need to compensate taxation losses and maintain the currency’s strength. Bolstered by these incentives and with the support of influential men of the Douro Valley, who had been affected by the significant drop in wine exports in the 1760s, Pombal and José I promoted the creation of the Douro Wine Company or, in Portuguese, Companhia Geral da Agricultura e Vinhos do Alto Douro. According to Martins (Reference Martins1988), Port wine, Brazilian cotton and Brazilian sugar were the three main Portuguese exports between 1678 and 1810; thus, it is easy to conclude that in the 1760s, Pombal desired to broaden the base of future Portuguese exports (and also to explore personal rents, as suggested in the literature by Serrão Reference Serrão1993 and Maxwell Reference Maxwell1995.
The Companhia Geral da Agricultura e Vinhos do Alto Douro (hereafter the Companhia) had the power both to acquire the wine produced from the vineyards of the Portuguese Douro valley (identified as good for wine production) and to trade with national and international traders. Local producers could not refuse to sell their wines to the Companhia (Sousa and Pereira 2008) or to trade wines at prices other than those officially stated. Therefore, it is not unusual to consider the power of the Companhia as a monopsonistic power, often criticised by local producers and by international traders (Sousa Reference Sousa and Pereira2006).
The Brazilian market was a linchpin of the Companhia’s intentions beginning in 1756. Related to the provision of wine to Brazil, the Companhia had the exclusive obligation to satisfy Brazilian wine needs (Sousa and Pereira 2008). To oversee this task, the Companhia had three delegations or administrative bodies in the main coastal Brazilian cities of the time: Rio de JaneiroFootnote 3 (the capital of Brazil between 1763 and 1960), São Salvador da Baía (the capital of Brazil prior to 1763) and Recife. The presence of the Companhia in Brazil was intended to generate an additional market for Portuguese wines, and especially for Port wines that were suffering serious competition from other wines in English markets. It was also intended to improve trade between Portugal and her most important colonial territory (Sousa and Pereira 2008), Brazil.
According to Martins (Reference Martins1988), between 1772 and 1804, the yearly wine production of the Douro Valley increased from the 152,000 hl (1772) to 374,000 hl (1804)Footnote 4 . Corvisier (Reference Corvisier1976) observed that between the 17th and 18th centuries, Portuguese wine exports were valued between one half and two-thirds of all Portuguese exports. Additionally, the majority of the exports provided by the increasing production of Douro went to England, whereas only ~3 per cent of the total Portuguese wine export was sent to BrazilFootnote 5 . In the 18th century the Atlantic Ocean was at the core of the «triangular trade» between Europe, Africa and the Americas, as discussed by Fisher (Reference Fisher1971), Corvisier (Reference Corvisier1976), Labourdette (Reference Labourdette1986) and Braudel (Reference Braudel2005). Most world trade had a clearly established marketplace, one that consisted of the numerous ports across England, France, Spain, Portugal, Guinea and South American coastal areas (Boxer Reference Boxer1991). American metals (mostly gold and silver) were used to pay for textiles exported by English merchants to the consumers of southern Europe (Hanson Reference Hanson1986), as long as gold extraction in South America flourished until the end of the 18th century (Oliveira Marques Reference Oliveira1978).
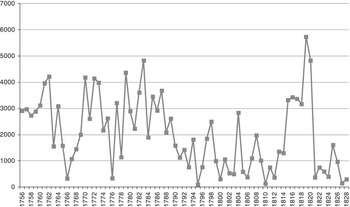
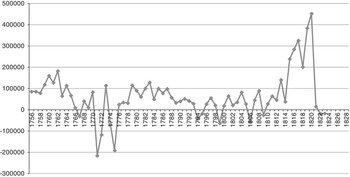
Although the Atlantic Ocean was the main route of this «world economy» (Magalhães Godinho Reference Magalhães Godinho1963; Wallerstein Reference Wallerstein2004), Douro Valley wine exports to Brazil were neither as significant nor as stable as we might anticipate (Maxwell Reference Maxwell1968). Figures 1 and 2, respectively, show the number of wine barrels exported to Brazil and the value of the Companhia’s balance sheets at constant prices, observed between 1756 and 1823.
NUMBER OF BARRELS OF WINE EXPORTED TO BRAZIL BY THE DOURO WINE COMPANY (1756-1828) Source: Sousa and Pereira (2008).
PROFITS/LOSSES OF THE DOURO WINE COMPANY REGARDING THE BRAZILIAN TRADE, 1756-1823 (CONSTANT PRICES; UNIT: 1,000 PORTUGUESE ESCUDOS OF 1999) Source: Calculations based on Sousa and Pereira’s data (2008), deflated by Valério (Reference Valério2001).
Authors such as Sousa and Pereira (2008) have previously described similar figures. They note that between 1756 and 1834, the Companhia exported more than 147,000 barrelsFootnote 6 of wine to Brazil (with a yearly average of 2,235 barrels). The Companhia started by exporting enormous numbers of barrels until 1765, almost 3,000 barrels annually. However, Sousa and Pereira (2008) also recognise the relevance of the downtrend of the Companhia’s exports to Brazil during the second half of 1770s due to a combination of several factors, including the end of Pombal’s government, the end of the Companhia’s monopoly in supplying wine and brandy to Brazil (by the Order of 6 August 1776), and the episodes of corruption mainly observed in the Companhia’s administrative delegation to Rio de Janeiro.
During the 1780s, the volume of the Companhia’s exports to Brazil remained relatively stable. After 1790, however, it is difficult to find a year in which the Companhia exported more than 2,000 barrels to Brazil (which represented less than 20 per cent of total Portuguese wine exports between 1796 and 1828). Only after the arrival of the Court headed by King João VI (followed by many other wealthy families of the aristocracy and bourgeoisie of Portugal) at Rio de Janeiro did the Companhia’s exports recover from the modest values that characterised the two previous decadesFootnote 7 . After Brazil achieved its independence in 1822, however, with the strong parallel competition between private houses of the Douro Valley and English businessmen and the overall reduction of trade volumes between Portugal and Brazil, the values of Portuguese wines exported by the Companhia to Brazil shrank to almost zero (Sousa and Pereira 2008).
Figure 2 shows the balance of the Companhia’s Brazilian trade. This figure does not exhibit as significant oscillations as appear in Figure 1. Initially, one can note that even with regulated prices (considered very high by Brazilian tradersFootnote 8 ), the Companhia did not achieve considerable profits from its Brazilian businessFootnote 9 . Sousa and Pereira (2008) suggest that the low profits shown in Figure 2 may be explained by the significant depreciation in the quality of the wines as a result of transportation across the Atlantic, the fraudulent behaviour of some of the merchants involved, and the high costs associated with transporting wine to Brazil, a relatively distant market.
Sousa and Pereira (2008) also consider the reasons behind the significant oscillations that characterise these figures, mainly Figure 1 (barrels of wine exported). Although Sousa and Pereira (2008) did not test their hypotheses in their descriptive work, they stated that some episodes could explain the oscillations described by the figures. These episodes were linked to the political and/or military instability in Portugal and Brazil, to the Douro Valley production cycle and to the life cycle of the Companhia (Maxwell Reference Maxwell1968). Even the appearance of independence movements in Brazil (such as the Inconfidência Mineira in 1789, the Inconfidência Baiana in 1798 or the Pernambuco episodes in 1801 and 1817) have been interpreted as explanations for the oscillations of trade and business in Brazil. Maxwell (Reference Maxwell2004) has also written about this influence.
As these authors have noted several economic and political episodes behind the oscillations in Figures 1 and 2, we must review the key episodes in the Luso-Brazilian trade of the Companhia between 1756 (the year of the Companhia’s creation) and 1828 (the initial years after Brazilian independence in 1822).
2.1. A Summary of the Main Economic and Political Episodes Involving Luso-Brazilian Trade Between 1756 and 1828
We have already noted that the Companhia was created on 10 September 1756. In the same year, its three main Brazilian delegations were established. Authors such as Sousa and Pereira (2008) identify the development and growth of Brazilian business during the 1760s. There is a first round of substitutions in the first generation of delegated managers in Bahia (1762) and Rio. The first mutual criticisms between the Companhia’s board of directors and the Brazilian delegated managers also appear in this decade. The board of directors criticised the excessive number of salesmen in the Brazilian delegations; as a response, Bahia’s managers criticised the low quality of the wines exported by the Companhia. The lobbying capacity of the Companhia gained a new dimension through the Resolution of 9 August 1765 by which the Companhia was guaranteed the exclusive right to sell all Portuguese wine in Brazil (an attempt to reduce the impact of the competition generated by wines from the Azores, Madeira and the Lisbon vineyards). Hancock (Reference Hancock2009) produced a very detailed work on this impact.
The 1770s are full of relevant episodes for the Companhia’s Brazilian trade. First, it was a difficult decade for the consumption of Port wine due to the increase in the number of European consumers leaving Brazil every year due to the exhaustion of the mines of Minas Gerais (Sousa Reference Sousa and Pereira2006). This decade was also marked by the death of King Jose I (1777) and the consequent demotion of the Marquis of Pombal (who died in 1782). The Companhia faced loud criticism from Portuguese and English voices alike; significant wine surpluses led to the end of many English trade houses in Oporto and the Companhia’s indebtedness began to rise due to the decrease in wine prices. Further, in August 1776, the Companhia lost its exclusive trade rights in Brazil, with the result that under certain circumstances, Brazilian ports were permitted to import wines without the Companhia’s involvementFootnote 10 . These various blows do not seem to have significantly impacted the Companhia’s exports to Brazil (see Figures 1 and 2), or the trade balance between Portugal and Brazil in this period (see the discussion of Bennassar and Marin Reference Bennassar and Marin2000). Finally, before his compulsory retirement, Pombal promoted a series of major inquiries into Port wine agents, namely into the delegated businessmen of Rio de Janeiro (1772-74) and many producers and tradesmen from the Douro Valley (e.g. the famous Devassa conducted by Mesquita e Moura between 1771 and 1775)Footnote 11 .
During the 1780s, there are reports signalling either the downtrend of Portuguese wines (even wines from other areas, such as the Minho region)Footnote 12 or the low quality of Port wines (Ludington Reference Ludington2009), with a few exceptions (Sousa Reference Sousa and Pereira2006). As Warre (Reference Warre1823) revealed as early as the 19th century, however, Port wine represented 75 per cent of all wine consumed in the United Kingdom between 1780 and 1795. Fernández Cortizo (Reference Fernández Cortizo2007) even suggests that overall Port wine exports (independently of the destination) peaked during the 1780s and 1790s.
The 1780s began with the improvement of the Douro river route with relevant works in the area of Cachão da Valeira (São João da Pesqueira/Carrazeda de Ansiães) ~94 miles from Oporto. These works continued for the next 10 years. Dona Maria I (the daughter of King Jose I) asked for a detailed report on the situation of the Companhia and Port wine. This report (authored by Luis de Sousa Coutinho in 1784) stated that the Companhia concentrated its benefits on a select few trading agents, relegating many of the small wine producers of the Douro region to second-tier status, leaving many of them to subsist in poverty (Oliveira Reference Oliveira and Marinho2007). The text is also especially favourable to the post-Pombal administrations (Pereira Reference Pereira2000) and reinforces the gains from the trade with new markets, such as the Baltic area. New demarcations occurred in the Douro Valley towards the end of the decade (1788 and 1791), leading to an expansion of the area considered good for Port wine production.
The first decades of the 19th century witnessed the importance of the United Kingdom as the main source of Portuguese imports. In fact, following Ribeiro (Reference Ribeiro1998) or Ludington (Reference Ludington2009), between 1810 and 1830, 50 per cent of Portuguese imports originated in the United Kingdom. Conversely, these decades mark a decrease in the relevance of England as a Portuguese export destination; in 1810, more than 80 per cent of Portuguese exports went to England, whereas 20 years later, that figure had been cut in half to 40 per cent. In any case, more than 50 per cent of Portuguese exports continued to be represented by Port wine, very little of which was shipped to Brazil. Sousa and Pereira (2008) suggested three possible explanations for the low significance of the Brazilian trade to the Companhia: difficulties selling the wine in the Brazilian market, the rise in competition from private traders and smugglers, and the Companhia’s disinterest in Brazil.
Meanwhile, England was aggressively expanding its influence in South America’s politics and businesses, taking advantage of the independence movements headed by Simon Bolivar and San Martin in the Spanish territories, and by Prince Dom Pedro in Brazil (1820-22). Consequently, by 1819 there were ~60 English firms working in Rio de Janeiro, with extensive evidence of the intention to establish a more permanent English community in Brazil, as indicated by the construction of houses of worship, a cemetery and a hospital (Sousa and Pereira 2008; Ludington Reference Ludington2009).
Following Fisher (Reference Fisher1971), Corvisier (Reference Corvisier1976), Boxer (Reference Boxer1991) and Braudel (Reference Braudel2005), we again highlight that the Atlantic space could be classified as a world economy in the 18th century. The economic literature typically focusses on the post-independence era to discuss the economic movements affecting certain areas or countries in this world economy. We wish to expand this strategy, however, by testing whether the Companhia’s business was also mainly driven by the great macroeconomic and monetary movements acting in the Atlantic world economy; namely, we wish to test the influence of world price dynamics and the exchange rate of the Portuguese currency. It is expected that a depreciation of the Portuguese currency (Fisher Reference Fisher1963) acts in the reverse direction to a rise in world prices (Simpson Reference Simpson1995; Nye and Va Reference Nye and Va2009), permitting increased exports of Douro wine (Warre Reference Warre1823; Martins Reference Martins1998; Jacquinet Reference Jacquinet2006).
3. EMPIRICAL SECTION: TESTING THE COMPANHIA’S BRAZILIAN TRADE BASED ON BUSINESS EPISODES, PRODUCTION CYCLES AND INTERNATIONAL ECONOMIC MOVEMENTS
As mentioned earlier, previous studies have suggested the importance of a few key episodes in explaining the oscillations in the Companhia’s exports to Brazil, focussing on dimensions such as the Companhia’s monopoly on providing wine to Brazil (Sousa Reference Sousa and Pereira2006), the corruption of agents trading wine to Brazil (Sousa and Pereira 2008), the presence of a wealthy class of consumers in Brazil (Martins Reference Martins1988) and Brazilian political instability (Maxwell Reference Maxwell2004)Footnote 13 . Therefore, in the first stage, we will examine whether our econometric procedures can statistically identify certain dates as structural breaks in the observed series and whether these dates point to the proximity of any of the possible events or episodes previously discussed in the literature review. This is a standard strategy for empirically evaluating the relevance of certain episodes in the oscillations of time series. For instance, the works of economic historians Jungmittag and Grupp (Reference Jungmittag and Grupp2006), McNown and Seip (Reference McNown and Seip2011) and Díaz-Fuentes and Revuelta (Reference Díaz-Fuentes and Revuelta2013) use this method to discuss the relevance of certain political and economic episodes in time series.
We also note that we are adding an alternative hypothesis to explain the oscillations of the Companhia’s exports to Brazil: the force of international economic flows (Fisher Reference Fisher1971; Corvisier Reference Corvisier1976; Boxer Reference Boxer1991; Braudel Reference Braudel2005). We will also test this hypothesis if the econometric procedures testing structural breaks do not return significant values for dates related to the episodes previously discussed.
Thus, in this first stage, we wish to observe the statistically confirmed structural breaks for the series of the Companhia’s exports to Brazil from 1756 and 1826 (considering the availability of data from our sources). We will observe the volume (measured by the number of barrels of wine) and the yearly reported profits or losses of these exports (measured at constant pricesFootnote 14 ). The source of these series was Sousa and Pereira (2008).
Instead of arbitrarily trying dates for the structural breaks (the traditional Chow test), we prefer to use tests with unknown dates (Baum Reference Baum2005). Modern tests for unknown dates comprise the tests for multiple time breaks (Clemente et al. Reference Clemente, Montañés and Reyes1998)Footnote 15 . Clemente et al. (Reference Clemente, Montañés and Reyes1998) are also able to test the presence of additive outliers (i.e. sudden breaks in the series) and innovational outliers (i.e. gradual shifts in the mean of the series)Footnote 16 .
Let b t identify each one of our two series (number of barrels of wine exported to Brazil and net balance of the Companhia’s business in Brazil). Therefore, to test the presence of multiple additive outliers, we estimate the following system of equations [1] (maintaining the forms used by Baum Reference Baum2005):
 $$\eqalignno{ & b_{t} {\,\equals\,}\alpha {\plus}\delta _{1} DU_{{1t}} {\plus}\delta _{2} DU_{{2t}} {\plus}e_{t} \cr & e_{t} {\,\equals\,}\mathop{\sum}\limits_{i{\equals}1}^k {w_{{1i}} DT_{{b1,t{\minus}i}} {\plus}} \mathop{\sum}\limits_{i{\equals}1}^k {w_{{2i}} DT_{{b2,t{\minus}i}} {\plus}} \rho e_{{t{\minus}i}} {\plus}\mathop{\sum}\limits_{i{\equals}1}^k {\theta _{i} \Delta e_{{t{\minus}i}} {\plus}z_{t} } $$
DU 1t =1 for the period t after the first break time and 0, otherwise. Equivalently, DU 2t =1 for the periods t after the second break time and 0, otherwise. T b1 and T b2 identify the breakpoints to be located by grid search (i.e. by identifying the minimal t-ratio for the hypothesis ρ=1). Following Baum (Reference Baum2005), we use DT bm,t =1 for t=T bm+1 and 0 otherwise, for m=1, 2.
To test ρ=1 with the presence of innovational outliers, we will test the following model (Baum Reference Baum2005):
 $$b_{t} {\,\equals\,}\alpha {\plus}\delta _{1} DU_{{1t}} {\plus}\delta _{2} DU_{{2t}} {\plus}w_{1} DT_{{b1,t}} {\plus}w_{2} DT_{{b2,t}} {\plus}\alpha b_{{t{\minus}i}} {\plus}\mathop{\sum}\limits_{i{\equals}1}^k {\theta _{i} \Delta b_{{t{\minus}i}} {\plus}z_{t} } $$
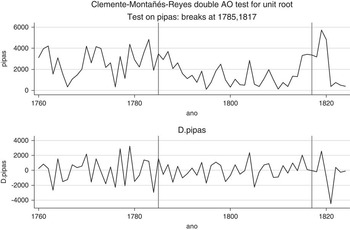
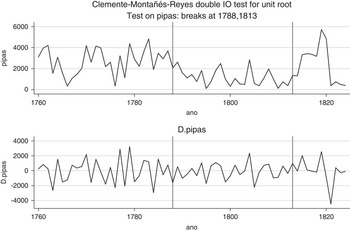
Table 1 shows the results from the tests of Clemente et al. (Reference Clemente, Montañés and Reyes1998) on the series of the Companhia’s exports to Brazil (1756-1826). Figures 3 to 6 were generated using Stata’s clemao2 and clemio2 routines.
BREAKPOINTS TESTED FOR THE SERIES OF (YEARLY GROWTH AND NUMBER OF) BARRELS OF WINE EXPORTED TO BRAZIL BY THE COMPANHIA (1756-1828), ASSUMPTION OF ADDITIVE OUTLIERS Note: The first graph relates to the number of barrels of wine exported; the second graph relates to the yearly growth in barrels of wine exported.
BREAKPOINTS TESTED FOR THE SERIES OF (YEARLY GROWTH AND NUMBER OF) BARRELS OF WINE EXPORTED TO BRAZIL BY THE COMPANHIA (1756-1828), ASSUMPTION OF INNOVATIONAL OUTLIERS Note: The first graph relates to the number of barrels of wine exported; the second graph relates to the yearly growth in barrels of wine exported.
BREAKPOINTS TESTED FOR THE SERIES OF (YEARLY GROWTH AND VALUE OF) COMPANHIA’S BRAZILIAN BUSINESS BALANCE (1756-1823), ASSUMPTION OF ADDITIVE OUTLIERS Note: The first graph relates to the value of the Brazilian business balance; the second graph relates to the yearly growth in the Brazilian business balance.
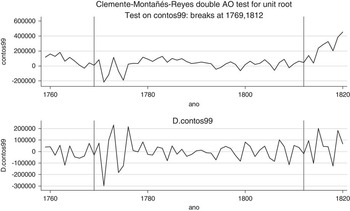
BREAKPOINTS TESTED FOR THE SERIES OF (YEARLY GROWTH AND VALUE OF) COMPANHIA’S BRAZILIAN BUSINESS BALANCE (1756-1823), ASSUMPTION OF INNOVATIONAL OUTLIERS Note: The first graph relates to the value of the Brazilian business balance; the second graph relates to the yearly growth in the Brazilian business balance.

TEST OF THE COMPANHIA’S EXPORTS TO BRAZIL
Note: Significance level: ***, 1%; **, 5%; *, 10%.
Source: Clemente et al. (Reference Clemente, Montañés and Reyes1998).
Table 1 shows that the series of barrels of wine is characterised as most likely having only one breakpoint. Depending on the assumption of having additive («sudden breaks») or innovational (gradual) outliers, the breakpoint will be 1785 (t-statistics=−3.678) or 1788 (t-statistics=−3.094). In any case, it seems that these dates and the negative sign of the t-statistic reinforce the hypothesis of Sousa (Reference Sousa and Pereira2006) and Oliveira (Reference Oliveira and Marinho2007), suggesting that the volume of exports to Brazil (measured by barrels of wine) was mainly affected by the downtrend of the 1780s due to a combination of bad production years, the political retirement of Pombal, and the loss of monopoly privileges held by the Companhia.
The traditional hypothesis of the «Court at Brazil» — between the flight in 1808 and the return of Dom Joao VI in 1821 — is not clearly validated by our results. Although the dates of 1817 (assumption of additive/gradual outliers) and 1813 (assumption of innovational/sudden outlier) were signalled as probable breakpoints, the respective t-statistics do not allow us to assume that these years marked a significant change in the profile of the series of barrels of wine exported to Brazil with a significance level below 10 per cent.
The period after 1809, however, can be associated with a positive change in the series of the Companhia’s Brazilian business balance. For this series, the years 1812 and 1813 were signalled as statistically significant breakpoints (at a significance level below 1 per cent). This evidence follows the conventional hypothesis that the presence of the Portuguese Court at Rio de Janeiro promoted an improvement in the Companhia’s Brazilian trade balance, although the number of barrels of wine exported did not increase so clearly (as denoted by the analysis of the respective series). The year 1769 was also identified as a statistically significant breakpoint (significance level of 10 per cent), being associated with a sudden decrease in the profits reported by the Companhia’s Brazilian business.
Given the dates identified as optimal breakpoints by the test of Clemente et al. (Reference Clemente, Montañés and Reyes1998), we received additional evidence favouring our hypotheses related to the relevance of international trade flows on the Companhia’s exports to Brazil. In fact, the dates statistically found to be structural breaks are hardly close to the Portuguese or Brazilian episodes traditionally linked to changes in the Companhia’s exports. Therefore, at a second empirical stage, we will employ the convenient econometric procedure to analyse whether and how the series of the Companhia’s exports to Brazil is robustly related (cointegrated) with the series of international trade, such as the Portuguese exchange rate (reis/pounds) or world commodity prices.
In the review of the literature we saw that authors such as Boxer (Reference Boxer1991) and Braudel (Reference Braudel2005) have already argued that the Atlantic trade experienced major changes during the 18th century, a consequence of the huge economic changes acting on the international economy.
Following Fisher (Reference Fisher1971) and Maxwell (Reference Maxwell2004), we recall that these dimensions correspond to the moves from the currency market (observable in the exchange rate of the Portuguese reis) and to the evolution of world commodity pricesFootnote 17 . However, we must control our hypothesis concerning international trade with the variables traditionally discussed as influencing the Companhia’s exports, namely wine production in the Douro Valley (Sousa Reference Sousa and Pereira2006) and total Portuguese wine exports (Sousa and Pereira 2008).
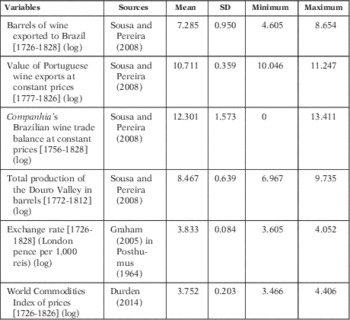
Tables 2a and 2b shows the descriptive statistics of our variables and the related sources. We have used the logarithms of our variables to discuss the variables’ estimated elasticities properlyFootnote 18 .
DESCRIPTIVE STATISTICS AND SOURCES OF THE VARIABLES TESTED
Note: In parentheses, optimum number of lags using Schwarz Criteria. d identifies the level of differentiation of the series. In square parentheses, the 1% critical value.
AUGMENTED DICKEY–FULLER TESTS
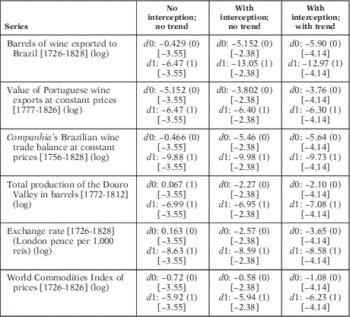
Note: In parentheses, optimum number of lags using Schwarz Criteria. d identifies the level of differentiation of the series. In square parentheses, the 1% critical value.
Following Krolzig and Hendry (Reference Krolzig and Hendry2000), we analyse the stationarity of the series. This step is relevant for selecting the proper specification in the vector error correction models (VECM) that will support our analysis of the cointegration spaces. Using Augmented Dickey–Fuller (ADF) statistics for the series, we confirmed that these series are stationary at the first differences. Depending on the assumption made for interception and trend, some of the series can be considered as stationary at the levels. Following Lutkepohl and Kratzig (Reference Lutkepohl and Kratzig2004) this is not a relevant issue because, «it is convenient to consider systems with both I(1) and I(0) variables. Thereby the concept of cointegration is extended by calling any linear combination that is I(0) a cointegration relation(…)».
We estimated the VECM considering the optimal number of lags in each series, observing the Schwarz Information Criteria and including a constant in the cointegration equations (Oxley and McAleer Reference Oxley and McAleer1999)Footnote 19 . Our results (detailed in Table 3a) suggested the existence of three cointegration relations involving our variables.
JOHANSEN COINTEGRATION TESTS RESULTS
Note: Significance level: *, 1%.
Variables set: (i) barrels of wine exported to Brazil [1726-1828] (log). (ii) Value of Portuguese wine exports at constant prices [1777-1826] (log). (iii) Companhia’s Brazilian wine trade balance at constant prices [1756-1828] (log). (iv) Total production of the Douro in barrels [1772-1812](log). (v) Exchange rate [1726-1828] (pence per 1,000 reis) (log). (vi)World Commodities Index of prices [1726-1826] (log). Two lags had been used in the vector error correction models.
TRACE STATISTICS

Note: Significance level: *, 1%.
Table 3b shows the statistical values of the most common tests of the stability and robustness of the specification of the VECM: the trace test, Portmanteau test, joint significance, Autoregressive conditional heteroskedasticity (ARCH) and AR-4 tests. Checking this information, we can conclude that there are no significant problems regarding the stability and robustness of the specifications. Tables 3a and 3b also shows the optimal number of lags for the variables in the VECM and the average time value used to adjust the dependent variable.
Equations [3] to [5] reveal the estimated results for our three cointegration equations (standard errors are in parentheses).
We also notice that under valid cointegration relations, there are no serious problems related to the possibility of multicollinearity or endogeneity among the regressors. In spite of this claim, following Neuhaus (Reference Neuhaus2006, p.122), we run a test on the multicollinearity of the independent variables in equations [1] to [3], finding Variance Inflation Factors below 10. Because these values are below 10, we can therefore confirm the absence of multicollinearity problems in the estimated equations.
We also estimated the Durbin–Hu–Hausman test for equations [3] to [5]. We found significant P-values for all the independent variables of these equations, meaning that we can confirm the absence of endogeneity problems. Full details are available upon request.
 $$\eqalignno{BrazExport\_\,barrels_{t} {\,\equals\,}\mathop{{31.88}}\limits_{{(5.66)}} {\plus}\mathop{{2.40}}\limits_{{(0.58)}} produced\_barrels_{t} \cr {\minus}\mathop{{6.88}}\limits_{{(1.83)}} pences_{t} {\minus}\mathop{{6.16}}\limits_{{(0.84)}} world\_prices_{t} {\plus}e_{t} $$
 $$\eqalignno{WinePortug\_\,Export_{t} {\,\equals\,}\mathop{{7.24}}\limits_{{(1.46)}} {\plus}\mathop{{6.45}}\limits_{{(1.21)}} produced\_barrels_{t} \cr {\minus}\mathop{{9.75}}\limits_{{(3.79)}} pences_{t} {\minus}\mathop{{8.50}}\limits_{{(1.72)}} world\_prices_{t} {\plus}e_{t} $$
 $$\eqalignno{BrazTrade\_\,Balance_{t} {\,\equals\,}\mathop{{{\minus}17.45}}\limits_{{(2.38)}} {\minus}\mathop{{0.529}}\limits_{{(0.085)}} produced\_barrels_{t} \cr {\minus}\mathop{{0.001}}\limits_{{(0.263)}} pences_{t} {\minus}\mathop{{0.183}}\limits_{{(0.122)}} world\_prices_{t} {\plus}e_{t} $$
As we are working with log–log models, we can suggest (merely for illustrative purposes) that an increase of 1 per cent in the number of barrels of Douro wine tended to increase the exports to Brazil by 2.4 per cent and a rise of 6.5 per cent in Portuguese wine exports overall. Given the previously mentioned regulations on Brazilian trade (Sousa Reference Sousa and Pereira2006; Sousa and Pereira Reference Sousa2006), we also observe how world prices are a variable whose estimated coefficient in equation [5] has been found as statistically non-significant.
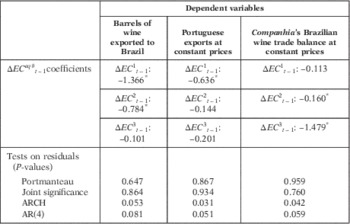
Tables 3a and 3b reveal the statistics of the proper tests related to the study of the cointegration vectors involving our six variables (trace set, estimation of adjustment speeds, and residuals’ stability — Portmanteau, Joint significance, ARCH and AR-4). It also shows the adjustment speed of each dependent variable ΔEC eq# t−1 to each one of the three cointegration vectors. Therefore, and also for illustrative purpose, the (statistically significant) estimated coefficient −0.636 in the second column suggests that 63.6 per cent of the adjustment to equilibrium takes place each period (year). So, if there was a negative shock in the long-term equilibrium between Douro wine production, world prices and exchange rates, Portuguese exports took about 1.5 years to recover from that shock in the studied period (1756-1828).
As noted above, our six variables constitute three cointegration spaces. Observing the coefficients estimated for ΔEC
eq#
t−1 in the VECM, we can compute the speed of adjustment for the models. In our case, we observe that there is a high speed of adjustment for the series, especially for the series of barrels of wine exported to Brazil, in column 5 (below 1.5 years, considering the formula for the adjustment speed: ${1 \over {\Delta EC^{{eq\,\#\,}} _{{t{\minus}1}} }}$
). This shows that the number of barrels exported to Brazil reacted much more quickly to an impulse from one of the independent variables (Douro production or changes in international markets) rather than, for instance, the aggregate value of total Portuguese wine exports (adjustment speeds are significantly higher than those computed for the series of barrels of wine exported to Brazil).
${1 \over {\Delta EC^{{eq\,\#\,}} _{{t{\minus}1}} }}$
). This shows that the number of barrels exported to Brazil reacted much more quickly to an impulse from one of the independent variables (Douro production or changes in international markets) rather than, for instance, the aggregate value of total Portuguese wine exports (adjustment speeds are significantly higher than those computed for the series of barrels of wine exported to Brazil).
Our results show that the Companhia’s exports to Brazil were mainly driven by international economic forces beginning in the second half of the 18th century. The majority of the previous literature on the topic of the Companhia’s trade to Brazil has focussed on the relevance of particular motivations influencing trade flows. Authors such as Martins (Reference Martins1988) and Sousa (Reference Sousa and Pereira2006) observed that the volume of wine exported to Brazil, although it was the Companhia’s secondary export destination, was almost residual in comparison with that sent to English ports.
This almost residual position led to the opportunity to explain the oscillations in this trade as being dependent on four major forces identified in the literature. The first force regards the duty of the Companhia to meet Brazilian needs with the minimum volume of wine demanded by regulations (Sousa and Pereira 2008). The second relates to the influence of the honesty/corruption of Brazilian traders (Sousa and Pereira 2008). The third explanation came from the presence of a significant Portuguese and English-born middle and upper-middle class of people living in Brazil or the relevance of the Lisbon Court at Rio beginning in 1808. Finally, the fourth classical reason concerns Brazilian political stability, namely the absence of turmoil stemming from the fight for independence (Maxwell Reference Maxwell2004).
Our results now confirm that the Brazilian wine trade depended mainly on major international economic trends, an argument advanced by authors such as Fisher (Reference Fisher1971) and Braudel (Reference Braudel2005). However, these authors have generally discussed the Brazilian role in the Portuguese–English trade and diplomatic relations. Our results confirm that, even more than total Portuguese wine exports, the Companhia’s exports to Brazil (equation [1]) were increased by increased production in the Douro Valley, the devaluation of the Portuguese currency («reis»), and lower world prices.
Although equation [2] also confirms these dimensions as interfering in global Portuguese wine exports, we also observed that the Companhia’s exports to Brazil were more reactive to any impulse from the independent variables. We interpret this reactivity as additional evidence of the organisation of the Companhia and its ability to respond to a demand shock caused by Brazilian consumers and traders quickly. Following Sousa (Reference Sousa and Pereira2006), this flexibility, improved by the monopolistic relationship characterising the Companhia’s trade in Brazil, is also a result of the internal organisation of the Companhia and the knowledge of its board of directors concerning the international wine market.
Finally, we observed from equation [3] that the years characterised by a rise in production of Douro Valley wine were associated with a decrease in the Companhia’s Brazilian balance. This is clear evidence that the prices of Douro wine reacted to the production surplus, leading to lower revenues that generated negative balances given the rigidity of costs. From this evidence, we achieved observations very similar to those of Bennassar and Marin (Reference Bennassar and Marin2000) and Sousa and Pereira (2008).
We also returned to the causality analysis of the effect of the independent variables on the dependent variables in equations [3] to [5]. Following Lütkepohl (Reference Lütkepohl1991), we ran the traditional class of Granger causality tests and instantaneous causality tests (Lütkepohl Reference Lütkepohl1991). We confirmed the causality direction of our equations, showing the special significance of the causal influence of world prices on Portuguese wine exports to Brazil (χ 2: 12.68; asymptotic P-value: 0.005Footnote 20 ). Table 4 details some of the relevant statistics.
CAUSALITY TESTS
Source: See text.
4. CONCLUSION AND FURTHER RESEARCH
The export business of the Douro Wine Company was analysed by highlighting the important particularities of its business with the Brazilian territories between 1756 and 1826. Although the Companhia’s Brazilian business was often considered as a residual dimension of its overall business, we observed that, contrary to some of the established literature, the export of barrels of wine to Brazil and the oscillations in the related profits were especially susceptible to the influence of the Atlantic economy.
We used special time series techniques, namely the analysis of structural breaks and vector of error correction models. In our analysis, we included different time series, such as the total number of barrels of wine exported, the Companhia’s profits at constant prices, total Portuguese wine exports, the world index of prices, the Douro Valley wine production and the exchange rate of the Portuguese currency, observed between 1756 and 1826.
We observed that more important than particular episodes, the Brazilian business of the Douro Wine Company was already being driven by the major monetary variables that characterised Braudel’s world economy. Therefore, we found evidence favouring the hypothesis that one of the most relevant of the Marquis of Pombal’s companies was reacting to the macroeconomic forces of the international economy, following the claims of authors such as Labourdette (Reference Labourdette1986), who stated that the Portuguese agricultural sector of the 18th and 19th centuries was widely integrated into the dynamics of world trade of that time.
We highlight six future challenges derived from this research. The first challenge relates to the relevance of studying the economic and business flows of the Marquis of Pombal’s other companies (namely Grão-Parã and Maranhão, and Pernambuco and Paraíba) to offer additional insights into the integration of Brazilian trade in the 18th century Atlantic world economy. The second challenge relates to the analysis of the sensitivity of wine prices established by royal charter to changes in the weather or political and local pressure; this further analysis is important because the regulation of prices introduced a factor of inflexibility into the Portuguese wine market, which can be explored as a cause of the subsequent movement of wine producers in the Douro Valley. We also wish to explore the different reactions of the various wines («Embarque», of the highest quality, vs. «de Ramo», oriented for local consumption) to the Portuguese exchange rate. Fourth, given Pombal’s personal interests in the wine sector (Maxwell Reference Maxwell1995, p. 63), it would be relevant to observe the importance of the Douro Valley’s movements in the evolution of his powers and personal wealth. Fifth, there are relevant primary sources that can be explored and which can suggest potential developments of this analysis. Namely, I am focussing on the Arquivo Historico Ultramarino/Overseas Historical Archive or on the Arquivo Nacional do Brasil/Brazilian National Archive. These archives contain many letters and official and personal documents that will undoubtedly offer a vivid image of the historical episodes analysed here from a more econometric and statistical point of view. Finally, alternative estimation methods (such as Dynamic Ordinary Least Squares (OLS), Autoregressive Distributed Lags’ regressions or Pesaran’s cointegration method) can be used to complement Johansen cointegration methods and to explore the dynamics of these variables.


