


Epidemiological studies suggest that a diet high in fat and red meat may increase the risk of colon cancer, whereas a high intake of fibre and complex carbohydrates may protect against it(Reference Bingham1, 2). A recent report by the World Cancer Research Fund has also shown that different dietary constituents modify a multitude of processes in both normal and cancer cells(2). One of the potentially protective groups of dietary constituents are prebiotics, which are non-digestible food ingredients that beneficially affect the host by selectively stimulating the growth and/or activity of certain groups of beneficial bacteria while maintaining potential pathogens at low levels(Reference Gibson, Beatty and Wang3). Prebiotics are fermented by these beneficial bacteria, resulting in the liberation of SCFA(Reference Jenkins, Kendall and Vuksan4). Butyrate, a four-carbon SCFA, has received much attention as a possible chemoprotective agent(Reference Beyer-Sehlmeyer, Glei and Hartmann5). Interest in its role as a possible protective agent has arisen from its anti-proliferative and pro-apoptotic effects on colon cells(Reference Hague and Paraskeva6). Moreover, butyrate seems to be of essential importance for the metabolic welfare of normal intestinal epithelia where it prevents mucosal atrophy(Reference Wachtershauser and Stein7). Among various prebiotics inulin and oligofructose have been subjected to extensive research(Reference Roberfroid8, Reference Roberfroid9). Inulin-type fructans are the natural constituents of a wide range of common vegetables and fruits(Reference Coussement10) such as onion and garlic. Typically, inulin has a degree of polymerisation between 3 and 60 (average degree of polymerisation about 12) and is produced industrially from chicory roots by hot water extraction, followed by refining and spray drying(Reference Pool-Zobel, Van Loo and Rowland11). Structurally, inulin-type fructans are polydisperse carbohydrate materials consisting mainly of β-(2-1)-fructosyl–fructose links. This linkage cannot be hydrolysed by pancreatic or brush-border digestive enzymes(Reference Klinder, Gietl and Hughes12). Therefore these fructans reach the colon undigested, where they are fermented by Bifidobacterium spp. and other lactic acid-producing bacteria. Potential fermentation products of inulin include SCFA and especially an increased relative proportion of butyrate as a result of anaerobic fermentation. These fermentation products are shown to be protective in different stages of cancer onset since they regulate colonic epithelial turnover and induce apoptosis in colon adenoma and cancer cell lines(Reference Hague, Elder and Hicks13). In vivo studies by Reddy et al. (Reference Reddy, Hamid and Rao14) and Buddington et al. (Reference Buddington, Donahoo and Buddington15) evaluated the chicory fructans for their potential to inhibit the formation of aberrant crypt foci (ACF) in the colon of rats and mice. These findings suggested that the incidences of ACF in the distal colon after exposure to potential model carcinogens were lower in the inulin and oligofructose-fed group than in the control group. These studies were further supported by Poulsten et al. (Reference Poulsen, Molck and Jacobsen16) who also observed a significant inhibition in the number of ACF in rats after feeding inulin. An in vitro study by Klinder et al. also reports distinct cellular functions of inulin in inhibiting growth and metastasis in colon tumour cells(Reference Klinder, Gietl and Hughes12). All of these findings underline the potential of these fructans to prevent the formation and progression of colon cancer. In addition to increasing SCFA, prebiotics have also been shown to reduce the amount of secondary bile acids(Reference Owen17) which can be tumour promoting(Reference Nagengast, Grubben and van Munster18). Studies report that fermentability of prebiotics plays a role in binding these carcinogens, thus blocking access of these substances to the colonic mucosa(Reference Hijova and Chmelarova19). However, the majority of published studies concerning the effects of SCFA and bile acids on colon cell proliferation have considered these dietary factors separately. In vivo both are present in the colon and may therefore influence each other's action directly or indirectly. To investigate this, we prepared a complex Synergy fermentation supernatant fraction (SFS) by in vitro fermentation of Synergy 1 (inulin enriched with oligofructose) with human gut microbiota. In vitro fermentation experiments revealed that molecules with a degree of polymerisation >10 such as inulin are fermented, on average, half as quickly as molecules with a degree of polymerisation of < 10 such as oligofructose(Reference Ten Bruggencate, Bovee-Oudenhoven and Lettink-Wissink20). Rapid fermentation of oligofructose by the intestinal microflora may lead to high luminal concentrations of organic acids which in turn may induce damage to the mucosal barrier(Reference Ten Bruggencate, Bovee-Oudenhoven and Lettink-Wissink20). Therefore, in order to decrease the rapid fermentation of oligofructose, Synergy 1 is enriched with inulin. Thus the longer-chain (inulin) is fermented at a slower and selective rate which maintains the metabolic activity of flora for a longer period of time(Reference van Loo, Clune and Bennett21). To analyse the possible effects of these samples on the prevention of colon cancer, the influence on cell growth and apoptosis were examined in highly transformed HT29 colon adenocarcinoma(Reference Kiefer, Sehlmeyer and Pool-Zobel22) and preneoplastic adenoma cells (LT97)(Reference Richter, Jurek and Wrba23). Since it has been shown earlier that apoptosis-inducing activities of SCFA are reduced by secondary bile acids(Reference McMillan, Butcher and Wallis24), we also determined how deoxycholic acid (DCA), a secondary bile acid, may interfere with this biological effect. Additionally, we compared the results with a synthetic fermentation mixture (SFM) mimicking the SFS in the amount of SCFA and DCA. Altogether, the results of our experiments were expected to enhance our understanding of the possible chemoprotective properties of prebiotics and their specific role in secondary cancer prevention.
Materials and methods
In vitro fermentation of Synergy 1
Synergy 1, a commercially available mixture of inulin enriched with oligofructose, was obtained from ORAFTI (Tienen, Belgium). The fermentation of Synergy 1 was conducted in vitro for 24 h under anaerobic conditions using human faecal samples as a source of undefined bacteria according to a described procedure(Reference Barry, Hoebler and Macfarlane25). Faecal samples from three different healthy adult Caucasian donors were pooled. The donors consumed their normal diet without any restrictions. The use of nutritional supplements and antibiotics was forbidden for at least 6 months preceding the donation of faeces. According to Barry et al. we used 10 g/l fermentable substance(Reference Barry, Hoebler and Macfarlane25). A negative control containing only the faecal samples was prepared as a faecal blank (FB). The SFS and FB were divided into aliquots and stored at − 80°C. Samples were sterilised two times by filtration (pore size 0·45 μm and 0·22 μm) before use. Since fermentation of dietary fibre by colonic bacterial flora produces SCFA, mainly acetate, propionate and butyrate, and reduces the concentration of secondary bile acids, mainly DCA(Reference Alberts, Einspahr and Earnest26), we determined SCFA and DCA concentrations by GC as described elsewhere(Reference Glei, Hofmann and Kuster27, Reference Keller and Jahreis28).
Preparation of synthetic fermentation mixture
An SFM mimicking the SFS was prepared by mixing the required concentrations of SCFA (sodium acetate, sodium butyrate (Merck, Darmstadt, Germany); sodium propionate (Fisher Scientific, Schwerte, Germany)) and DCA (Sigma-Aldrich, Steinheim, Germany). Additionally to identify whether bile acids could modify the apoptosis-inducing effects of SCFA we investigated SCFA and DCA individually. All the synthetic mixtures were prepared by dissolving in the respective cell-culture medium (listed below).
Cell lines and culture conditions
HT29 and LT97 cell lines(Reference Kiefer, Sehlmeyer and Pool-Zobel22, Reference Richter, Jurek and Wrba23) were used for all experiments. Passages 30–40 of HT29 and 29–35 of LT97 cells were used for the experiments in the study. HT29 cells were maintained in Dulbecco's modified Eagle medium (Invitrogen, Karlsruhe, Germany), supplemented with 10 % fetal calf serum whereas LT97 cells were maintained in MCDB 302 medium (Biochrom, Berlin, Germany) containing 20 % L15 Leibovitz medium, 2 % fetal calf serum, 0·2 nm-triiodo-l-thyronine, 1 μg/ml hydrocortisone, with 10 μg/ml insulin, 2 μg/ml transferrin, 5 nm-sodium selenite, 30 ng/ml epidermal growth factor and 50 μg/ml gentamicin.
Determination of metabolic activity
To assess the metabolic activity, HT29 cells were incubated with the SFS and FB 24 h after seeding in ninety-six-well microtitre plates whereas LT97 cells were incubated after 5–6 d (according to 50–70 % confluence). A concentration range of 1·25–20 % (v/v) was tested. Metabolic activity (measure of cell viability) was determined by the cell titre blue (CTB) assay(Reference Klenow, Glei and Haber29). At 2 h before the end of the incubation time 20 μl of CTB reagent (Promega, Mannheim, Germany) was added to each well. Metabolic activity was determined by fluorimetric analysis with excitation at 520 nm and emission at 595 nm (Spectrafluor Plus; Tecan Germany GmbH, Crailsheim, Germany). Results were normalised with cell number determined on the basis of cell growth (described below).
Determination of cell growth
Effects on cell growth were also determined in ninety-six-well microtitre plates after removal of CTB reagent followed by fixing and permeabilising the cells with methanol for 5 min, and addition of 20 μm-fluorescent DNA stain, 4′,6-diamidino-2-phenylindole dihydrochloride (Sigma-Aldrich, Germany). After 30 min, DNA content, as a reflection of the number of remaining cells, was detected by fluorimetric analysis with excitation at 360 nm and emission at 465 nm in a microplate reader (Spectrafluor Plus; Tecan Germany GmbH, Crailsheim, Germany)(Reference Glei, Hofmann and Kuster27). Results were calculated on the basis of a control medium set to 100 %.
Determination of poly(ADP-ribose) polymerase cleavage by Western blot
For the determination of apoptosis, both cell lines were treated with 5 and 10 % of SFS and equal concentrations of corresponding SFM, SCFA, DCA and FB. Cells were incubated for 24 and 48 h and lysed with cell lysis buffer (20 mm-2-amino-2-hydroxymethyl-propane-1,3-diol (Tris)-HCl (pH 8·0), 150 mm-NaCl, 10 % glycerol, 2 mm-EDTA, 1 mm-dithiothreitol, 1 % Nonidet P40, 0·5 mm-Pefabloc SC, 1 mm-PMSF, 1 μg/ml Pepstatin A, 1 μg/ml leupeptin, 1 mm-sodium orthovanadate, 1 mm-dithiothreitol). The cell lysates were analysed for total protein content using the method of Bradford with bovine serum albumin as the standard protein(Reference Bradford30) and stored at − 20°C until use. The cell lysates were diluted with loading buffer (125 mm-Tris, 2 % SDS, 10 % glycerol, 6 m-urea, 324 mm-dithiothreitol and 0·1 % bromphenolblue) and denatured for 5 min at 99°C in a thermomixer. The proteins (40 μg of total protein) were loaded and subjected to SDS-PAGE (stacking gel, 4 % (w/v); separating gel, 10 % (w/v) acrylamide), blotted to a nitrocellulose membrane (Schleicher & Schuell, Dassel, Germany) and blocked with 1 % milk protein. The membrane was incubated overnight with a polyclonal rabbit-anti-poly(ADP-ribose) polymerase (PARP) antibody (1:1000 dilution; Cell Signalling Technology, Frankfurt, Germany). PARP is a 116 kDa protein which is cleaved during apoptosis, for example, by caspase-3, resulting in a cleaved 85 kDa fragment and a 31 kDa fragment(Reference Tewari, Quan and O'Rourke31). This 85 kDa fragment is detected by the employed antibody. As a loading control, a specific monoclonal mouse-anti-β-actin antibody in 1:40 000 dilution (Sigma-Aldrich, Taufkirchen, Germany) was used. The blots were probed with corresponding secondary mouse anti-rabbit or goat anti-mouse antibodies conjugated with horseradish peroxidase (1:800 dilution) for PARP and β-actin, respectively, for 1 h at room temperature. After rinsing the membrane, specific bands were visualised by enhanced chemiluminescence. The densitometric quantification of band intensities was done using Quantity One 4·1 (Bio-Rad, Munich, Germany). Data were presented as mean values and standard deviations of three independent experiments.
Statistical evaluation
Mean values and standard deviations or standard errors of the mean, respectively, were calculated from at least three independently reproduced experiments. Each independent experiment was performed in triplicate for cell growth and cell metabolism studies. Differences were calculated by one-way or two-way ANOVA, including the Bonferroni post hoc test with selected pairs, using GraphPad Prism (version 4.0 for Windows; GraphPad Software, Inc., San Diego, CA, USA).
Results
Analysis of short-chain fatty acids and deoxycholic acid
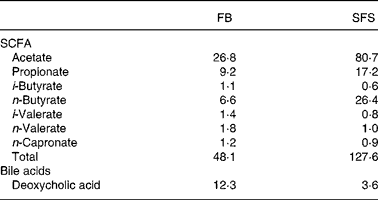
Table 1 shows that fermentation of Synergy 1 increased the yields of total SCFA in the SFS in comparison to the FB. The major products were acetate, propionate and butyrate, which were increased after fermentation of Synergy 1. Noteworthy, the proportion of butyrate increased four times in the SFS compared with the FB. In addition, the SFS contained much lower amounts of the potentially toxic secondary bile acid DCA in comparison with the FB.
Concentration of SCFA (mmol/l) and bile acids (mmol/l) in faecal blank (FB) and Synergy* fermentation supernatant fraction (SFS)
* Synergy 1 (ORAFTI, Tienen, Belgium).
Effect of Synergy fermentation supernatant fraction and faecal blank on cell growth
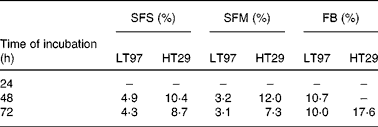
The effects of the SFS and FB on the growth of LT97 and HT29 cells are shown in Figs. 1 and 2. The growth of both cell lines was efficiently reduced in a concentration- and time-dependent manner. Calculated EC50 (inhibitory concentrations leading to 50 % reduction in cell number) after 48 and 72 h of incubation with the SFS were 4·9 and 4·3 % for LT97 and 10·4 and 8·7 % for HT29 cells, respectively (Table 2). EC50 was, however, not detectable after 24 h in both cell lines. In LT97 cells a significant decrease in growth was already observed after 24 h of treatment (Fig. 1), whereas the growth of HT29 cells was only significantly inhibited at ≥ 10 % SFS after 48 h of incubation (Fig. 2). The treatment of cells with the FB also inhibited the growth of both cell lines, but the growth-inhibiting effect was weaker and not comparable with the SFS in the above-mentioned manner (Table 2). However, incubation of HT29 cells with 2·5 % of SFS and FB also resulted in an increase in cell growth (>100 %). Comparison of the EC50 values for both cell lines shown in Table 2 indicates that the anti-proliferative effects of the SFS and SFM are much stronger in LT97 cells than in HT29 cells. The SFM was, however, found to be almost equally effective as the SFS in inhibiting the growth of both cell lines.
Effects of Synergy (Synergy 1; ORAFTI, Tienen, Belgium) fermentation supernatant fraction (a) and faecal blank (b) on the growth of LT97 cells. (–■–), Incubation for 24 h; (–▲–), incubation for 48 h; (–▾–), incubation for 72 h; (…), EC50 (inhibitory concentration leading to 50 % reduction of cell number). Values are means (n 4), with their standard errors represented by vertical bars. Statistical variance was analysed with two-way ANOVA and Bonferroni's post hoc test of each concentration compared with the control medium. Mean value was significantly different from that of the control: *P < 0·05, **P < 0·01, ***P < 0·001.

Effects of Synergy (Synergy 1; ORAFTI, Tienen, Belgium) fermentation supernatant fraction (a) and faecal blank (b) on the growth of HT29 cells. (–■–), Incubation for 24 h; (–▲–), incubation for 48 h; (–▾–), incubation for 72 h; (…), EC50 (inhibitory concentration leading to 50 % reduction of cell number). Values are means (n 4), with their standard errors represented by vertical bars. Statistical variance was analysed with two-way ANOVA and Bonferroni's post hoc test of each concentration compared with the control medium. Mean value was significantly different from that of the control: *P < 0·05, **P < 0·01, ***P < 0·001.

EC50 (inhibitory concentrations leading to 50 % reduction of cell number) after incubation of LT97 and HT29 cells for 24–72 h with Synergy* fermentation supernatant fraction (SFS), synthetic fermentation mixture (SFM) and faecal blank (FB)
* Synergy 1 (ORAFTI, Tienen, Belgium).
Effect of Synergy fermentation supernatant fraction and faecal blank on metabolic activity
Figure 3 compares the effects of the SFS (1·25–20 %) on the metabolic activity of both cell lines incubated for 24–72 h. The results show that the metabolic activity of the remaining cells (HT29 and LT97) was not significantly affected by incubation up to 48 h with the SFS. Only the incubation for 72 h with 15 and 20 % SFS resulted in a significant increase in metabolic activity in LT97 cells, whereas only the highest tested dose of the SFS (20 %) significantly increased the metabolic activity of HT29 cells. In contrast, treatment with the FB (20 %) after 72 h resulted in a minor (3 %) increase in metabolic activity in both cell lines (data not shown). The results underline that the lower concentrations tested (5 %; 10 %) inhibited cell growth, but did not impair the metabolic activity of the remaining viable cells. Therefore, the metabolic status of these remaining cells was not influenced by the concentrations of the SFS used in the further experiments.
Effects of Synergy (Synergy 1; ORAFTI, Tienen, Belgium) fermentation supernatant fraction on metabolic activity of LT97 (a) and HT29 (b) cells. (–■–), Incubation for 24 h; (–▲–), incubation for 48 h; (–▾–), incubation for 72 h. Values are means (n 4), with their standard errors represented by vertical bars. Statistical variance was analysed with one-way ANOVA and Bonferroni's post hoc test of each concentration compared with the control medium. Mean value was significantly different from that of the control: **P < 0·01, ***P < 0·001.

Induction of apoptosis
To analyse effects of the SFS and FB on apoptosis, PARP cleavage(Reference Germain, Affar and D'Amours32) was examined by Western blot. The Western blot analysis revealed specific, time-dependent cleavage of PARP upon incubation of both cell lines with the SFS, demonstrating induction of apoptosis. The results in Fig. 4 show that treatment of LT97 cells for 24 h with the SFS significantly increased cleavage of PARP when compared with the control medium. However, in HT29 cells, 24 h treatment did not lead to an increase of PARP cleavage, indicating that no apoptosis was induced in HT29 cells after 24 h incubation. Additionally, 10 % of FB was also able to induce a significant PARP cleavage in LT97 cells after 24 h of incubation. Further, incubation of LT97 cells for 24 h (Fig. 5) with synthetic SCFA resulted in a significant increase in PARP cleavage. However, the levels of cleaved PARP in the SFM were lower in comparison with the SFS. Effects of the FB, SFM and SFS on apoptosis after 48 h treatment were comparable (data not shown).
Poly(ADP-ribose) polymerase (PARP) cleavage induced by Synergy (Synergy 1; ORAFTI, Tienen, Belgium) fermentation supernatant fraction (SFS) and faecal blank (FB) in LT97 (a) and HT29 (b) cells after 24 h incubation. Values are means (n 3), with standard deviations represented by vertical bars. Statistical variance was analysed by one-way ANOVA and Bonferroni's post hoc comparison test of each concentration compared with the control medium (M) and SFS compared with FB. *Mean value was significantly different from that of the control (P < 0·05). †Mean value was significantly different from that of FB at 5 % (P < 0·05).

Poly(ADP-ribose) polymerase (PARP) cleavage induced by synthetic SCFA mixture, deoxycholic acid (DCA) and synthetic fermentation mixture (SFM) in LT97 (a) and HT29 (b) cells after 24 h. Values are means (n 3), with standard deviations represented by vertical bars. Statistical variance was analysed by one-way ANOVA and Bonferroni's post hoc test of each concentration compared with the control medium (M). Mean value was significantly different from that of the control: *P < 0·05, **P < 0·01.

Discussion
The high incidence of colorectal cancer in Western society has been attributed to a diet low in dietary fibres and high in red meat. This could be because a high intake of dietary fibres results in an increase of production of SCFA whereas a high intake of meat including saturated fat results in an increased production of toxic secondary bile acids in the colon. Among various dietary fibres, inulin and oligofructose have been subjected to extensive research in anti-cancer models(Reference Pool-Zobel, Van Loo and Rowland11). The most commonly employed animal model is to determine preneoplastic lesions called ACF in the colon of rats. Previous studies showed a reduction of crypt numbers and multiplicity, when adding 10 % inulin to the diet of rats(Reference Reddy, Hamid and Rao33, Reference Rowland, Rumney and Coutts34). In addition, the incidence of colonic tumours was reduced after lifelong feeding of 10 % inulin to the rats(Reference Verghese, Rao and Chawan35). Therefore the present study was performed to elucidate in depth which functional consequences can ensue from inulin in human colon tissues on a cellular level. For this, we produced fermentation samples expected to occur in a similar composition in the intestinal lumen, treated human colon tumour cells with these samples and determined effects on cell growth and apoptosis. Inulin enriched with oligofructose (Synergy 1) is a prebiotic dietary fibre which yields high amounts of SCFA due to fermentation by gut bacteria(Reference Sauer, Richter and Pool-Zobel36). In non-transformed cells, the main active SCFA, butyrate, is utilised as an energy source, and in tumour cells, butyrate reduces survival by inducing apoptosis and inhibiting proliferation(Reference Sauer, Richter and Pool-Zobel36). Furthermore, SCFA are able to reduce the conversion of primary to secondary bile acids in the colon(Reference Bingham1). Therefore, knowledge of the mode of action of dietary fibres and particularly their interaction with secondary bile acids will improve understanding of the role of dietary factors in colon carcinogenesis. Another mechanism by which fibres could reduce the risk of cancer may involve the modulation of the microflora in the colon(Reference Wang and Gibson37). The increase in the number of bifidobacteria could lead to reduced amounts of enteropathogens, and thereby to a reduction of bacterial enzymes such as β-glucoronidase which can increase the amounts of toxins(Reference Reddy38).
The present experiments were performed to investigate the possible anti-cancer mechanisms of inulin-type fructans in cultured human cell lines representing two different stages of colon carcinogenesis. The present results indicate a 2·6-fold increase in SCFA and 3·4-fold reduction in the amount of the secondary bile acid DCA in the SFS as compared with the FB after in vitro fermentation of Synergy 1. The total amounts of SCFA observed in vivo in the colon are estimated to range from 70 to 140 mm(Reference Reddy, Hamid and Rao33). Therefore, the amounts of SCFA observed in the present study (SFS: 127·6 mm) correspond to the human situation. Moreover, these results are noteworthy because bile acids have been shown to be positively correlated to colon cancer incidence. Therefore, these results indicate that fermentation products of Synergy 1 may be inversely associated in terms of progression of colon cancer.
Of the SCFA, butyrate has been shown to be a potent inhibitor of cell growth. However, the impact on cell proliferation is additive with other components (for example, propionate) in complex fermentation supernatant fractions. In cultured cancer cell lines, butyrate is a well-recognised anti-proliferative agent, arresting cell growth in G1 and inducing differentiation(Reference Wong, de Souza and Kendall39). The increased level of SCFA produced during fermentation reduces luminal pH and is responsible for a decreased conversion of primary to secondary bile acids(Reference Bingham1). On the basis of the present results, we also found that the fermentation of Synergy 1 resulted in an almost four-fold increase in butyrate which may contribute to significant time- and concentration-dependent growth inhibition in both cell lines. Moreover, the distinct time dependency of inhibition of proliferation with the SFS supports the production of effective metabolites of dietary fibres(Reference Klenow, Glei and Haber29) which in turn could affect intracellular signal cascades. Interestingly, the fermentation sample from Synergy 1 and its corresponding synthetic mixture were of equal potency in mediating growth inhibition, reflecting the potential of SCFA in secondary chemoprevention. Furthermore, our data show that the growth-inhibitory effect of the SFS is stronger in adenoma than in carcinoma cells. This difference in growth inhibition may potentially be explained by differences in the amount of butyrate uptake by both cell lines. Different butyrate uptake may be caused by the availability of monocarboxylate transporter 1 (MCT1) which is necessary for butyrate uptake and is down-regulated from normal cells to malignant cells(Reference Sauer, Richter and Pool-Zobel40). Therefore, adenoma cells which represent an early stage of cancer might have consumed more butyrate and in turn are inhibited more in comparison with carcinoma cells. Altogether, this may have important implications for chemoprevention, as it indicates that fermentation products of Synergy 1 could inhibit the growth of adenoma cells, thus acting at an early stage of carcinogenesis. Additionally, the increase in metabolic activity by the SFS after 72 h indicated that remaining cells were more active after treatment with the SFS. Moreover, the increase in cell growth of HT29 cells after incubation with lower concentrations of the SFS and FB could be due to the presence of secondary bile acids, which in small concentrations have been shown to increase the proliferation of HT29 cells. This increase in cellular proliferation was not visible with higher concentrations of the test substances due to the detoxification of secondary bile acids by SCFA and the acidic pH(Reference Milovic, Teller and Faust41). Furthermore, since incubation of higher concentrations of the FB also reduced cell growth, additional factors seem to be present in the faeces supernatant fraction bearing an effect on cells. Factors such as sulfates, ammonia and products of bacterial metabolism, non-digested food residues and excretable metabolites(Reference Pool-Zobel and Sauer42) could account for these effects.
In addition to cell growth inhibition, induction of apoptosis in cancer cells is another important mechanism by which tumour growth can be prevented. Apoptosis is a physiological process of selected cell deletion and thus important for secondary cancer prevention, if activated in cancer cells. In the present study, we therefore studied the role of the SFS on apoptosis by measuring PARP which is cleaved by caspases in many different cell lines(Reference Germain, Affar and D'Amours32). Inhibition of PARP by cleavage facilitates cellular disassembly and serves as a marker of cells undergoing apoptosis. In general we observed a significant increase in cleaved PARP after incubating the adenoma cells with the SFS. It has been suggested previously that SCFA and especially butyrate have the ability to modulate gene expression and have an impact on key regulators of apoptosis and the cell cycle(Reference Hamer, Jonkers and Venema43). Therefore fermentation products of inulin-type fructans might have increased the transcription activity of pro-apoptotic genes leading to the higher expression of their protein products and elevated levels of apoptosis(Reference Pajak, Orzechowski and Gajkowska44). In addition, we were able to show that SCFA alone also increased apoptosis in both cell lines. However, when the SFM (containing SCFA and DCA) was used, induction of apoptosis was less pronounced. DCA might thus have inhibited the apoptosis-inducing effect of SCFA when present together with SCFA in the SFM, as shown in previous studies(Reference McMillan, Butcher and Wallis24). In vivo, both SCFA and bile acids are present together in the colon, so this apoptosis-inhibiting effect of bile acids could be significant in colonic tissue which turns over very rapidly. Moreover, in comparison with the SFM, the induction of apoptosis by the complex SFS was more pronounced, which is a hint towards some other not yet identified substances. The so-called ‘added value’ of the complete fermentation samples could arise from an increase in antioxidants and anti-mutagenic compounds such as hydroxycinnamic acids which occur in the cell walls of some species of food plants, and may be released after microbial fermentation(Reference Ferguson and Harris45). As a result, such compounds could, at least theoretically, inhibit the development of colon cancer. Since these compounds are present in human faeces, it is possible that they occur in the SFS and could explain the different efficacies of the SFS and SFM, respectively. They may influence the effects on apoptosis directly or synergistic effects of these compounds with SCFA could explain the different effects. Additionally, the increased sensitivity of LT97 cells to be triggered to go into apoptosis may have important implications for possible chemopreventive activities in earlier stages of the cancer process, since it is of high benefit to induce apoptosis in adenoma cells and thereby reduce the formation of more degenerated carcinoma cells. Altogether, the investigation revealed two important mechanisms of secondary chemoprevention by complex fermentation samples, namely impairment of cell growth and induction of apoptosis, indicating that the apoptosis-mediated effects of the SFS might be induced by SCFA and suppressed by DCA.
Conclusion
In conclusion, our data suggest that the beneficial effects of the prebiotic dietary fibre inulin with regard to colon cancer prevention relate to its ability to inhibit growth and induce apoptosis in colon cancer cells. The study provides interesting insights as to how the fermentation products of Synergy 1, mainly SCFA, may favourably support chemoprevention. Further characterisation of responses, validation of additional end points, such as gene expression and enzyme activity, and comparison of the effects in tumour cells with responses in primary human colon cells will yield very useful information on the functional properties of fermentation supernatant fractions.
Acknowledgements
The present study was supported by a grant from Deutscher Akademischer Ausstausch Dienst (DAAD), Triple Plus (BMBF) no. 0313829A, DFG no. 284/8-3. Additionally, we thank Professor G. Jahreis (Department of Nutritional Physiology, Institute for Nutrition, Friedrich-Schiller-University Jena, Germany) for identifying SCFA and bile acids in the fermentation samples.
The authors have no conflicts of interest.



