

How we make meaning of those differences depends, in part, on the meaning that we think ought to be there.
—Douglas B. Bamforth (Reference Bamforth2011, p. 35)1492 is generally taken as the date when Europeans arrived in the Americas, even though Europeans (Norse) had settled in Greenland and parts of the Arctic and subarctic Canada centuries earlier. While that contact faded with the disappearance of those settlements, contact after 1492 fundamentally altered the character and trajectory of Indigenous societies. Yet, economic historians have written little about Indigenous economies in North America prior to the arrival of Europeans and only a little more about their economies in the two to three hundred years post contact (some exceptions are Ray (Reference Ray1974, 1978) and Carlos and Lewis (Reference Carlos and Lewis2010)).Footnote 1 One reason is obvious. Economic historians work primarily with the written record—ledgers, journals, business archives, census records, church records, legal records, and letters—and Indigenous nations north of urban Mexico left no written footprint. A lack of written records does not mean a lack of economic activity, nor should it mean the invisibility of Indigenous nations in North American economic history. Theirs are cultures with deep oral traditions, and our unthinking acceptance of writing as critical has perhaps biased our perception.
The invisibility of Indigenous nations and communities may, however, stem from a more deeply embedded frame. We frequently describe North American Indigenous communities as primitive or mere hunter/gatherer/fisher groups. While not untrue in the sense that Indigenous communities did hunt, fish, and gather, these descriptors reflect a stereotype.Footnote 2 Perhaps embedded in the hunter/gatherer descriptor is a belief on the part of economic historians that Indigenous communities contributed little to the development of European colonies or to the historical processes that are “relevant” to understanding the present, thus making Indigenous societies implicitly, if not explicitly, irrelevant. It is a neat and tidy solution, but one that erases the economic contributions of Indigenous nations, giving primacy to Europeans in North America. It is important to question such a perspective in two ways. First, by asking how socially and economically complex were Indigenous nations in North America prior to 1492. Second, if Indigenous economies were more than mere hunter/gatherers, then we need to ask to what extent Europeans benefited from those assets. What was the extent of capital asset transfers from Indigenous nations to European settlers and colonies?
This paper focuses on the economic history of some of the Indigenous societies that created the America of 1492. When Europeans arrived, the land was neither empty nor pristine. In reality, Indigenous communities had been engaged for centuries in land management and, in large areas of the country, settled agriculture. Indeed, greater recognition needs to be given to the fact that settled agriculture and large towns were the reality in much of the Eastern half of the future United States prior to the arrival of Europeans. This was also a region of independent crop development and diffusion of such plants as squash, sunflower, marsh elder, and others now lost, as well as production of crops such as maize from South America (Laskow Reference Laskow2022; Smith Reference Smith2006; Watson Reference Watson, White and Denham2007). That Indigenous nations cultivated and settled land (Doolittle Reference Doolittle2004; Scarry and Scarry Reference Scarry and Scarry2005) was not lost on colonial migrants. Coughlan and Nelson (Reference Coughlan and Nelson2018) convincingly show that colonists in the South Carolina Piedmont chose to settle any land that had previously been cultivated by Indigenous communities, regardless of how far in the past, over land that had never been cultivated. As another example, we can think about tobacco. Tobacco was not a crop imported from Europe. Indigenous communities grew tobacco in what became Virginia, and Virginia’s colonial wealth came from tobacco.Footnote 3 European migrants were not starting from nothing. Indeed, Bacon’s Rebellion (1676–1677) was about access to Indigenous land, and even if Bacon failed, eventually, as Carlos, Feir, and Redish (Reference Carlos, Feir and Redish2022) argue, American institutions were crafted to advantage Europeans and White Americans over the rights and land of Indigenous communities. Ignoring this reality ignores an important legacy of Indigenous nations.
No single paper can elaborate on everything in Indigenous history. The issue of asset transfers and the impact of Indigenous societies on the development of colonial and revolutionary America into the present remain open questions. Here, I focus on Indigenous communities prior to the arrival of Europeans and on those nations/communities not engaged in settled agriculture. As I argue through a series of case studies, these Indigenous nations, nominally hunter/gatherer, had developed socially, politically, and economically complex organizations and institutions to take advantage of the gains from specialization and trade and minimize such problems as inequality. In particular, I document the economic and social complexity of trade for three nations or communities: the Chumash of California, the Blackfoot of the northern Great Plains, and coastal Alaskan communities. Although the nature of the archaeological evidence makes dating to a precise year difficult, the case studies focus on the roughly five hundred years prior to contact (1000–1500 CE), contemporaneous with late medieval and early modern Europe.Footnote 4 This paper adds to the small literature on the pre-contact economic history of Indigenous societies as exemplified by the work of Butlin (Reference Butlin1993) on the Aboriginal economy in Australia and by that of La Croix (Reference Croix2019) for Hawaii.
Knowledge of these and other Indigenous nations is a product of many decades of archaeological research and, importantly, a result of technologies such as 14C dating techniques, x-ray fluorescence, liDAR, and the work of paleobotanists and palynologists, all of which have expanded knowledge beyond what was possible even 50 years ago. The result is a richer and more fine-grained analysis of the lives, societies, and economies of Indigenous communities. In terms of structure, I begin with a discussion of the context of the paper and the case studies. This is followed by three sections, each focusing on a particular nation or community. Section six then summarizes and concludes with some possible avenues for future research.
CONTEXT
Economic History Literature—Erasure of Indigenous America Pre-Contact
Despite a rich historiography in the history and ethno-history literatures, standard North American economic history textbooks or histories of American capitalism take as a starting point the founding of European colonies: Spanish, French, English, and Dutch. While there might be some mention of Indigenous nations, the focus is on the growth and development of the future United States or Canada as an interplay between a land made fruitful by migrant settlers, combined with strong common law property rights to protect individual investment in land and resources, in infrastructure, and, in some regions, enslaved peoples. Yet the land was neither empty nor, in many regions, undeveloped; rather, there was a transfer, voluntary or forced, of land, capital assets, and knowledge from Indigenous ownership to non-Indigenous ownership (Carlos, Feir, and Redish Reference Carlos, Feir and Redish2022). In essence, our textbooks document the economic history of Europeans and their institutions in North America.
A perception of hunter/gatherer/fisher communities as less “developed” is commonplace. In a recent working paper, Franck, Galor, Moav, and Özak (Reference Franck, Galor, Moav and Özak2022, p. 1) outline the standard definition of the Neolithic Revolution—the transition from hunter/gatherers to agriculturalists—as transformative because it fostered social stratification, the emergence of non-food producers dedicated to arts, science, and technology, and ultimately to civilization. By implication, hunter/gatherer societies have no social stratification, arts, science, technology, or civilization.Footnote 5 A contrasting argument is made by Graeber and Wengrow (Reference Graeber and Wengrow2021) when they ask what we discern if we do not constrain ourselves to see people along a preset trajectory from hunter/gatherer/fisher to agriculturalist to arts and technology?Footnote 6 As already noted, settled agriculture described economic activity for many communities (Doolittle Reference Doolittle2004; Scarry and Scarry Reference Scarry and Scarry2005). On the west coast, Indigenous communities managed pelagic and on-shore fisheries, with some engaging in active mari-culture (Lepofsky et al. 2021). But as I argue, the hunter/gather label conceals often complex social and/or economic organizations: some socially stratified with elites and priestly castes and some not, but many deliberately producing large surpluses from specialization for trade (Bamforth 2022; Brink Reference Brink2008).
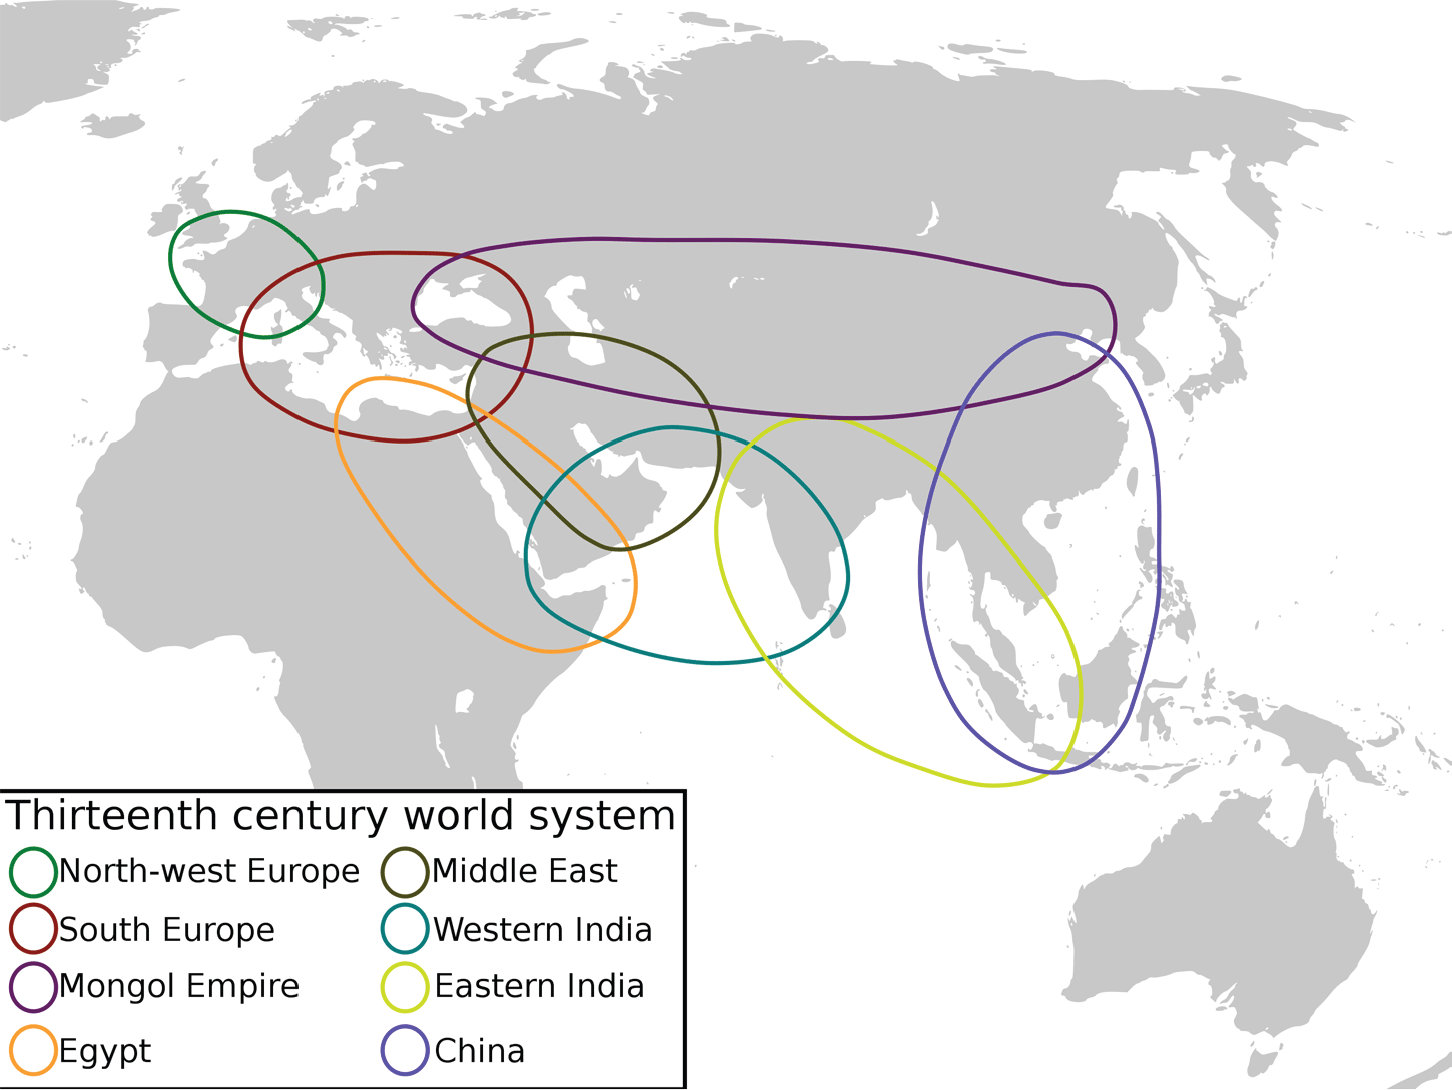
Along with stages of growth formulations or narratives, world systems theory, with its division of global economies into center and periphery—with regions beyond the periphery completely ignored—also distorts how we view societies (Janz and Conolly Reference Janz and Conolly2019).Footnote 7 In this view, Europe is generally the core, with trade routes of various kinds emanating outward to the periphery. By way of example, Figure 1 depicts a standard thirteenth-century world system as found on Google or Wikipedia. To state the obvious, this map does not include the Americas because the Americas had not yet been “discovered.” The Americas, however, did exist. While Africa and Australia are shown, they lie outside the world system, even though we know there were great empires in Africa and the Americas at this time. Such framing obscures peoples, economies, technologies, and accomplishments that lie outside of Europe or Eurasia.
THIRTEENTH CENTURY WORLD-SYSTEM ILLUSTRATION
Source: Based on the Janet Abu-Lughod, Before European Hegemony: The World System A.D. 1250–1350 and the File:WorldMap.svg.
To make the same point in a different context, consider what I am calling the globalization literature with its focus on the expansion of European trade across the Mediterranean and along the Silk Road to China, and, in the aftermath of the great voyages of discovery, on sea routes to India, Asia, and the Americas. The globalization literature is problematic not because it ignores the Americas prior to 1492 but because its Eurocentric focus creates a distorted view of the Americas before and after 1492. This is a very broad statement, but the argument can be seen in a few examples. In The European Miracle, Jones (Reference Jones2003) examines the interplay between environments, economics, and geopolitics in the history of Europe and Asia. Here, the “discovery” of North America is described in terms of the acquisition of “ghost acreage,” such that “the average area of land available per capita in western Europe in 1500 had been 24 acres, and the Discoveries raised this to 148 per capita, a six-fold gain” (p. 82). Essentially, he is saying that North America is essentially an empty land waiting to be developed by European migrants.
In Power and Plenty (2007), Findlay and O’Rourke examine the pattern and structure of world trade in the second millennium, delineating seven world regions by historical and cultural bonds: Western Europe, Eastern Europe, North Africa, South West Asia, Central or Inner Asia, Southeast Asia, and East Asia—a world not very different from the thirteenth-century world systems map delineated in Figure 1. Despite dividing Eurasia into seven regions, Findlay and O’Rourke exclude the Americas and Australia (while generally ignoring sub-Saharan Africa), arguing that the Americas and Australia did not engage in trade with other regions and thus had no external trade until Europeans arrived.Footnote 8 I am not arguing that Findlay and O’Rourke should have written a different book, but rather want to note that they are writing in a particular tradition.
To take one final example, de Zwart and van Zanden (2018), in their monograph on the making of the global economy, 1500 to 1800, acknowledge not only the existence of the Americas but document their vitality, specialization, and urbanization prior to 1500. Faced, however, with incorporating these economies into the post-contact world, they argue for the Caribbean, and by inference for the whole region, that “native Americas (sic) succumb[ed] en masse to European violence and diseases” and the area “repopulated by Europeans, Africans and later Asians” (p. 90). At odds, also, with their descriptions of specialization and urbanization in the Americas, the authors write that these societies, “which had known (almost) no money or market exchanges previously” (p. 90), would come to be transformed into capitalist market economies. They, thus, reaffirm a traditional narrative regarding the primitive nature of Indigenous societies.
Seeing Indigenous economies as non-market has a long tradition. Gift giving and reciprocity are portrayed as aspects of Indigenous exchange used to support non-market relations (Mauss Reference Mauss1925; Sanchez 2017). Yet, as Carlos and Lewis (2014) argue, these institutions can be viewed as capital markets in that such activities allowed for borrowing in period one (receiving a gift) and lending in period two (giving a gift), thus providing an insurance market for those whose food supply was variable. Johnsen (Reference Johnsen1986) argued that ceremonies, such as potlatches or the ceremonial distribution of gifts, were a means of reducing conflict and preserving resources or resource sites. Gift giving, reciprocity, and redistribution within related communities, socially or geographically, reduce the threat of starvation in the event of a poor hunting or harvest season or smooth distribution in the face of uneven hunting/fishing locations. Undoubtedly, an ethic of generosity, reciprocity, and redistribution played a larger role than in western societies, nonetheless, the mutual obligations incurred created an insurance policy across time and space and may have provided greater protection to needy families than afforded many European households.
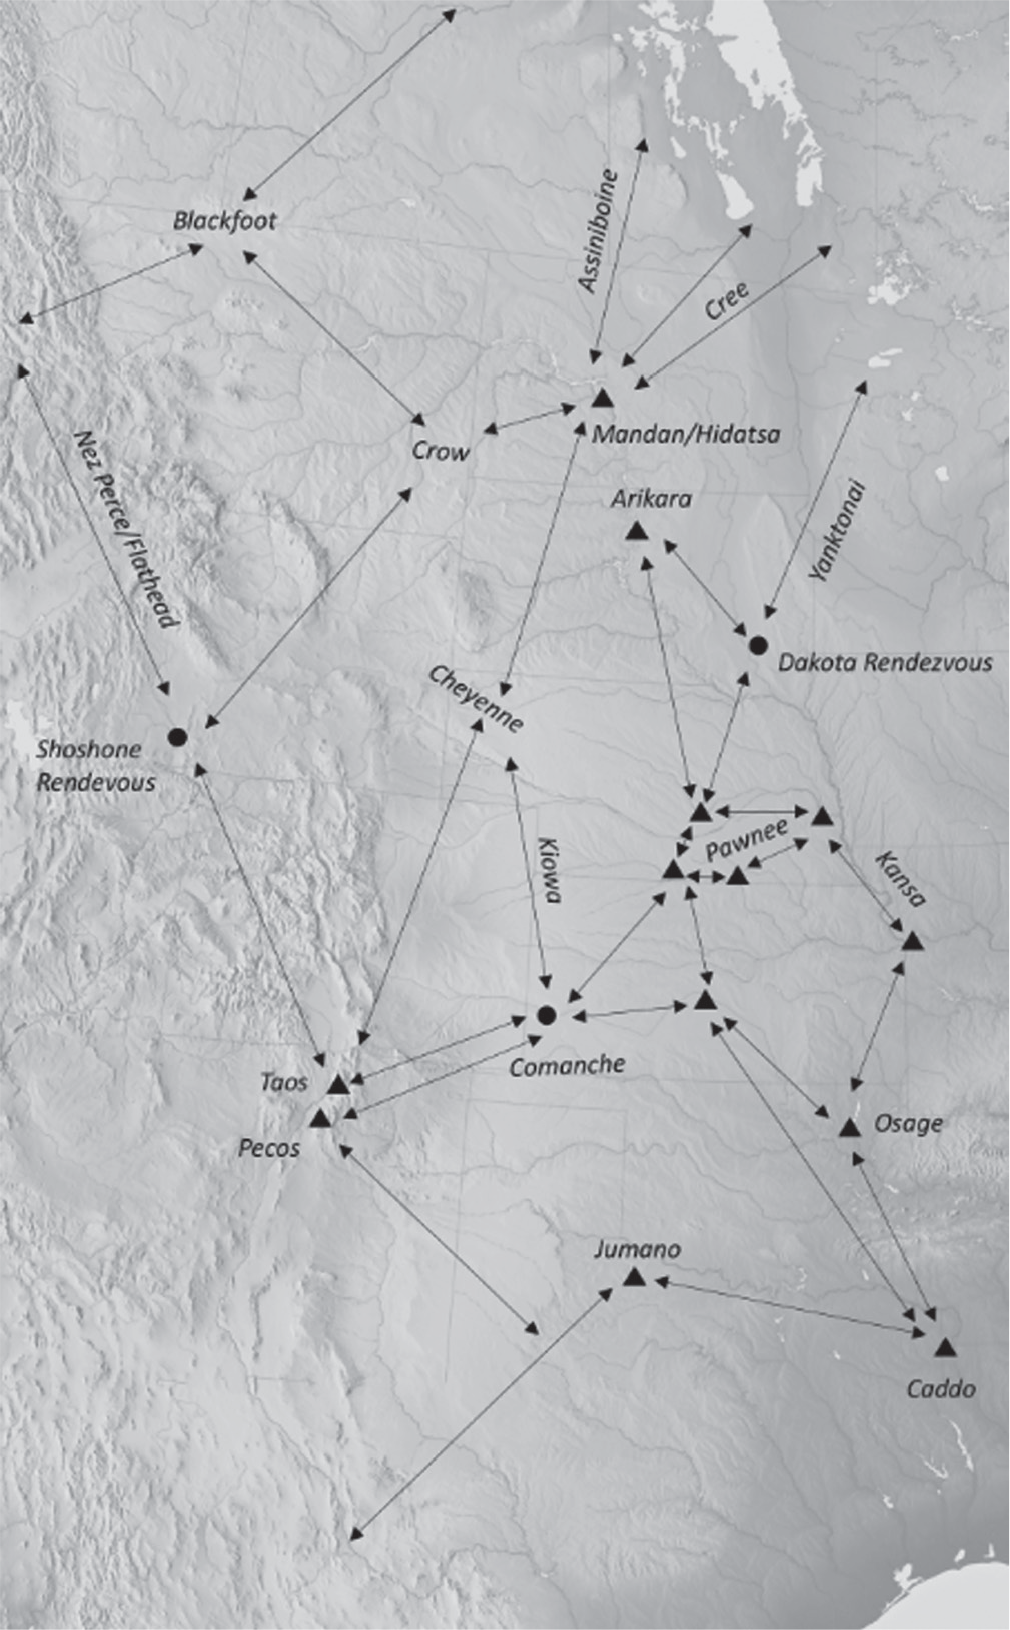
Trade and markets, which will be discussed in detail in the three case studies, were not something introduced to the Americas by Europeans. Figure 2 describes known Indigenous trade routes across the Great Plains, with people and goods moving from home regions to major market fairs or rendezvous.Footnote 9 The fact that these trade connections predate the arrival of Europeans is documented by the movement of artifacts and trade goods. Of course, rendezvous were not only trade centers but also locations of political, social, community, and cross-community gatherings to build or maintain trust and marriage alliances between groups. The point is that trade and markets existed well before the advent of Europeans in North America, and, as I discuss in the context of the Chumash and the Blackfoot, trade was not merely the passing of an item along a chain of people but also the result of specialization in production for intraregional and interregional trade. Some, as did the Chumash, even used money to facilitate trade.
INDIGENOUS TRADE NETWORKS ACROSS THE GREAT PLAINS IN THE COLONIAL ERA
Source: Bamforth (2021, figure 11.6). Used with author’s permission.
Archaeological Data—Indigenous Presence
People migrated out of Beringia 25,000 years ago and moved slowly down the American continent, either walking along ice-free routes or sailing along the coast, reaching southern Chile and sites in North America around 14,700 BCE and the Great Plains of North America around 13,500 BCE (Bamforth 2021).Footnote 10 There is, therefore, a long history of people, families, and communities living across the Americas with their associated economies, experiencing times of abundance and times of droughts, floods, war, and famines. America was also a continent with civilizations: Olmec (1400–400 BCE), Maya (150–900 CE), Inca (1438–1533 CE), and Aztec (1300–1521 CE) are the best known, ranking alongside those in Egypt, Mesopotamia, and China, with great monuments, large cities, art, domesticated plants (corn, beans, squash, cotton), hieroglyphic writing, calendar making, and social stratification and hierarchy. In North America, at its apex in the twelfth century, at least 20,000 people lived in the mound city/state of Cahokia along the Mississippi.Footnote 11 Large cities with complex hierarchies, social stratification, and monuments are very visible manifestations of these societies. Yet, the majority of people in the Americas (as in Europe, Africa, and Asia) before 1500, lived in smaller communities, some settled and some mobile.
Knowledge about Indigenous communities, societies, and polities comes from a number of sources: Indigenous communities’ oral histories, traditions, folklore, colonial records, and archaeological data. Each source describes differing aspects of the Indigenous past. Although I focus here on archaeological data, it is important to recognize that all sources should be contextualized within a nation’s own oral history, traditions, folklore, and language (Michalopoulos and Xue 2021).
Archaeology is the study of human history through its material remains: buildings, lithic and bone tools, pottery, archaeo-faunal remains, middens, industrial debris, and sometimes wood, seeds, or compostable remains.Footnote 12 The archaeological record, as with all records, is comprised of what remains to us today. Over the past five hundred years, European/American villages, towns, cities, roads, canals, dams, highways, airports, harbors, golf courses, and farms have obliterated Indigenous sites.Footnote 13 Weather patterns, droughts, floods, and sea level changes can also erase a community’s imprint and bury or submerge a site, while artifact hunters impinge on the integrity of a site. There is, therefore, a sample selection bias in terms of what is preserved and what is lost. For instance, we know that more densely populated areas today were more densely populated prior to European arrival (Carlos, Feir, and Redish Reference Carlos, Feir and Redish2022), but these are also regions where archaeological remains have likely been lost.Footnote 14
As with other fields, archaeology has expanded and refined its data collection expectations: excavations are to be meticulously laid out and various levels/strata carefully documented and photographed; larger artifacts are to be removed and the soil sifted for smaller pieces of broken pottery, flakes, bones, etc. Assiduous documentation is necessary because once a site has been excavated, it cannot be put back into its original state. While, archaeological data/artifacts show changes over time in a particular location, with different strata providing evidence of older and younger sites, this does not necessarily tell how old the sites are. At the same time, an artifact, or its shape and design, can suggest or confirm connections with other regions, either through the movement of goods, people, or ideas. Yet, the very nature of the discipline with a focus on what is visible raises an issue termed the tyranny of architecture (Ben-Yosef Reference Ben-Yosef2019). If the footprint defines the size of the settlement and its potential complexity, then, often by inference, societies without fixed dwellings were not complex.
Over the past few decades, new technologies, statistical tools, and interdisciplinary work have expanded our understanding of the past. Of particular importance was the emergence of 14C dating in the mid-twentieth century. 14C is created in the upper atmosphere when cosmic rays hit 12C. However, 14C is unstable, and over time it sheds its extra neutrons to return to stable 12C. All living things take on carbon from the atmosphere, some as stable 12C and some as unstable 14C. At death, the levels of 12C are set, but 14C continues to decay. In the mid-twentieth century, Willard Libby determined that the decay function was stable—with a half-life of 5,730 years—thus providing an approximate age for faunal remains such as bone, wood, and plant fibers (Kirch Reference Kirch2012, p. 106). Continued work has refined the tool.Footnote 15 X-ray fluorescence can determine the origin site for lithic remains such as obsidian, copper, meteoric iron, amber, or marine shells, thus tracing the extent of their movement or trade from the source site to where they were found.Footnote 16 LiDAR, or ground penetrating radar, allows for the discovery of sites without visible remains, or can illuminate the extent of settlement without excavation, while paleobotanists working with pollens, seeds, and grains in lake sediments document climate changes both locally and more globally.Footnote 17 Even as archaeologists debate aspects of their field, the amazing fieldwork and analysis of the last 50 years, in particular, have deepened our understanding of the history of Indigenous nations.
The case studies discussed in the next three sections are based on archaeological evidence published over the last 40 years. My focus is on the role of specialization and trade, and the diversity of social and political organizations. Although the production of trade items might require complex social organization, this did not always result in social stratification. These case studies document the vibrancy, complexity, and dynamism of communities in pre-contact North America from roughly 1000–1500 CE.
THE CHUMASH OF SOUTHERN CALIFORNIA
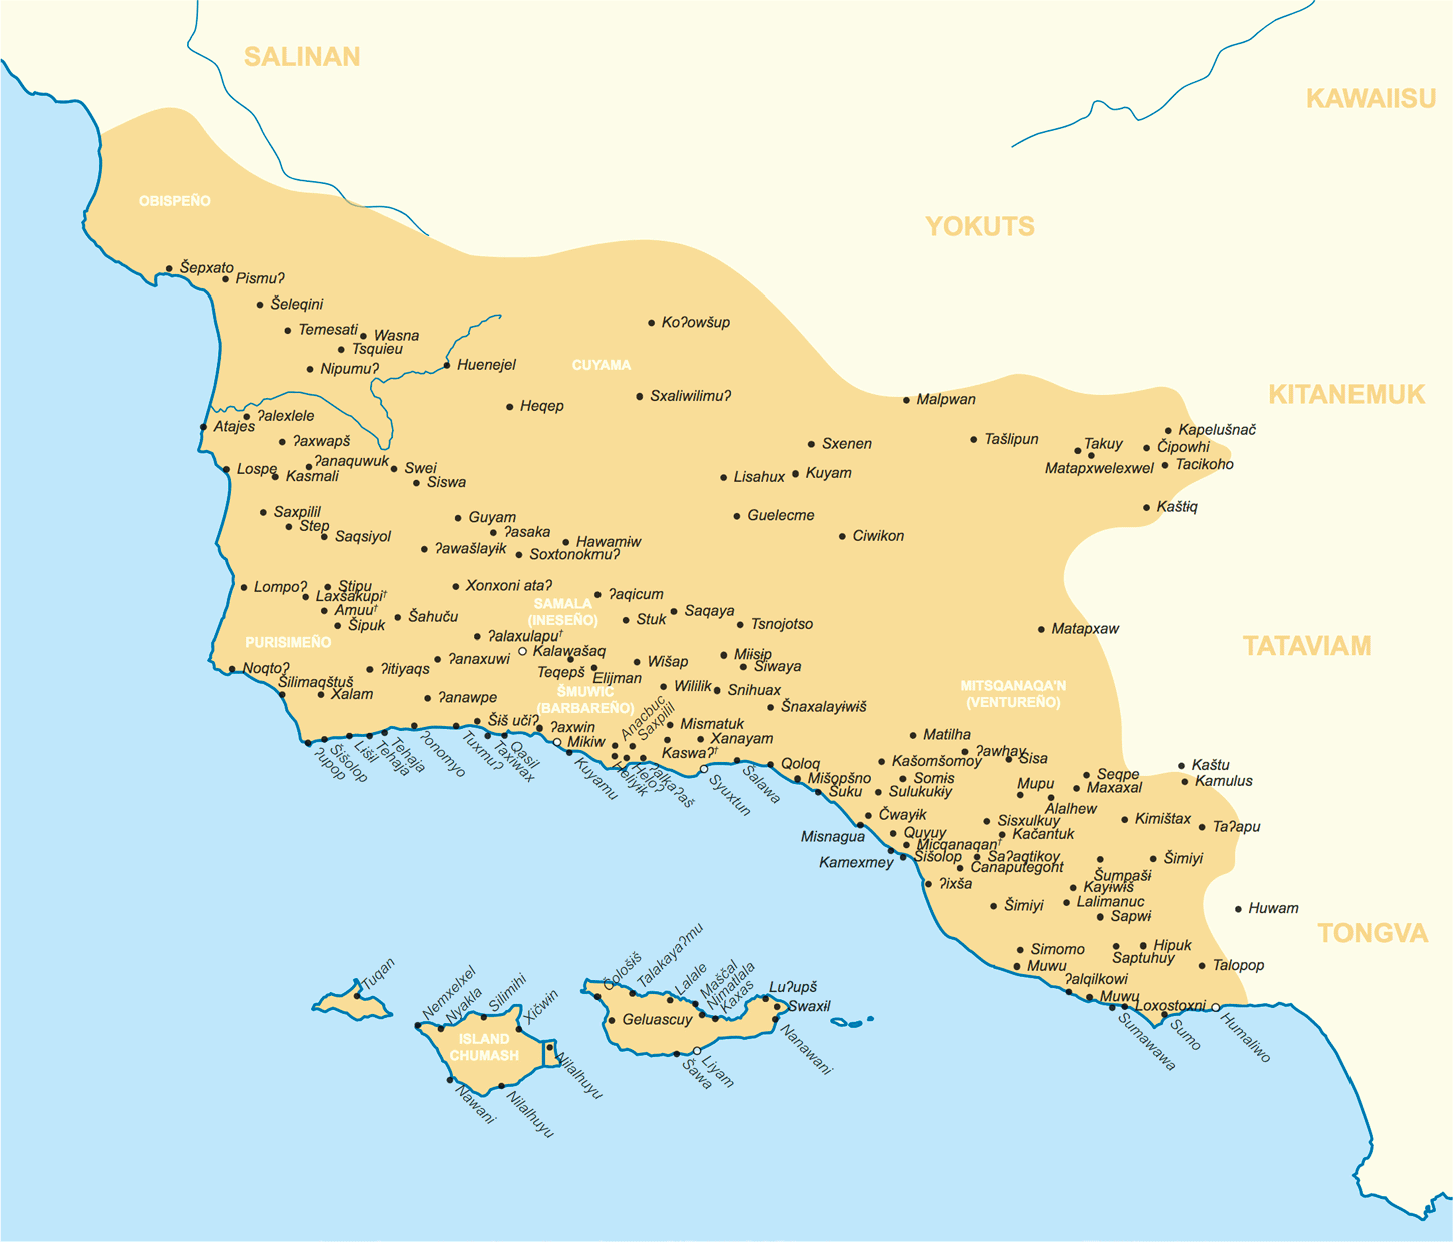
The Chumash of southern California are recognized as an economically and socially complex society with a 10,000-year history in the region.Footnote 18 The many groups comprising the Chumash occupied three main regions: the northern Channel Islands of San Miguel, Santa Rosa, Santa Cruz, and Anacapa (only one square mile); the coastal region; and the interior; occupying portions of what are now San Luis Obispo, Santa Barbara, Ventura, and Los Angeles counties, extending from Morro Bay in the north to Malibu in the south as shown in Figure 3.Footnote 19 The Chumash are well documented, firstly, because of early written descriptions, in particular, the Spanish expedition of Juan Rodriguez Cabrillo in 1542, and, secondly, due to the protection of Chumash sites on the Channel Islands that now form the Channel Islands National Park.
CHUMASH VILLAGES: COAST AND CHANNEL ISLANDS
Notes: Circles filled in white signify regional “capitals.” Superscript crosses indicate mission villages. Adapted from map compiled by Chester King (1975) from the notes of John P Harrington. https://escholarship.org/content/qt8833s5k5/qt8833s5k5.pdf. This file was derived from: USA California location map.svg. No changes were made to this image.
Source: Image is available at https://upload.wikimedia.org/wikipedia/commons/8/8b/Chumash_villages.svg. Used with permission by creative commons at https://creativecommons.org/licenses/by-sa/4.0/deed.en.
Socially and politically, the Chumash appear to comprise a hierarchy of loosely integrated groups, each with its own chief and defined geographical area but with strong social and economic ties throughout the territory (Arnold Reference Arnold1992, p. 66). Indeed, the density of villages and population attests to access to resources. By the time of the first Spanish settlement, the Chumash population was estimated to be between 15,000 to 25,000 people in an area of about 20,000 km2. They, along with some Pacific Northwest coastal groups, had the highest population density north of Central America, perhaps as high as four to nine people per km2.Footnote 20
Described as hunter/fisher/foragers, such a loose descriptor does not capture the complexity of economic activity in the five hundred years before the arrival of the Spanish. This was a region with a rich resource base but with differential access to resources across communities. Those residing along the mainland coast had the greatest access: meat from large terrestrial mammals—deer, elk, and bear—an extensive and plentiful array of fish and shellfish, and seeds, nuts, grains, and reeds.Footnote 21 Inland areas had perhaps greater access to deer and other land mammals, freshwater fish, and shellfish, but no marine products. The Channel Islands were the least endowed. As islands, these communities had access to marine mammals, otters, fish, and shellfish, but no large terrestrial mammals, and a less rich plant life. While the focus is often on game and fish, nuts, such as acorns, grasses, and seeds, as well as various bulbs and plants, were important components of the diet. Acorns, in particular, were a highly nutritious staple food and, once the toxins were leached out, could be ground into flour. Indeed, as paste, acorns could be stored for years. These Chumash communities did not, however, merely live off the land; they managed their resources, using fire, for example, to create larger grassy areas for deer and to promote the growth of seeds and nut-bearing trees.Footnote 22
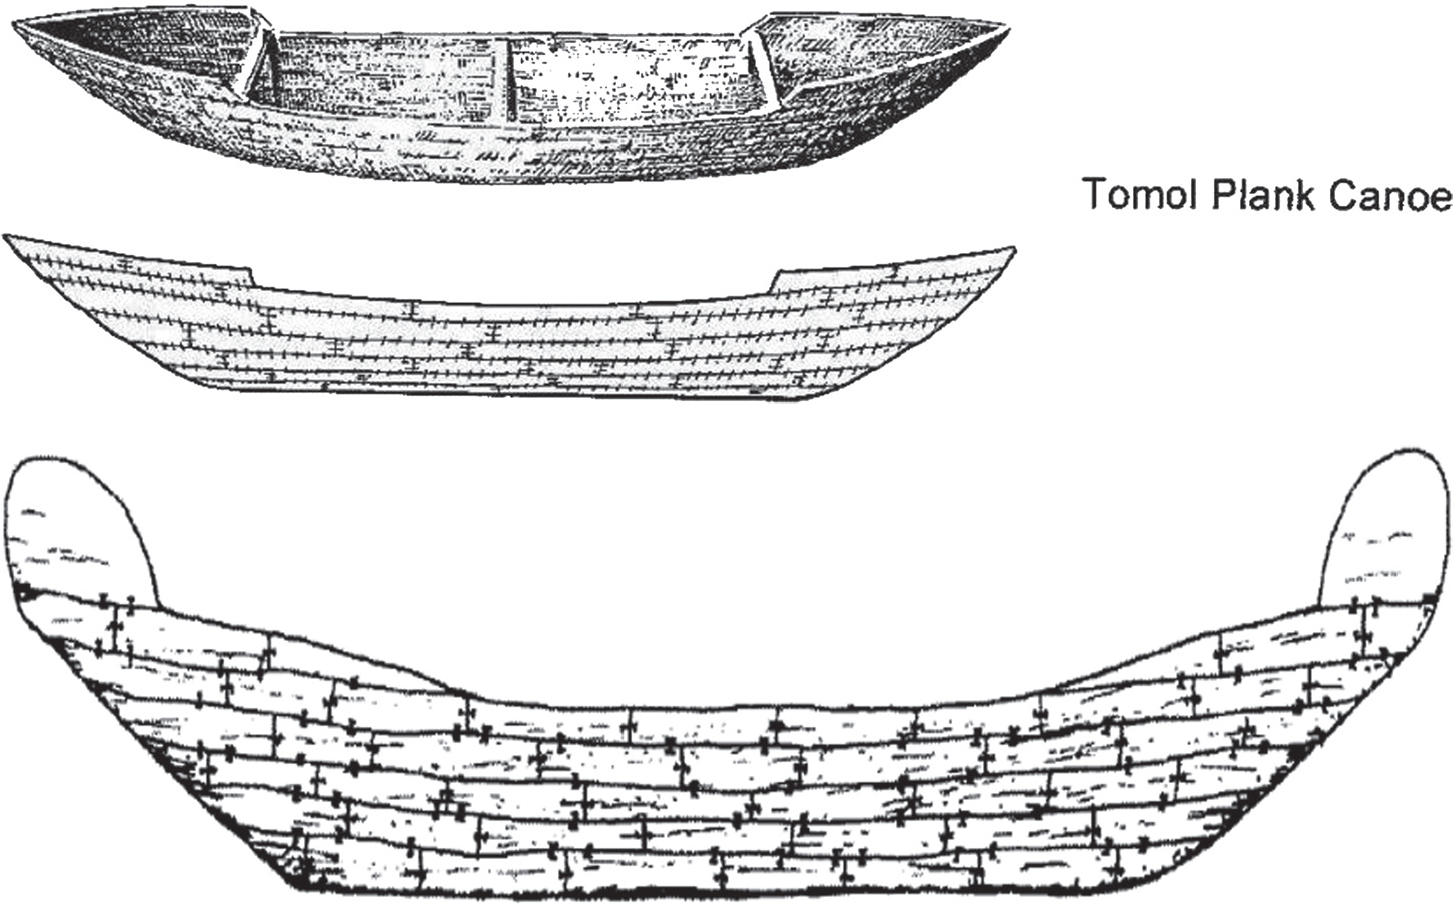
Such differences in resources between communities could have led (and perhaps at certain points did lead) to conflict, but by 1500, the archaeological record, as discussed later, and early Spanish records documented not conflict but specialization and trade across the communities. Specialization was perhaps greatest on the Channel Islands. The islands are, at their closest point, 38 miles from the mainland. Until the middle of the first millennium, the extant boat technology used reeds to make small coastal vessels, making connections between the islands and mainland difficult.Footnote 23 Then the archaeological record shows the emergence of a new technology, the tomol, or plank canoe, measuring six to seven meters in length. This was a sophisticated ocean-going vessel with a carrying capacity of 2 tons of cargo or 12 passengers. The tomal improved coastal and island trade and pelagic fishing.
By the beginning of the second millennium CE, these vessels were made along the coast and in specialized workshops on the islands.Footnote 24 A tomol was constructed from planks of planed redwood, as illustrated in Figure 4. A plank canoe may not, on the surface, appear to be a very sophisticated product. Redwoods, however, do not grow on the Chanel Islands. These canoes were crafted from tree trunks and large branches carried down the coast from northern California. If the islands had no redwood, they had major outcroppings of higher-quality chert (stone for tools) than found on the mainland. The redwoods were cut and planed into planks with lithic tools, stone or clamshell adzes, holes drilled, and planks tied together with the fibers of red milkweed. Finally, the boat was caulked with heated asphaltum blended with pine pitch; asphaltum was mined from solidified coastal bluffs within the Barbareño Chumash territory on the mainland. It is estimated that a tomol required 500 person-days of skilled labor to construct. The archaeological record shows not just the construction of an occasional tomol, but, by the eleventh century, sites on Santa Cruz Island were the location of specialized production workshops with teams of workers. The production of tomal appears to have been supported by wealthy families or groups on the mainland who purchased these canoes—ownership being a sign of wealth.
CHUMASH TOMOL OR PLANK CANOE
Notes: Canoes had an average length of 20–23 feet or 6–7 meters. There is some speculation in the literature that they were the result of journeys by Polynesians to the west Coast of America. Tomol are an independent invention. Hawaii was settled after the introduction of the tomol by the Chumash. See La Croix (Reference Croix2019) for timing of settlement in Hawaii.
Sources: Arnold (2007). Illustration by Rusty van Rossmann. Posted on California Department of Parks and Recreation at https://www.parks.ca.gov/?page_id=24433.
The islands also had abundant Olivella, abalone, and mussels. Olivella biplicata is a small predatory sea snail whose shell is comprised of very hard enamel. Along with the tomol, islanders specialized in the production of two other non-consumption commodities: micro-drills crafted from high-quality cherts and Olivella shell beads.Footnote 25 Indeed, based on the quantity of remains at sites, the evidence points to specialized micro-drill production sites with teams of workers (Arnold Reference Arnold1992, p. 66). The shells were first ground, shaved, and polished into beads of specific sizes, and then holes drilled to create strings of beads of similar size and quality, a time- and labor-intensive activity with various types of beads created. Barbier (Reference Barbier2019) found that making 100 Saucer beads took 24.4 hours compared to 39.3 cupped beads. The cupped beads were used as money.Footnote 26
Shell bead money has a long history among the Chumash. Gamble (2020) argues that shell bead money may have been in circulation as long as 2,000 years ago, but dates the cupped shell beads to about the mid-twelfth century. The value of a bead string was determined by its length and degree of fineness. Because cupped beads were a standardized and not easily counterfeited commodity, they were used as a local currency for transactions among different Chumash groups and perhaps for some exchanges with outside regions.Footnote 27 Cupped beads were a medium of exchange and a store of value, and provided evidence of status when worn as jewelry. Mortuary rituals took money out of circulation as strings of beads were often interred with the owner, helping to maintain price stability, as did beads traded out of the Chumash area. They having been found not only up the California coast but also in Oregon and western Nevada.Footnote 28
Team production and specialization on the Channel Islands were mirrored by changes in coastal and inland groups. Inland Chumash communities became more specialized in the production of seeds, acorns, and greens, expanding their production areas for exchange with coastal communities. Among coastal communities, one sees greater social stratification, with wealthy elites and a priestly caste. The archaeological evidence says that these changes were entrenched by the mid-twelfth century.
Arnold (Reference Arnold1992) argues that a climate event that changed the temperature of the surface waters of the Pacific Ocean over decades required community-wide adjustments. Resource pressure could have led to conflict and out migration from the Chanel Islands, but Arnold posits instead that the climate change allowed for the emergence of elites in the more densely populated coastal regions who used their resources to organize and then purchase expensive plank canoes from the Islands, which became, in turn, a status symbol of the wealth of the elites. Tensions that could have been created by the resulting income inequality were alleviated by an organized schedule of feasting. These feasts brought communities together, maintained social contact across groups, and redistributed resources across the regions (Gamble 2008).Footnote 29
In summary, specialization and intra-regional trade, no doubt with some trade outside the region, resulted in higher standards of living for all three regions (Carlos and Lewis 2014). The archaeological and colonial records indicate specialization and highly organized intensification of production with dedicated workshops where non-food commodities were traded for food and other items. Even though it was ostensibly a hunter/gatherer/fisher culture, the Chumash created a currency to allow for greater ease of complex exchange across the various regions of the Chumash region. Society was politically and socially stratified, with the wealthier coastal elites and a priestly caste organizing a calendar of feasts to redistribute wealth and maintain social order.Footnote 30 These social and economic structures were in place five hundred years before the first Spanish settlers arrived on the coast of California.
BLACKFOOT, BISON, AND INDUSTRIAL PRODUCTION OF PEMMICAN: SWIFT MEATPACKERS OF THE GREAT PLAINS
The Great Plains of North America stretch east from the Rocky Mountains across Alberta, Saskatchewan, Montana, North and South Dakota, Wyoming, Nebraska, Colorado, Kansas, New Mexico, Oklahoma, and northern Texas - an area of over half a million square miles.Footnote 31 Given the size and scale of the Great Plains, it is not surprising that climate varies from west to east and south to north. For the northern half, the prevailing winds come across the Rocky Mountains from the Pacific, dropping precipitation, generally as snow, in the mountains. Regions on the leeward side of mountains lie in a rain shadow, with precipitation of only 12–19 inches annually.Footnote 32 In the southeast, prevailing winds come from the Gulf of Mexico; in the southwest, from northern Mexico and the American Southwest. Temperature also varies dramatically from south to north; particular combinations of temperature, winds, and moisture generate tornadoes, wind and dust storms, or golf-ball-size hail storms, depending on the region. Areas of low precipitation and high winds can quickly turn small lightning fires into infernos.
The Great Plains are, and certainly were, one of the world’s great grasslands, with different grasses (tall, short, mixed) dominating in different climatic zones. These grasses provide forage for a range of large animal species: deer, antelope, elk, moose, and bison. Following the herbivores, predators abound: cats, wolves, foxes, coyotes, raccoons, badgers, skunks, plains grizzly bears, and humans. There is also a wide range of smaller mammals—rabbits, squirrels, picas, prairie dogs, chipmunks, mice, and beaver—and reptiles. Drainage systems are home to a variety of fish and freshwater shellfish, migratory and resident birds, and raptors. The grasslands are also home to a range of plant life that is available for foraging and gathering. Roots, reeds, leaves, stems, and flowers, such as dandelions, wild onions, bergamot, cattails, prickly pears, wild strawberries, and wild asparagus, are/were used for food, medicine, and clothing. In sum, the Great Plains provide an abundance of resources (Bamforth 2021).
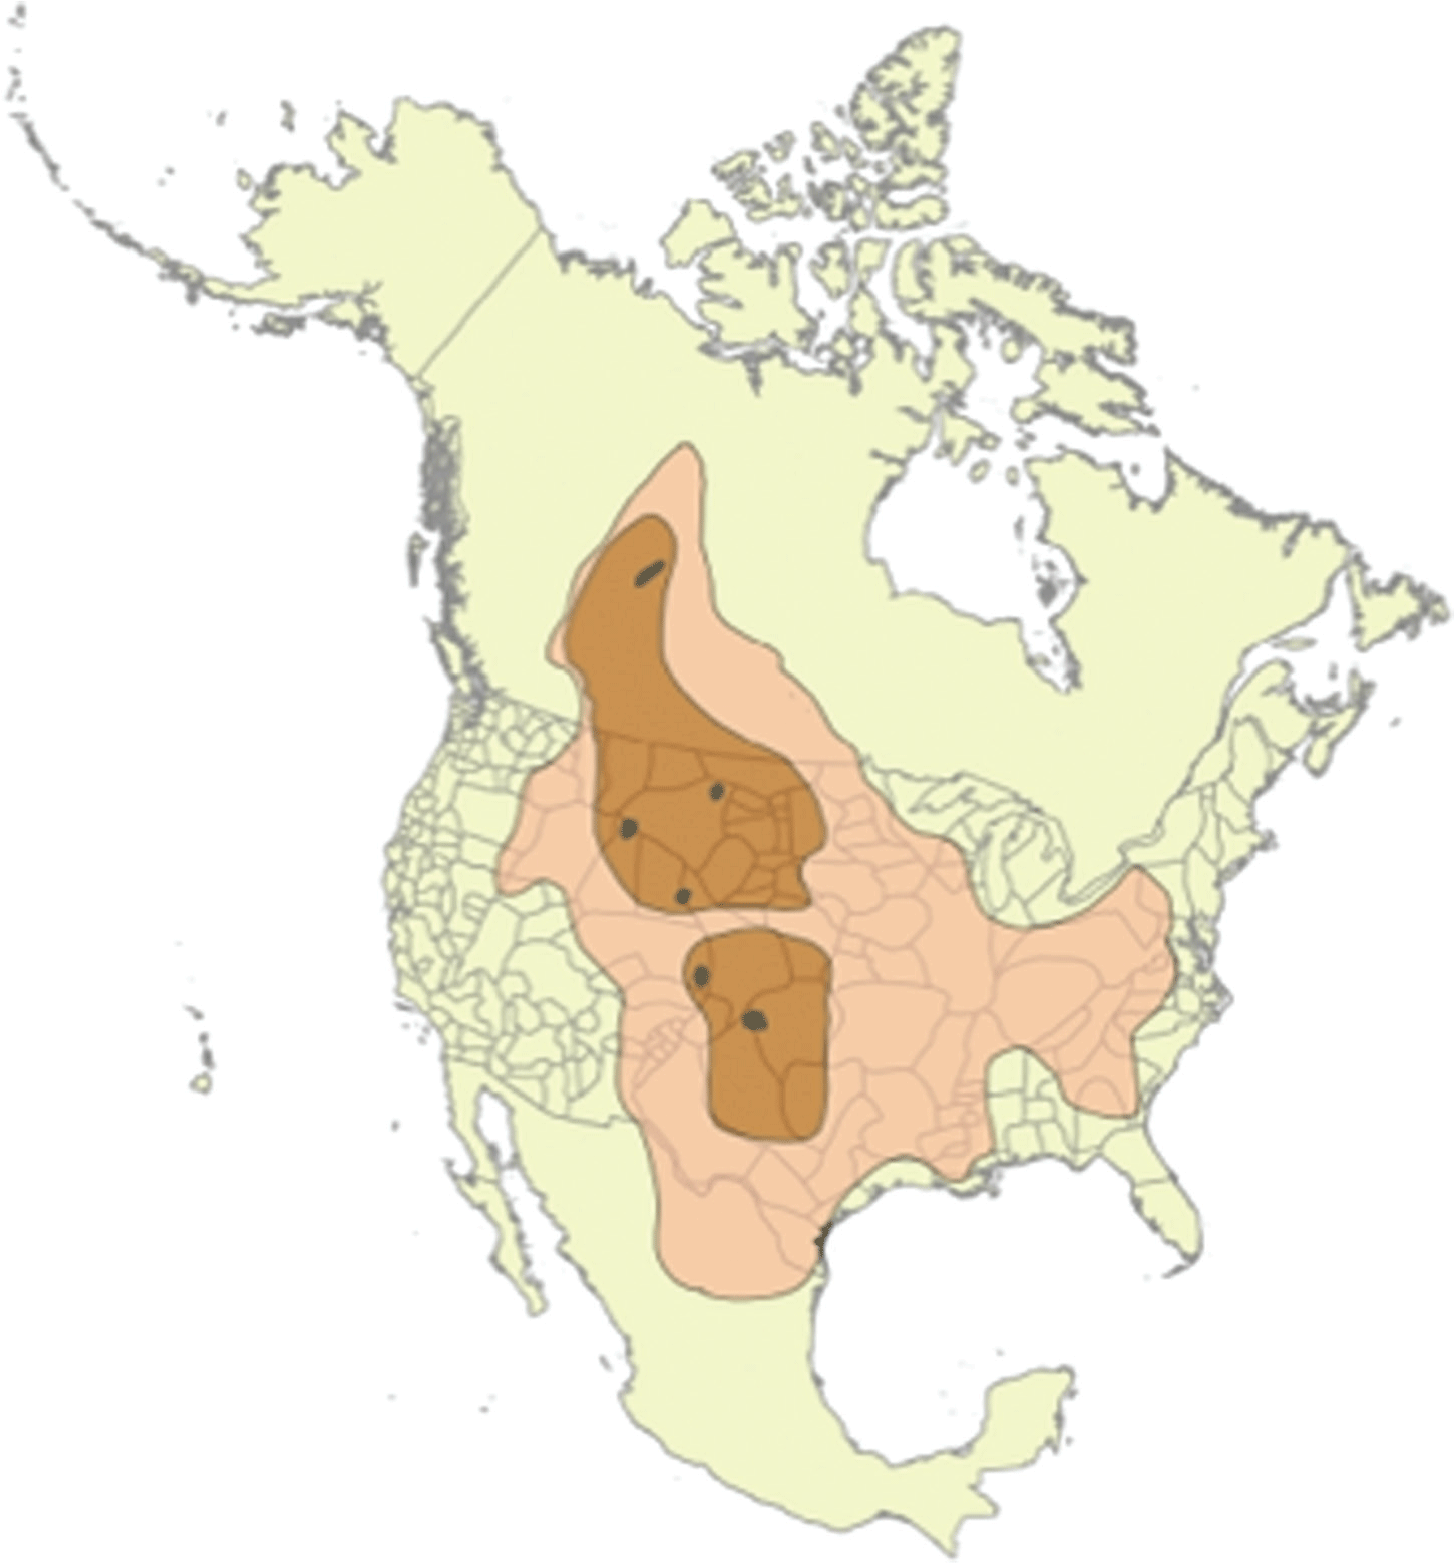
Yet, for all the diversity of wildlife, the bison “stands apart.” In vast herds, they dominated the landscape both physically and spiritually. Bison were not merely an important source of protein, clothing, tools, and trade goods; they were also, importantly, the center of the spiritual and social lives of many communities. In the 1500s, it is estimated there may have been 25–30 million bison on the Great Plains before they were hunted to extinction at the end of the nineteenth century (Taylor Reference Taylor2011). Figure 5 documents the declining bison range over the past three centuries; the black dots represent the remaining herds (Reference Feir, Gillezeau and JonesFeir, Gillezeau, and Jones forthcoming).
BISON RANGE PRE-CONTACT AND POST-CONTACT WITH EUROPEANS
Notes: This is a digitized version of the map by Hornaday (1889) illustrating the original range and decline of the North American bison. The orange illustrates bison range in 1730, tan the range in 1870, and the black dots denote the herds remaining in 1889 which were ranched in captivity. Tribal boundaries are displayed for the continental United States.
Source: Feir and Jones (2023). Used with authors’ permission.
Bison are individually large animals; a modern bison bull averages 2,000 lbs, and although cows are smaller, they still average 950 to 1,100 lbs. Despite their size, they are powerful, fast, agile, and aggressive, achieving speeds of 30–40 mph over short distances and running for hours at somewhat slower speeds. As a result, individually and collectively, they are dangerous animals (Bamforth 2021, p. 34). They move across their range, following the rains and the grasses, coming together into large herds during the rutting season and breaking apart into groupings of various sizes for the rest of the year. Yet, despite the enormous size of the bison population and the fact that there was a seasonality to migration, the vastness of the Great Plains could make them difficult to locate. Once found, a single animal or small or large herd had to be tracked, contained, and killed without the animals stampeding away or, worse, toward the hunters.Footnote 33 Additionally, a hunter had to be skilled enough to place the arrow so that it pierced the hide and vital organs without hitting bone.Footnote 34
Even with bison herds in the tens of millions, by the end of the fifteenth century, many on the eastern Plains were farmers living in settled agricultural communities, growing maize, beans, squash, and plants lost to history. Without domesticated mammals, these communities had to hunt for meat: deer, antelope, elk, and bison.Footnote 35 Relative to a deer or elk, a single bison kill could produce a substantial quantity of meat, but as in all hunting, the meat has to be transported back to camp or a residential location. The archaeological record shows that if a kill occurred a long way from the residential location, hunters might only take choice cuts of meat and leave the rest—a boon for predators like wolves, coyotes, plains grizzly bears, and raptors. If residential communities require access to meat protein on a regular basis, they need either to organize effective hunts or to have access to a reliable source of meat.
Bamforth (Reference Bamforth2011) argues that there were two quite different community-based forms of bison hunting on the Great Plains. The first was conducted by eastern Plains farmers living in permanent towns who would amalgamate annually for an extended bison hunt. While they could not rely on a herd returning to a particular location, they knew the general migratory pattern and so would spread out over a wide area. Once discovered, fire or cairns were used, along with groups of encircling hunters, to drive bison into surrounds where they were trapped and killed. The bison were then butchered and processed on site, and the processed meat was carried back to the towns. For decades, these sites were not recognized as community-based kill sites, in large part because many were used only once and, as a result, did not create a permanent archaeological footprint. In contrast, the second form of community-based hunting left a deep footprint.
Perhaps the quintessential image of bison hunting is of bison being driven through corridors of rock cairns to a cliff face by people waving and shouting. These kill sites, or buffalo jumps, are, however, only found in a small part of the northern bison range—Alberta, Saskatchewan, Montana, Idaho, and Wyoming. The image of bison rushing to their deaths belies the sophistication of the activity. These were not merely kill sites but, as discussed, sites for the industrial processing of bison meat into pemmican, a form that had a long shelf-life. These sites are, in essence, equivalent to Swift meatpacking plants. The hunting, killing, and processing of bison were carried out not by farmers but by hunter/gatherer communities.
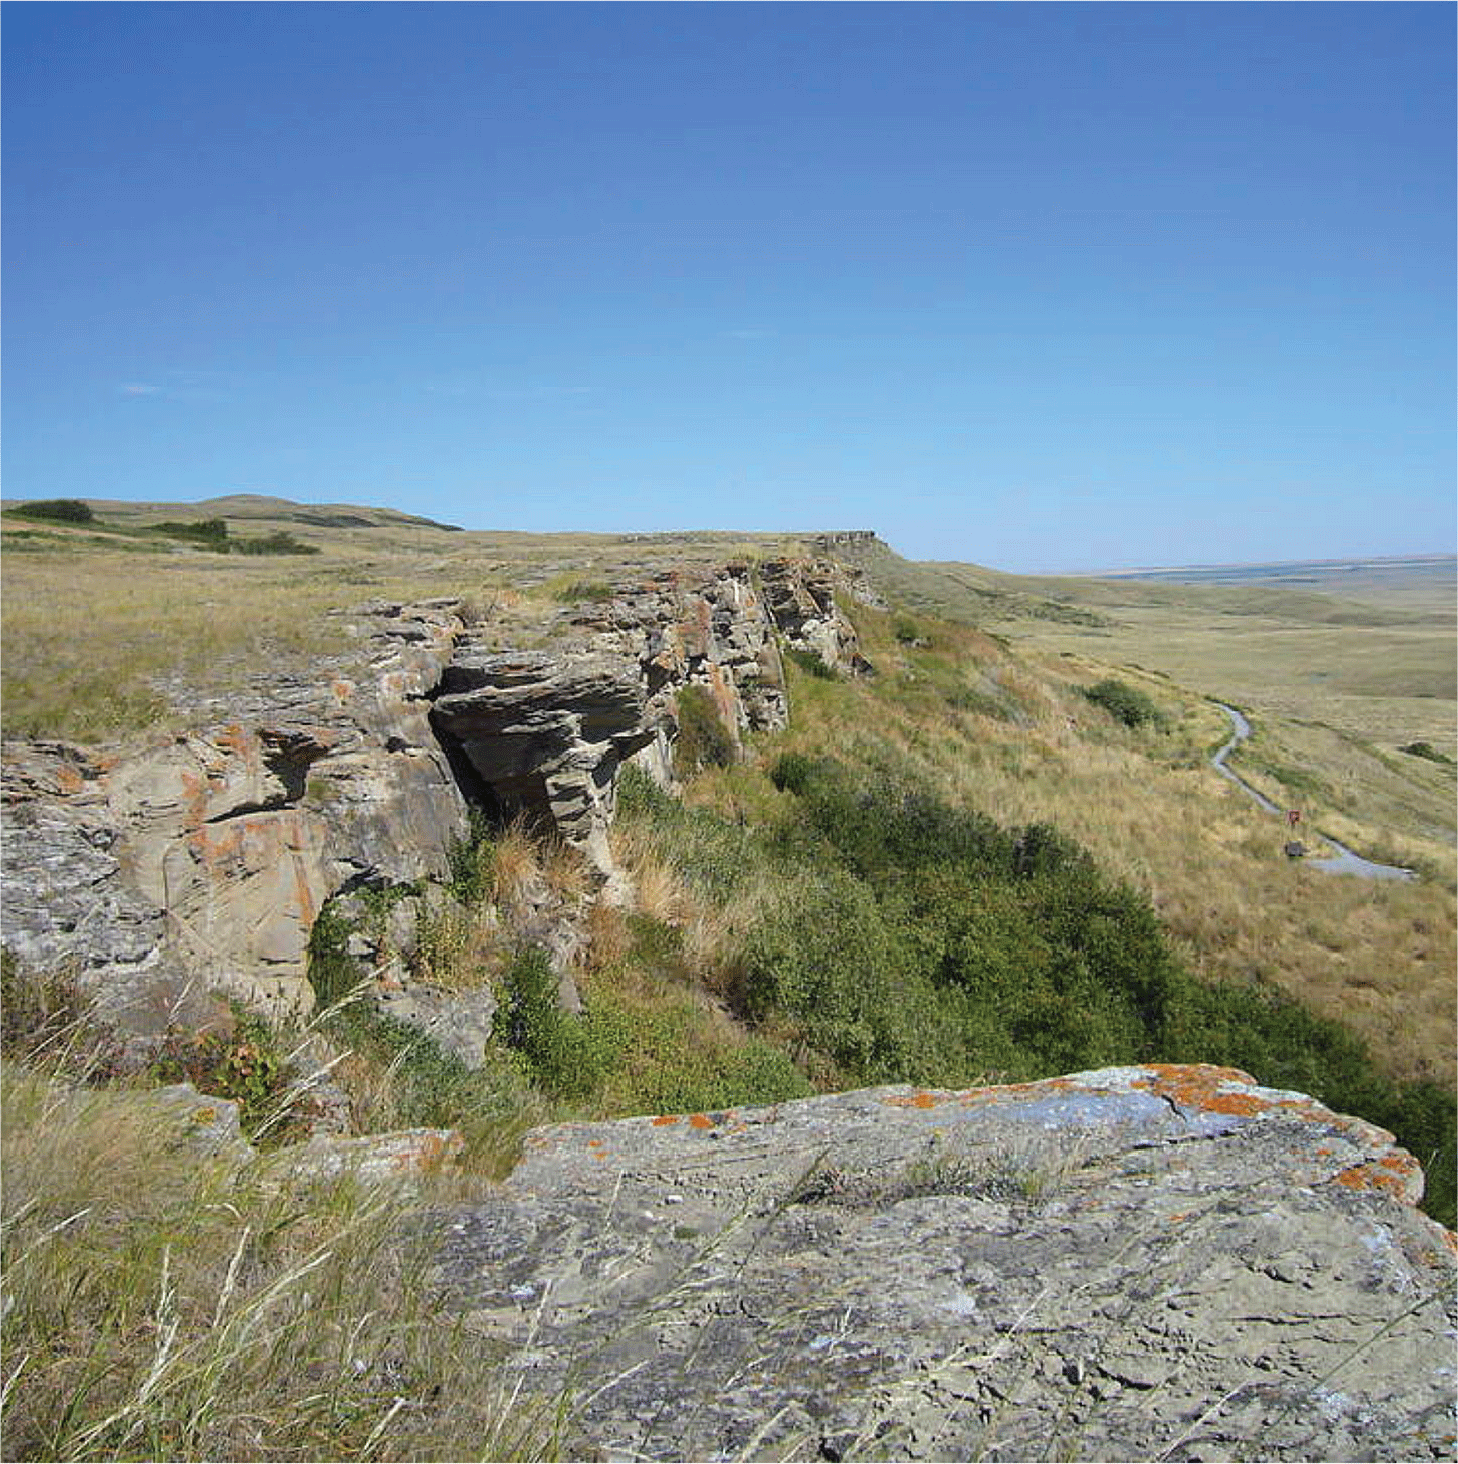
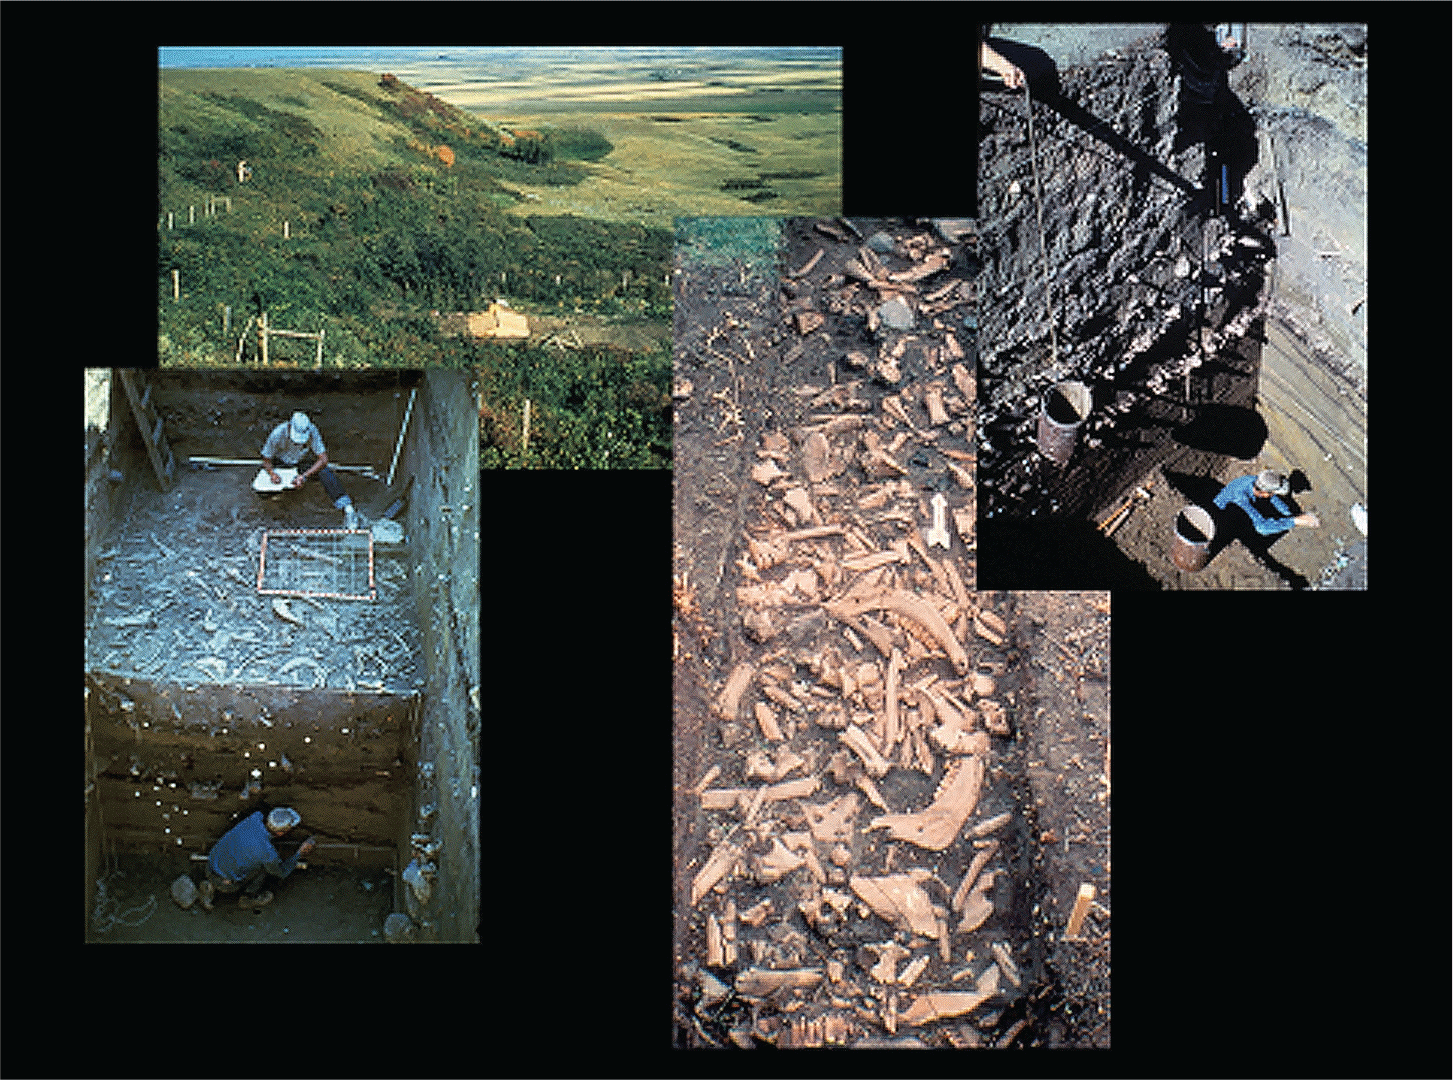
Here I focus on one site, Head-Smashed-In, in southern Alberta (see Figure 6).Footnote 36 Archaeological data record that this jump was first used over 4,000 years ago and intensively for roughly the last 2,000 years. Again, the bison had to be located and carefully driven to the cliff face. A herd needed to be 75 to 100 strong to create sufficient forward momentum such that when the leading animals realized the danger, they could not easily change directions without the momentum of the herd pushing them over.Footnote 37 The archaeological footprint at the site is immense, as the photographs in Figure 7 document. Head-Smashed-In has deposits tens of meters thick at the bottom of the cliff, containing millions of bones and “over a million projectile points” (Bamforth Reference Bamforth2011, p. 8). The skeletal remains of the pemmican-making process. Pemmican is a mixture of pounded, dried bison meat mixed with bone grease and marrow and, frequently, with berries.Footnote 38 Pemmican is light, easier than meat to transport, and importantly, it supplies about 3,200–3,500 calories per pound—the daily caloric requirement for an adult male during a northern winter (Carlos and Lewis Reference Carlos and Lewis2010; Colpitts Reference Colpitts2014).
HEAD-SMASHED-IN BUFFALO JUMP
Source: Photograph by Maureen J. Flynn. Available at https://whc.unesco.org/en/list/158/.
PHOTOGRAPHS OF THE ARCHAEOLOGICAL SITE
Source: Jack W Brink, Imagining Head Smashed In: Aboriginal Buffalo Hunting on the Northern Plains. Edmonton: Athabasca University Press, 2008. No changes were made. Used with permission by the creative commons at https://creativecommons.org/licenses/by-nc-nd/2.5/ca/.
Production of pemmican starts with the removal of the bison hide from the dead animal.Footnote 39 Hides themselves were valuable: as covering for teepees, clothing, armor, and trade. Each hide would have been carried to a location where it could be scraped down and cleaned. Each carcass was then disarticulated; the meat was dried by cutting it into strips and hanging it from rails or smoked/roasted in pits. Pit roasting required a pit lined with slabs of rock. The meat was placed in the pit, covered with more rocks, and left to roast. A fire was placed either in the bottom or the top of the pit on more stones, with fuel coming from dried bison dung.Footnote 40 When dried, the meat was pounded into small pieces and ground. Dried bison meat, however, is too lean to be nutritious. To be a nutritious food, it needed to be mixed with bone marrow and bone grease. It is here that the scale of the operation becomes apparent.
Releasing bone marrow or bone grease is arduous and labor-intensive; accessible fat had to be harvested from the carcass; bones had to be split and boiled; and the bone grease skimmed from the top of the boiling pan. At Head-Smashed-In, a 100,000 m2 processing area was created adjacent to the massive mound of dead bison. An ongoing excavation by a team from the Royal Alberta Museum has, over eight years, uncovered a 273 m2 (nearly 3,000 square feet) area that included, among other features, 41 pits and 42 hearths; of the pits, 18 seem to have been boiling pits and 17 roasting pits (Brink and Dawe Reference Brink and Dawe2003, p. 88).Footnote 41 These boiling and roasting pits are not merely holes in the ground but the physical manifestation of a complex production process and social organization among Blackfoot communities (Brink Reference Brink2008; Zedeño, Ballenger, and Murray Reference Zedeño, Ballenger and Murray2014).
To stone boil, a pit was dug and lined with a water-proof hide, then filled with water and shattered bison bones.Footnote 42 In a nearby location, stones were heated and, when sufficiently hot, placed in the water; cool rocks were removed to be reheated. Hot rocks were added until the water boiled and the grease floated to the top. The extent of investment in pemmican production can be captured by the rocks used to heat the water. Rock at the actual processing site was sandstone, and although local sandstone slabs were used to line the bottoms and sides of roasting pits, it was not used in the stone boiling process because the sandstone often disintegrated into gritty sand that was then incorporated into the bone grease, giving the resulting pemmican a gritty, sandy texture. Instead, the Blackfoot used river rock, found some miles away, and carried uphill to the boiling site. Brink and Dawe (Reference Brink and Dawe2003) estimated that the ratio of river rock to local stone in the excavated area was 6 to 1. They also found an even scattering of fire-broken river rock distributed around the pits.
Hundreds of people hours went into the production of pemmican each year: from locating the bison, driving them to the kill site, butchering, capturing bone grease, and processing. The following rough estimation illustrates the magnitudes involved. For simplicity, let’s assume a kill of 100 bison. Such a herd would generally comprise cows, sub-adult bison, and calves but rarely adult males. Assume an adult cow averages 950 lbs, sub-adult cows at least 800 lbs, 1.5-year-olds 650 lbs, and 6-month-old calves about 350 lbs (Brink Reference Brink2008, p. 168). The combined weight, of course, depends on the composition of the herd. A 100-animal herd with 50 cows, 30 calves, 5 sub-adult cows, and 15 one- and two-year-olds would generate a total live weight of 77,000 lbs. Of course, not all of this could be used. The norm today is about three/fifths of the live weight; however, these communities used more of the animal.Footnote 43 If 75 percent of the animal was used, this generated 57,750 lbs of bison available for consumption—some as meat and some as pemmican. Determining how much pemmican is produced is more difficult because it depends on the amount of bone grease/fat rendered. Modern recipes suggest four pounds of meat to one pound of fat, so roughly 7,500 lbs of pemmican if enough grease was available and all the meat was used for pemmican. This is, of course, an upper bound. Even if halved, this site produced significant quantities of pemmican, and Head-Smashed-In is just one of a number of such kill sites in the northern plains. Some others we currently know about are Gull Lake (Manitoba), Vore in the Black Hills, and Roberts Ranch Jump on the Colorado/Wyoming border.
As seen by its footprint, the processing site delineates a highly organized industrial production facility, from the drive lines to the production of dried meat and grease. At a fundamental level, plains hunters understood bison ecology and the ecology of the region in which they lived. What is less visible and sometimes invisible is the social organization that allowed for this production. Blackfoot oral history tells of various communities coming together communally (Brink Reference Brink2008). Despite the extent of the animal remains, no archaeological evidence of visible habitation has been found at Head-Smashed-In.Footnote 44 Yet such a large congregation of people, possibly in the thousands, required high levels of social organization and complexity to manage the site: food, cooking, water, and human waste. Management on this scale is not captured by the term mere hunter/gatherer community.
In Pemmican Empire, Colpitts (Reference Colpitts2014) explores the interaction of trade, technology, environment, climate, and resources to understand the role played by pemmican in the expansion of Hudson’s Bay Company trade into western Canada in the nineteenth century.Footnote 45 He persuasively argues for the centrality of pemmican to fuel both posts and the men who undertake the physically arduous journeys to and from the Arctic to Lake Winnipeg, Hudson Bay, or Montreal every year. By the nineteenth century, pemmican was factory-produced with Blackfoot, Cree, and Métis supplying the inputs, in essence continuing a trade that began centuries earlier. For Colpitts, the accounts and ledgers of the Hudson’s Bay Company document the size, scale, and reach of the pemmican trade, as well as its production and consumption. For earlier centuries, archaeological remains at Head-Smashed-In and other northern kill sites documented the scale of production for home consumption and trade.
Despite the large quantities of pemmican produced annually, pemmican is a perishable commodity, leaving little archaeological evidence. What has been found is the counterpart from a trade in pemmican—what the Blackfoot received in exchange. Although food remains are rarely found, some corn survived along with pottery and funerary items emanating from farming settlements along the Missouri River, moving along routes shown schematically in Figure 2. How pemmican was actually transported, who transported, and how long it took to reach the Missouri are all unknowns, as is whether trade and exchange were centralized at particular locations or independent traders acted as middlemen between these communities. The fact of interregional trade, however, is clear.
Bison was, as Bamforth so aptly wrote, an all-purpose technology. Beyond the meat and pemmican, its sinew was used for thread, hides for teepees, scapulae as hoes, and other long bones made into tools (Bamforth 2022, p. 329). Scapulae wear out quickly, and so there would have been a constant demand for replacements, with some, no doubt, coming from local hunting trips, trade with neighboring communities, and some from these kill sites. Bison hides had many uses, as noted earlier, for shelter and robes. Another use was as armor, documented in later rock art with depictions of a horse covered in bison hide armor to deflect arrow heads. If bison hides were used to deflect arrow heads from killing a horse, bison themselves must also have been difficult to kill.
In summary, if the archaeological record leaves little imprint of the impact of an interregional pemmican trade on the lives of the Blackfoot and the agricultural communities with which they traded, economic theory can guide us here. No doubt the Blackfoot originally made pemmican for their own consumption, just as those in agricultural communities would have farmed and hunted to meet their own needs. The scale and scope of the site tell us that at some point the Blackfoot and other northern nations began to specialize in the large-scale production of pemmican for trade with the large agricultural communities of the Missouri River basin. The Blackfoot received corn, pottery, and funerary items while the agricultural communities spent less time hunting and more time farming, enjoying through trade a share in the protein-rich bison. This interregional trade allowed both communities to consume beyond their production possibilities while community-wide pemmican production worked to reduce tension between groups over kill sites. Specialization and interregional trade allowed all groups to enjoy a wider range of products and a higher standard of living.
ALASKA AND TRADE ACROSS THE BERING SEA
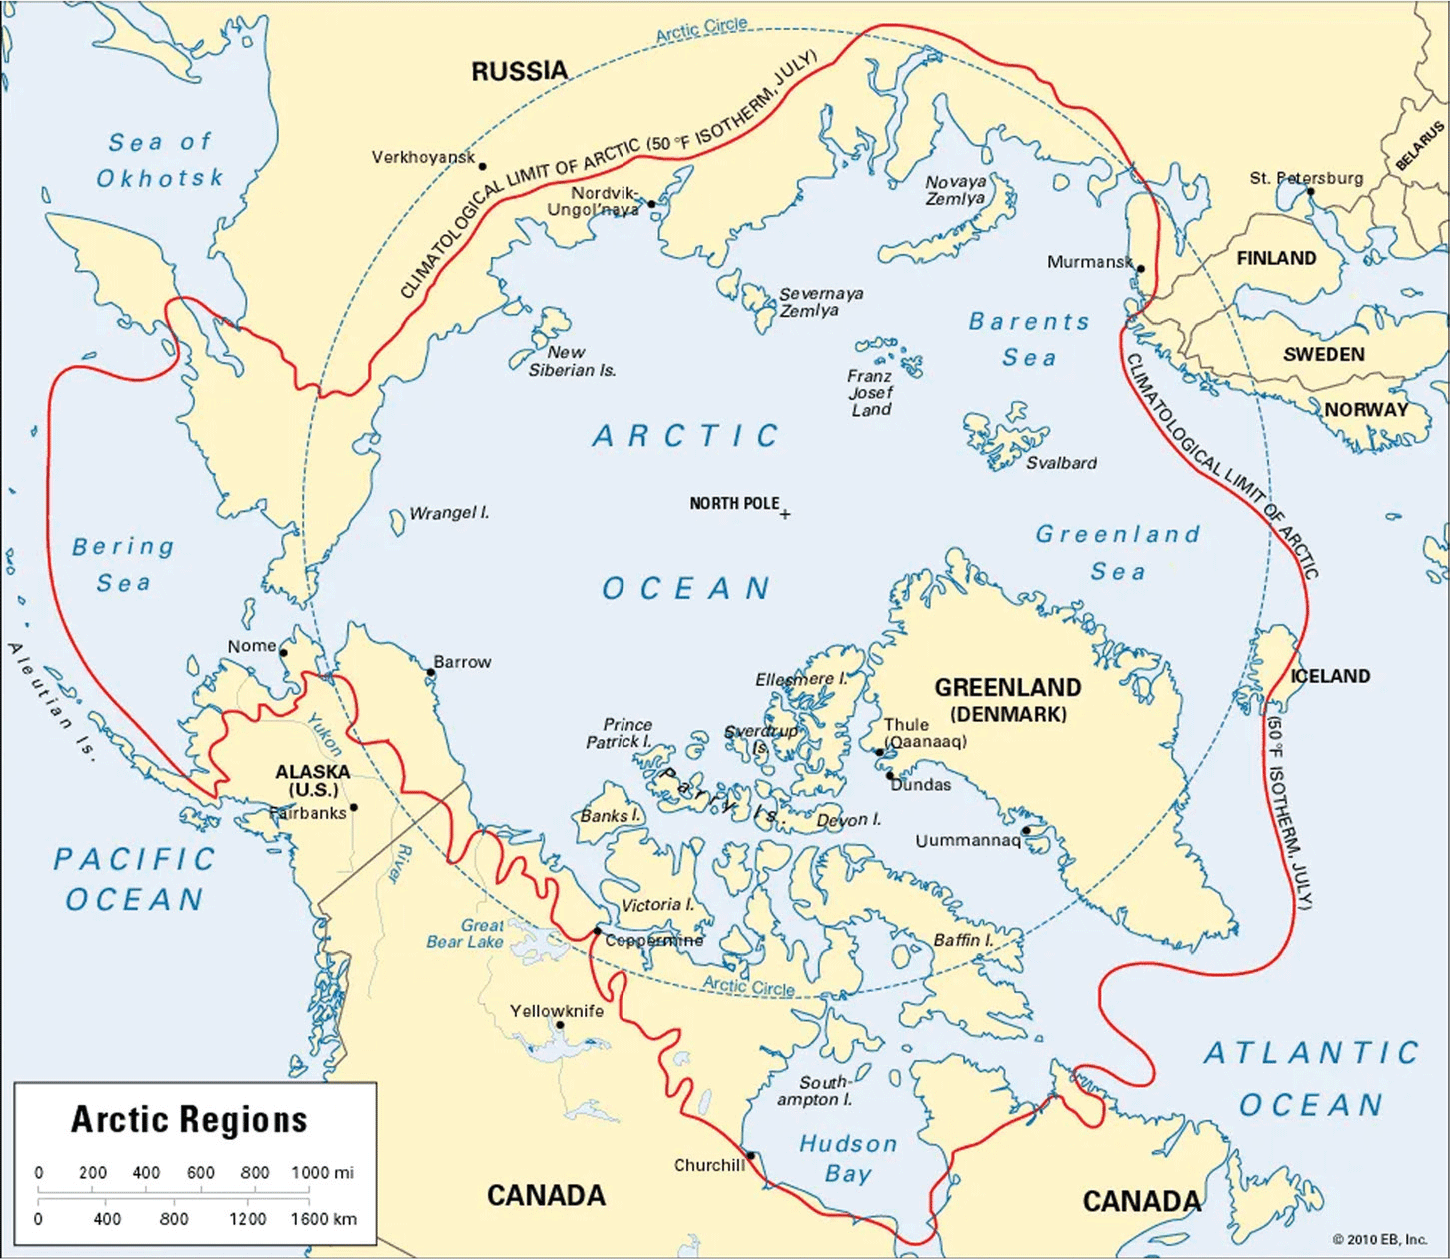
Alaska and Arctic Canada are remote, rugged, and sparsely populated extensions of the continent.Footnote 46 In the previous two sections, I discussed the intraregional trade of the Chumash and the interregional trade of the Blackfoot. Here, I discuss the international trade of the Bering Sea communities, who formed part of a global trading chain that extended from Alaska into Siberia, China, and the Mediterranean. If Alaska is remote from much of North America, it is adjacent to northeast Eurasia (Figure 8). Alaska and the Aleutian Islands carve an arc that focuses east; the natural geographic affinity of the region can be thought of as a sphere running through the Sea of Okhotsk, along the Kuril Islands, north to the Kamchatka Peninsula, to the Chukotka Peninsula (the closest point to Alaska), and east along the Siberian coast. At its narrowest, the distance between the Seward and Chukotka Peninsulas is only 55 miles. In the middle of the Bering Strait lie two small islands, Big Diomede and Little Diomede, due south of which lies St. Lawrence Island, Sivuqaq, with documented archaeological connections to the Chukotka peninsula.Footnote 47
ARCTIC REGIONS
Notes: The red line shows the climatological limit of Arctic for 50F isotherm July.
Source: Britannica, The Editors of Encyclopaedia. “isotherm.” Encyclopedia Britannica, https://www.britannica.com/technology/isotherm.
Owen Mason (Reference Mason2020, p. 317) writes that the “Bering Strait was a complex stew of hybrid cultures,” the origins of which may be only imperfectly understood. At the same time, the range of languages and people speak to the movement or migration of communities and cultures over centuries.Footnote 48 Although Alaska’s remoteness should mean that more historical sites survived, archaeological work here faces other challenges. The geography and winter climate severely hamper excavation, while storms and spring run-off erode or wash away the coast line, and, today, rising ocean levels present another threat.Footnote 49
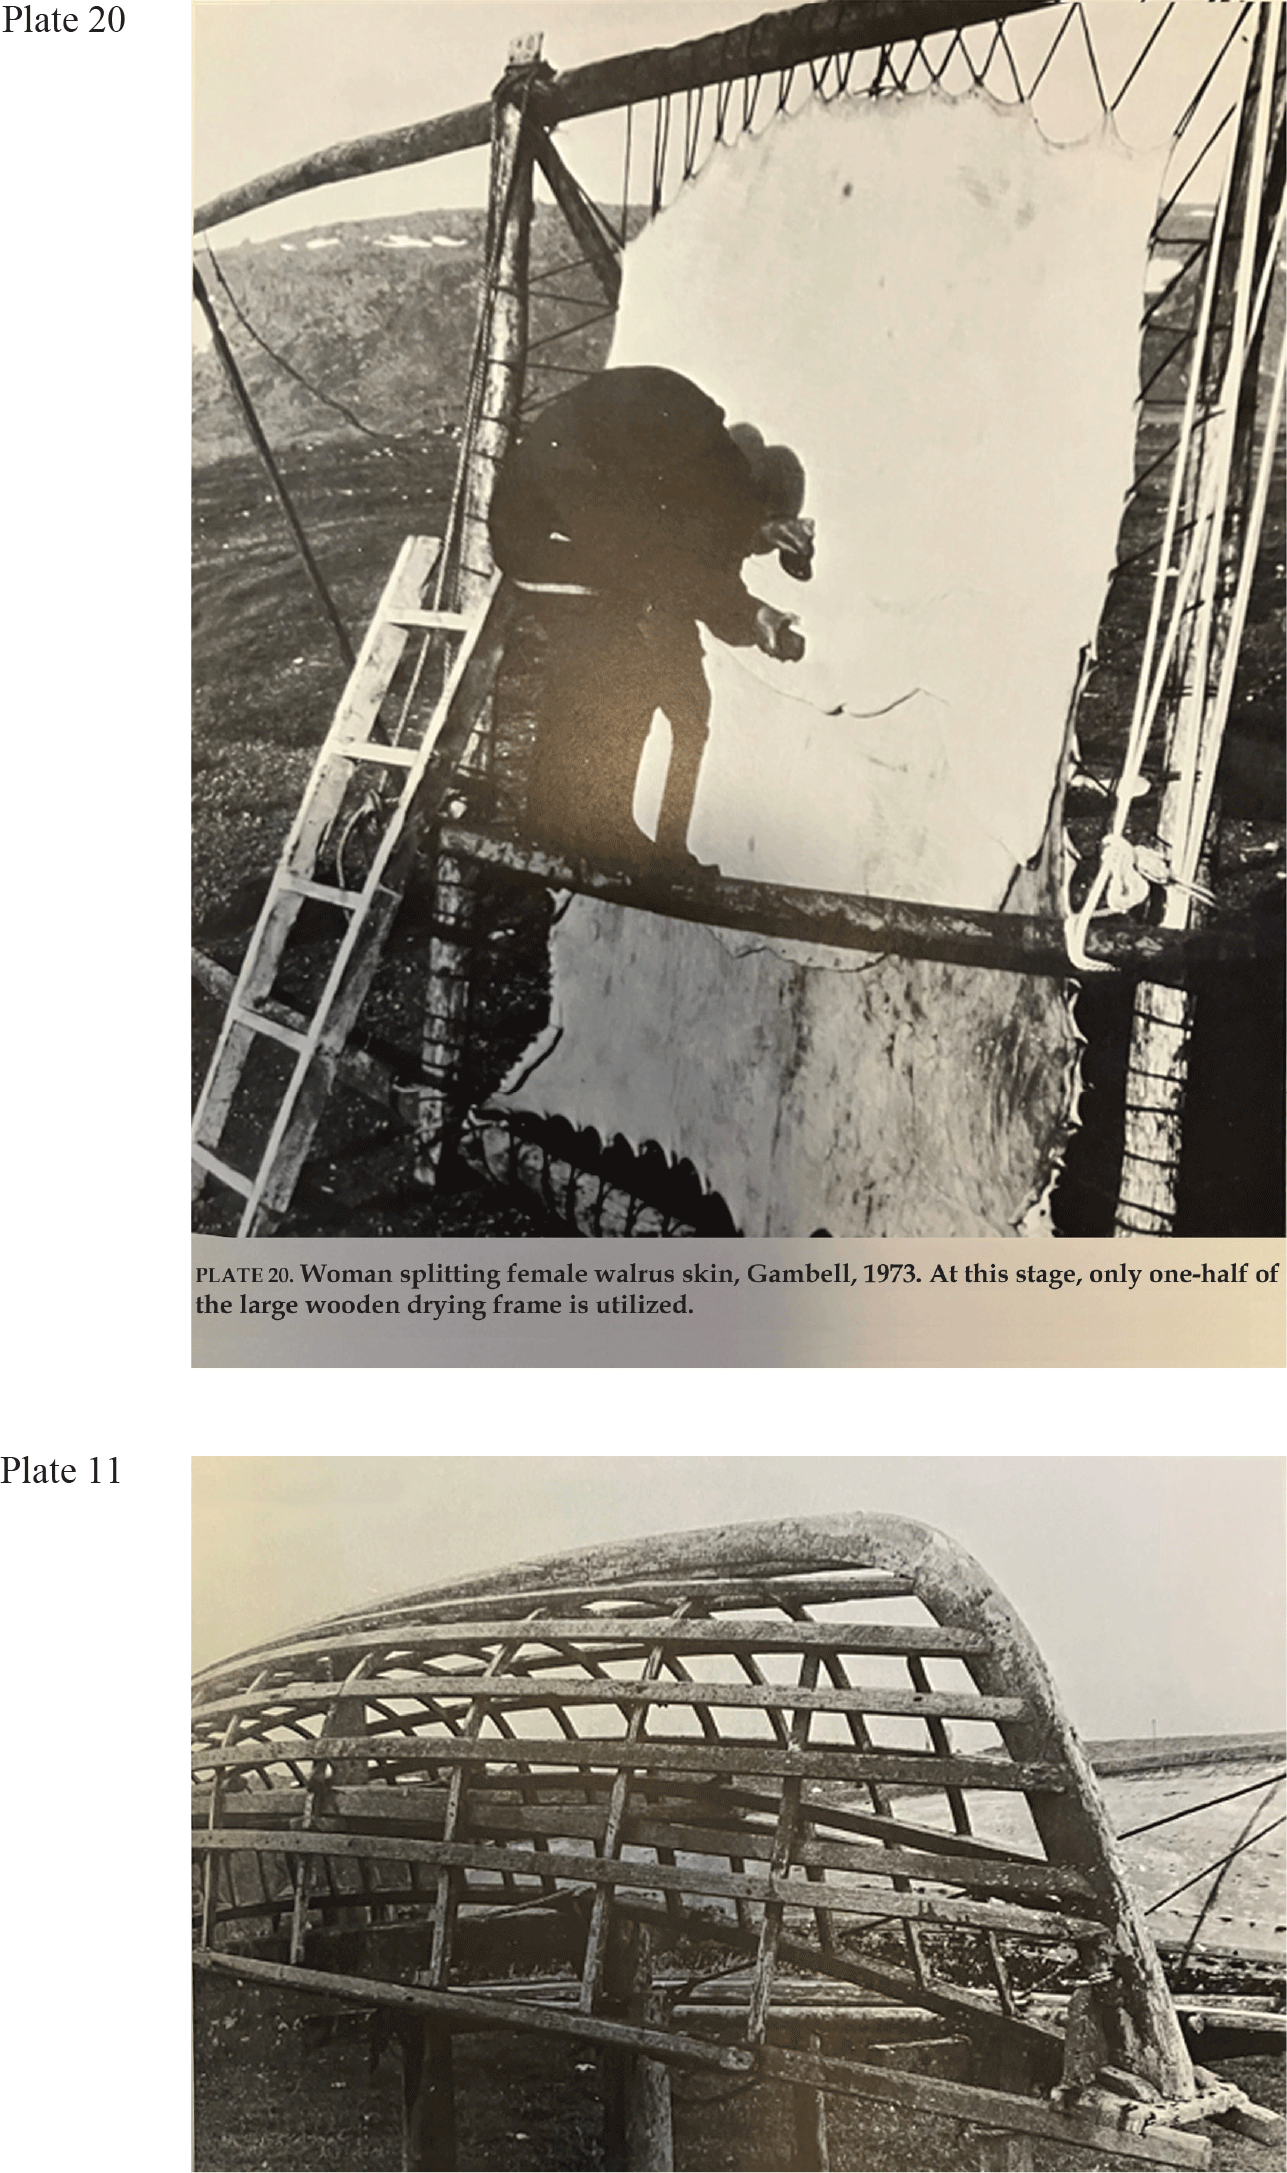
Discussion of trade across the Bering Sea must address the question of transportation. Walking across the Strait in winter might be possible, though limited daylight and the dangers of sea ice make such a route dangerous. Whether emerging independently in the Bering region or an imported technology that spread into the region, local skin boats were noted by early European/American whalers.Footnote 50 Although the organic nature of the materials used makes it difficult to document construction sites, walrus skin boats were constructed on St. Lawrence Island into the twentieth century (Braund Reference Braund1988).Footnote 51 Walrus skin boats comprised a wood frame (ribs and keel), and, as with the Chumash, St. Lawrence Island boat makers were dependent on tree stumps and drift wood swept out to sea during spring runoff of major rivers, such as the Yukon and Kuskokwim, and caught at the eastern end of the island. Tree stumps used for the curved pieces rising from the keel, appropriate sized driftwood was planed for the keel and ribs, and the resulting hull was covered with female walrus skin.Footnote 52
In an ethnographic study, Stephen Braund (Reference Braund1988) captured the ago-old process of boat building by the St. Lawrence islanders. A 1973 photograph captures a walrus skin being prepared (see Figure 9).Footnote 53 First, the walrus skin was stretched on a large wooden drying frame. Then a woman would separate the inside and outside of the skin, which would historically have been done using an “Ulu,” a process that shows the sophistication of this lithic technology.Footnote 54 Once separated, the divided skin was spread over the boat frame and stitched together with braided whale sinew today, although caribou or raindeer sinew were also used in the past (Braund Reference Braund1988, p. 53). Sinew works well because it swells when wet, closing the stitching holes. Although skin boats get waterlogged with prolonged immersion, they just need to be taken out of the water to dry and, perhaps, be oiled. Angyapik were used for hunting walrus and bowhead whale in broken ice conditions in the ocean and still in use today in Point Hope and Utqiagvik (Barrow).Footnote 55 These boats were larger than those among the Chumash, light, easy to repair, resistant to and maneuverable in sea ice, with a carrying capacity of upward of 6,000 lbs and used for social and trade contact between communities or for migration.Footnote 56
PREPARATION OF A WALRUS HIDE AND BOAT
Source: Braund (Reference Braund1988), The Skin Boats of Saint Lawrence Island, Alaska, Plates 11 and 20. Photograph by Stephen R. Braund.
Direct evidence of the use of ocean-going vessels can be inferred from a series of migrations in the second millennium, as documented through archaeological remains. Though there were undoubtedly prior migrations. In the Birnirk migration in the eleventh century, people moved from Eastern Siberia to the Chukotka Peninsula, across the Bering to the Seward Peninsula, and then north along the Alaskan coast. This was followed by the Thule Panuk migration in the twelfth century, with continued movement along the Arctic Coast from Siberia, reaching Greenland by the middle of the thirteenth century (Friesen and Arnold 2008; Friesen and Mason 2016). People also moved down the coast to Kamchatka and perhaps even the bottom of the Aleutian Islands (Mason Reference Mason2020).Footnote 57 These were seaborne migrations, and regardless of why these groups moved (climate change, resource pressures), these migrations tell us that seaways and a viable seafaring technology existed. Additionally, such migrations carry information, knowledge, and products as people are absorbed into existing communities, or dominate existing communities (Mason Reference Mason2020, pp. 335–39).
Unlike the Blackfoot bison communities and the Missouri-based agricultural settlements with their different resource bases or Chumash communities with quite different skills, the resource bases on either side of the Bering Strait with a focus on fishing and marine mammal hunting both from shore and ocean were very similar. However, variability in the abundance of resources was always an issue, depending as it did on local ocean currents, climate, and wind, which determined the movement of mammals, fish, and krill (the main food source for bowhead whales). At the same time, a few locations were more stable. For example, a combination of current and upwelling created a rich bowhead feeding ground on the south shore of the Chukchi peninsula, where a “polar Stonehenge” created a Whale Alley with over 50 bowhead skulls and 30 mandibles and standing rocks reflecting whaling success (Mason and Gerlach 1995; Mason Reference Mason2020, p. 312). Despite the compostable nature of whale meat, blubber, oil, baleen, and seal oil, there is enough evidence of trade in marine mammals to show the movement of such items in both directions across the Strait, presumably to alleviate periods of scarcity. Whale bone was used to fashion tools, such as blades, forks, fishing weights, and harpoon heads (Rasic Reference Rasic2016).Footnote 58
Some artifacts or evidence of artifacts found in archaeological sites point to trade not merely across the Bering Sea in response to resource variability but to trade connections between the west coast of Alaska and Siberia and beyond. These are bronze and iron artifacts and beads. Metal was not unknown in North America. There was extensive metal working in Mesoamerica in gold, silver, and copper used to create jewelry, plate, and household items such as needles (Bigelow Reference Bigelow2020), some of which was traded north into southern North America (Bamforth 2021). Copper, however, was also mined at a number of well-documented sites in the northern part of the continent. One is the Coppermine River in the Northwest Territories and Nunavut, which was first mined around 6000 BCE. Another lies at the head of Lake Superior; copper mining here dates to 4000 BCE. A third site is Kletson Copper, dating from 1000 CE in the Wrangell and St. Elias Mountains (Harris 1987, Plate 13).Footnote 59 Copper from this site was used both for prestige items, such as various forms of jewelry, and for tools. Cooper (Reference Cooper2012) argues that control of this copper source and its supply led to wealth, prestige, social complexity, and permanent social inequality among the Ahtna, in whose territory lay the main sources. Theirs was a stratified hunter/gatherer Athabaskan society consisting of nobles, commoners, and slaves.
Kletson copper was mined as placer nuggets in stream beds, which were then cold-hammered into thin sheets, annealed, and formed into utilitarian and prestige items.Footnote 60 To date, these copper artifacts have been found at 78 sites, some extensively excavated and some not; however, only one copper item was found in over half the sites: 6 sites had 14 or more items, with two having 138 and 170 items, respectively (Cooper Reference Cooper2012). The artifacts comprise jewelry (neckbands, ear or lip ornaments, bracelets) and tools (awls and drills, projectile points, knives, and needles).Footnote 61 Although experimental research suggests that annealed projectile points could be used more often than stone because they were less likely to break on impact and thus reduce the time in projectile point manufacture, they do not dominate the architectural record. In only one village, Dakah De’nin’s Village, were no flaked stone tools found; perhaps because of limited supply of copper tools perhaps because lithic technology was as good as or better than currently understood and cheaper (Cooper Reference Cooper2012, p. 557, citing Shinkwin Reference Shinkwin1979).
When we speak about the absence of metal in North America, we generally mean foundry iron. Iron was not unknown. Meteoric iron was present in Greenland, and there are known supply routes emanating across the eastern Arctic (see Harris 1987, Plate 13). As with copper, this too was cold hammered and formed into harpoon heads and other projectile points. Jolicoeur (Reference Jolicoeur2020) documents the presence of iron artifacts at sites across the Eastern Arctic. But, while present, these meteoric iron tools/artifacts do not appear to have traded outside the region, nor do they dominate, with iron and stone harpoon heads not merely being found together at a site but dating from the same period.
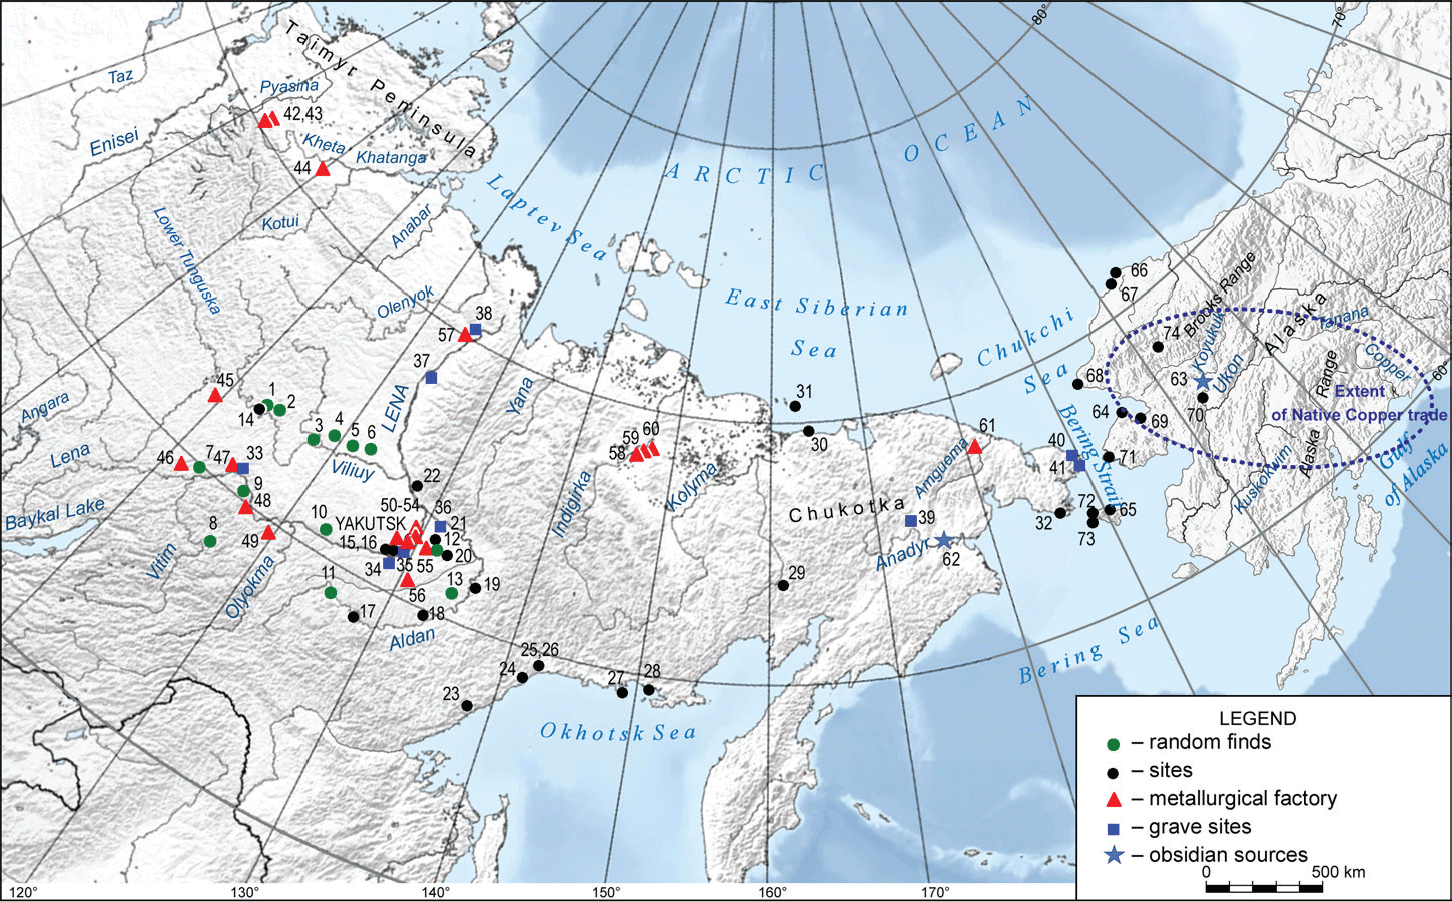
Metal is also present in Alaska. In a meta-study, Dyakonov et al. (2019) document the spread of copper, bronze (copper and tin alloy), and non-meteoric (or foundry) iron through northeastern Russia and Alaska. Figure 10 shows the spatial and temporal distribution of these artifacts at sites across the region.Footnote 62 Bronze casting or foundry sites date from the second millennium BCE and have been found along the major rivers in the Yakutia region, due east of Chukotka. This technology had spread north up the major rivers from Asia to the Arctic such as the Lena, taking a millennium to reach the Chukotka peninsula. Cast bronze items, however, were traded across the Bering Strait to coastal communities and inland even if the technology for making them did not, or rather, evidence of such technology had not yet been uncovered (Dyakonov et al. 2019, p. 356).
Foundry iron has also been traced to metallurgical centers near Lake Baikal before the technology spread north into the Yakutia region and later to Chukotka, again dating to the first millennium (Dyakonov et al. 2019). Again, it appears that the artifacts and then the technology traveled along the Lena and Amur Rivers, possibly also along the Okhotsk coast, or from the Sea of Japan (Dyakonov et al.). The artifacts comprise drills, gravers, and some knife blades. Although only a few iron axes have been recovered, most of the foundry iron is present in small pieces or as small engraving tools used to carve walrus tusks, something that is more difficult to do with stone burins.Footnote 63 In contrast to the Yakutia and Chukotka regions, there is no current evidence of any metal smelting facilities in Alaska.
Iron, even in small quantities, was used in North America prior to the arrival of Europeans on the east coast (Cooper et al. 2016). There were, however, some issues. The most severe was that, at this time, iron was a frangible metal. It shattered in the extreme cold. Ray and Freeman (Reference Ray and Freeman1978) and Carlos and Lewis (Reference Carlos and Lewis2010) document how the Hudson’s Bay Company London directors spent over four decades trying to understand why, even though no issue could be found with that item in England, Indigenous traders in sub-arctic Canada refused to buy any iron product with a blemish. Indigenous traders told the factors that such products would not withstand a northern winter because any blemish led to frost wedging and, as a result, axes and hatchets shattering and guns exploding.Footnote 64 The intensity of the Arctic winter limited iron use. What this meant was that Alaska, rather than being a port of entry into North America in the centuries before the arrival of iron technology with the Europeans, was, in fact, the terminus of a trans-Siberian trade in iron.
Spatial Distribution of Bronze and Foundry Iron
Source: Dyakonov et al. (2019, figure 1). Used with authors’ permission.
These iron artifacts are not the only evidence of long-distance trade across northern Asia and into Alaska. Kunz and Mills (Reference Kunz and Mills2021) report on the discovery of eight undecorated glass beads (shown in Figure 11) in three Alaskan sites on the Noatak River, which connects the coast to the interior. The river discharges into Kotzebue Sound near Sheshalik, a known trading center just north of the Seward Peninsula. Beads formed an important and even essential component of trade in the eighteenth century. In the Hudson’s Bay Company trade, beads were high-quality Venetian Murano glass beads or Chinese beads imported into England by the East India Company. Indeed, the selectivity of Indigenous traders in their choice of beads by size and by color has been well documented, and beads of the wrong color or the wrong size remained unsold and were sent back to England (Carlos and Lewis Reference Carlos and Lewis2010).
VENETIAN GLASS BEADS FOUND IN ALASKA
Source: Kunz and Mills (Reference Kunz and Mills2021, p. 397, fig. 1). Used with authors’ permission.
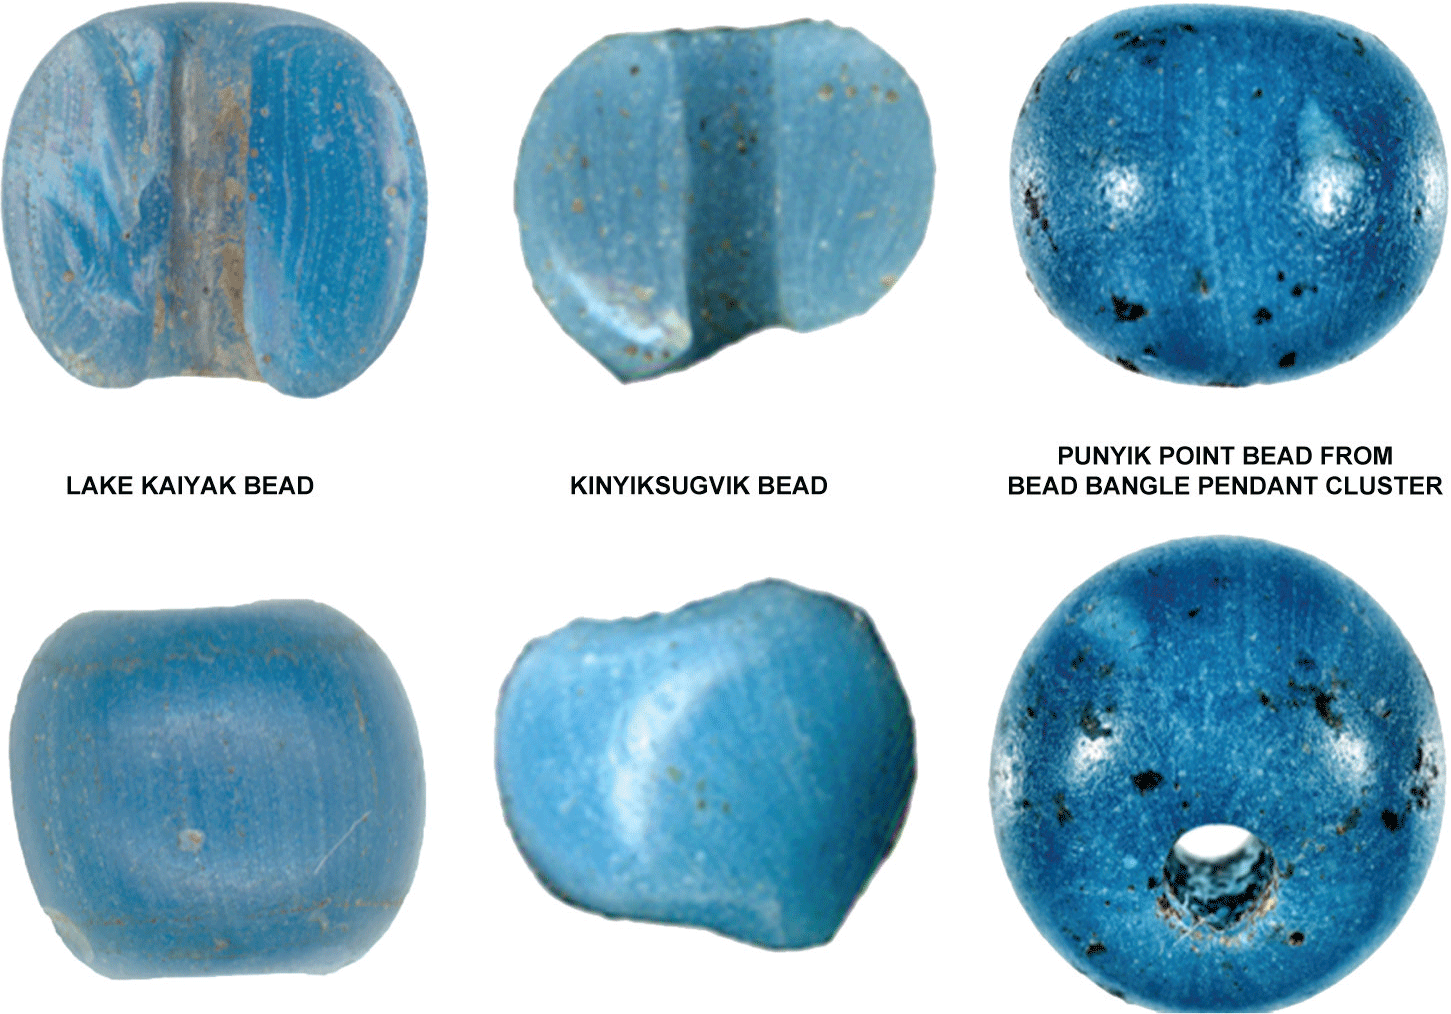
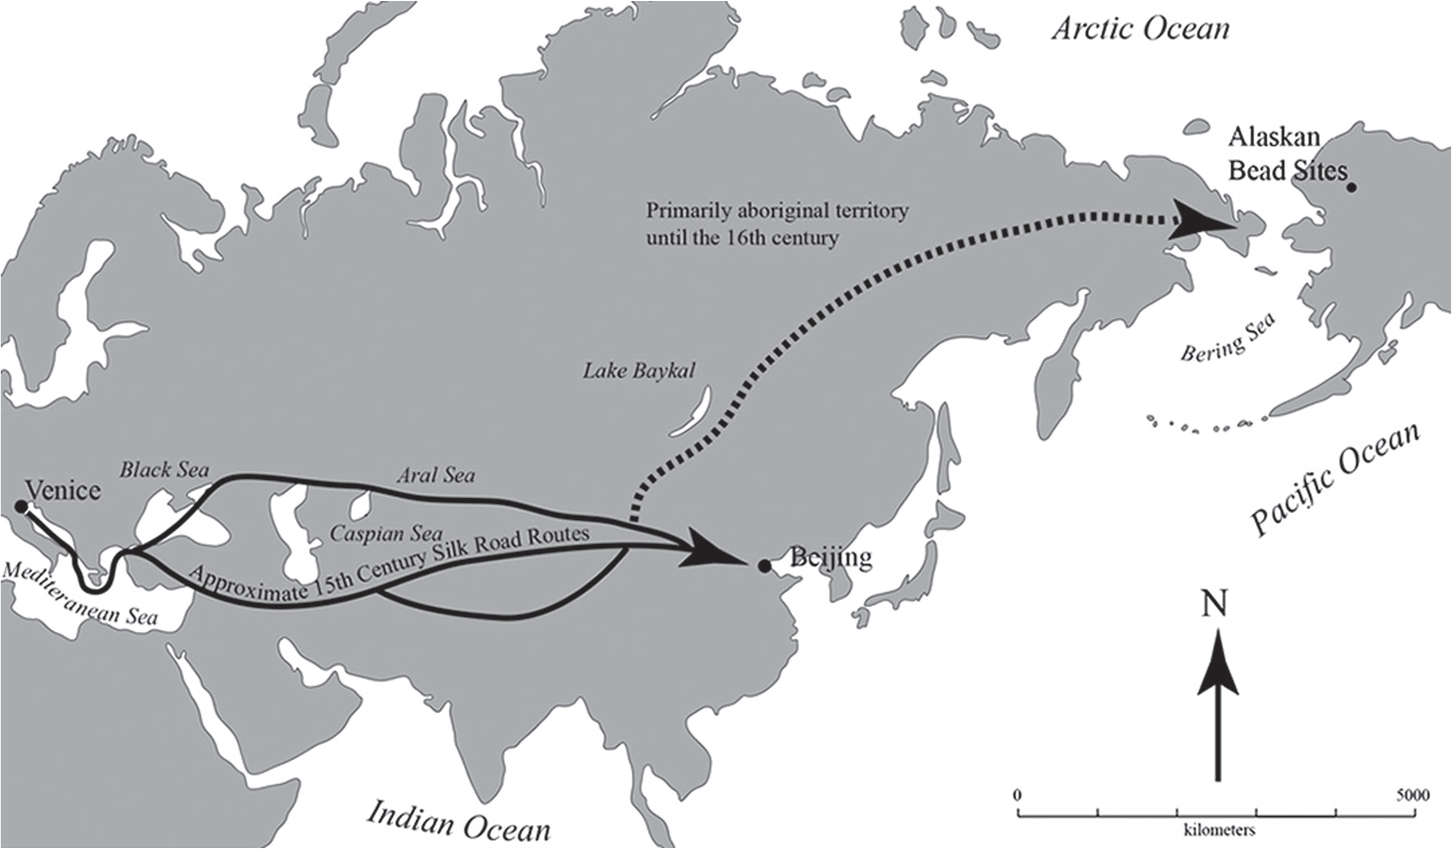
Kunz and Mills argue that the style and physical characteristics of the beads show them to be Venetian. We should not think of beads as only a product for trade with Indigenous communities. Indeed, their manufacture in Murano and other glass-making areas tells us that there was an extensive European market for this product.Footnote 65 These particular spun glass beads were found along with a copper bracelet and bangles, part of a bangle fragment, and iron pendants. Although the glass beads themselves cannot be radiocarbon dated, the plant fibers wrapped around the overlapping ends of the bangle found in the same strata and close to the location of the beads could be. Radiocarbon dating gives a range of results, with the authors arguing for a fifteenth-century date.Footnote 66 While this is almost concurrent with the arrival of the Spanish in the Caribbean, it long predates the arrival of any European contact in Alaska or the possibility of trade goods moving across the continent to Alaskan coastal communities. Rather, Mills and Kunz posit a route (see Figure 12) from Italy that they name the “snow road.” This putative route mirrors that of the iron foundries north of Lake Baikal (Baykal) and up the Lena or overland to the Chukotka peninsula. Whether one should place the weight of a transcontinental Eurasian trade on eight glass beads found at three sites is a reasonable question. However, given that these beads are about 0.5 centimeters each, the fact that they were found at all is itself an amazing discovery.
“SNOW ROAD” TO ALASKA
Notes: The dotted line traces out a likely 17,000 km route by which beads from Europe arrived in Alaska in the fifteenth and sixteen centuries.
Source: Kunz and Mills (Reference Kunz and Mills2021, fig. 7). Used with authors’ permission.
By the first half of the second millennium, Alaskan communities were part of the long-distance trade, perhaps from Italy but certainly from northern China and Japan. Any assertion that the Americas were never part of a cross-continental trade is incorrect. The bronze and iron artifacts and glass beads found at these Alaskan sites document such a trade (as does the movement of fish, whale, and seal products). Without a doubt, however, the volume of trade was small. We know from modern empirical work on trade volumes that the volume of trade is largest among nearest neighbors and that the volume of trade is positively related to a country’s GDP or population size. Communities in Alaska and on the Chukotka Peninsula were small, with communities spread across a wide area. Some comprising, perhaps, 2 or 3 families, and others 10 to 20 families (Mason Reference Mason2020). Even today, communities in Alaska outside Anchorage and Juneau remain small. The climate, the resource base, and the population size attenuated the scale of local production, the surplus, and the resulting volume of trade. The size of communities limited the scale of trade across the Bering Sea and the scale of trade with the nearest neighbors, and other small Athabascan communities living in the interior of Alaska. Yet the fact that after five to ten centuries we can find evidence of this long-distance trade should ask us to consider what else we may have missed or misunderstood.
CONCLUSIONS
Although economic historians acknowledge the existence of Indigenous nations in the Americas before the arrival of Europeans, the reality of that existence gets ignored in the post-contact world. When not ignored, designating Indigenous societies as primitive or mere hunter/gatherers erases the reality of Indigenous economies, constructing an assumption of North America as one made productive by Europeans, their skills, and institutions. But neither the term primitive nor hunter/gatherer captures the reality of pre-contact North American economies, and both should probably be retired as incomplete stereotypes. There were organized, complex agricultural communities with settled populations that had opened and cleared land, domesticated plants, crafted irrigation systems, and determined the best rotation and fallow practices for a given region. These actions were not lost on colonial settlers (Coughlan and Nelson Reference Coughlan and Nelson2018). By ignoring this reality, we, in effect, transfer the capital investments made by these groups to Europeans.
Not all communities were agrarian. There were hunter/gather/forager communities, some small and other with dynamic and complex economies; some socially stratified and other more egalitarian. In this paper, I discussed three non-agricultural Indigenous communities: the Chumash of California, the Blackfoot of Southern Alberta, and the Alaskan maritime communities of the Bering Strait region, focusing on specialization and trade based on comparative advantage and a love of diversity. In the five hundred years before the Spanish arrived in the Caribbean. These three communities reflect very different regions of North America, each with its own opportunities and constraints. These economies were neither static nor unchanging. Intraregional trade among the Chumash allowed the development of skill/craft -based specialization, such as building sophisticated ocean-going boats or “minting” shell bead currency. Trade, here, led to or was generated by social stratification with elites and a priestly caste. At the same time, the Chumash developed institutions such as a defined calendar of feasts designed to redistribute resources across groups or regions.
Among the Blackfoot, the evidence describes community-wide hunting strategies for bison and the evolution of a complex technology for bison preservation or pemmican production. Pemmican production required sophisticated social organization to manage the industrial scale of production and the labor requirements that it embodied. Pemmican was traded inter-regionally to agricultural communities along the Missouri River, perhaps for corn or other consumption goods but also for pottery and other items. The complex production site at Head-Smashed-In and other such kill sites belies any simplistic idea of mere hunter/gatherers, describing, rather, dynamic social and production activities that combined Blackfoot communities and used trade to increase standards of living and acquire goods that were not produced locally.
The maritime communities of the west coast of Alaska were fishing/gathering communities in a harsh environment and most closely resemble the stereotype of hunter/fisher/gatherer communities, but these communities were never autarkic or unchanging. Mason (Reference Mason2020) describes this region as a “complex stew of hybrid cultures” that came about through international migration across the Bering Sea. Despite the fact that these coastal communities were small, coastal and ocean whaling or sea-mammal hunting required social organization, bringing together small communities with resources shared or traded. The archaeological data shows that Alaskan maritime communities traded both inland and across the Bering Strait. Trade did not just equilibrate local resource surpluses or deficits but allowed these communities to be part of a trade route stretching from Siberia to China and the Mediterranean. Italian glass beads and bronze and iron artifacts testify to a trade that dated well before the arrival of Europeans on the East Coast.Footnote 67
Indigenous trade routes, markets, and rendezvous locations formed the backbone of road and water systems and market hubs for Europeans and Americans in the centuries after contact. While we might talk of colonists and their descendants exploring North America, in reality, they were shown the continent by named and unnamed Indigenous guides and communities. Extensive trade relations and markets, developed and refined complex technologies and production processes, and developed social, political, and economic institutions describe the reality of the Indigenous world before contact and in all probability generated standards of living that were comparable to many in Europe.Footnote 68 Knowledge of this world is the product of archaeology, plant science, and chemistry, to name a few disciplines. North America before 1492 was not a pristine and empty land.


 Open access