


Introduction
The thermodynamic equilibrium and kinetics of oxide dissolution reactions determine their chemical durability in aqueous solutions. The rate at which these materials dissolve into the environment is of great interest in a range of applications, such as the synthesis and performance of ceramics, reactive transport of contaminants, carbon sequestration, nuclear waste disposal, and chemical weathering. For industrial materials, environmental weathering leads to concerns related to safety and efficiency and value losses. In the subsurface environment, mineral dissolution affects the reactive transport of natural and man-made contaminants, the performance of a nuclear waste repository, and carbon dioxide sequestration in a geological formation. In the Earth's surface environment, geochemical weathering of the continental crust has a dominant role in the balance of carbon dioxide in the atmosphere, elemental cycling on the Earth's surface, the formation of soils, and the chemical evolution of the ocean. For all these applications, a prediction of the rate at which oxides dissolve is essential. Therefore, a predictive understanding of the dissolution rate of these materials is critical for their applications.
Prediction of the dissolution rate of a material requires a quantitative understanding of the correlations between the environment and the properties of the material. The environment is defined by variables including temperature, pressure, and solution chemistry. The properties refer to those related to chemical durability that are intrinsic to the material and are not affected by environmental variables. Complex interactions between the intrinsic properties and environmental variables make rate prediction challenging. First, depending on the application, the timescale of interest can be as much as millions of years in chemical weathering and nuclear waste disposal, as short as minutes in the cold sintering synthesis of ceramics, or even seconds in the fracturing of the rocks during an active earthquake. This creates a great difficulty in understanding dissolution kinetics because the dissolution rates are not constant and may change over time. The rates are highly dependent on the environmental conditions and the materials themselves, and both of them may change or transform as a function of time. This makes the understanding of the mechanisms critically important. Fundamentally, dissolution reactions of oxides are complex chemical reactions that consist of parallel and sequential elementary reactions, such as solvation, surface complexation, hydrolysis, and detachment of surface-activated complexes. Not all these reactions determine the overall dissolution rate. The rate determining steps are often related to surface complexes, which are often hypothesized and difficult to probe and identify directly. These surface reactions are indirectly related to the crystal bulk properties through the interface. Such an indirect relationship between the dissolution rate and the bulk properties and solution conditions complicates the prediction of dissolution kinetics. In addition, there are many parameters to be considered, including those intrinsic to the material, such as the structure and composition, the presence of defects and impurities, radiation damage, and the microstructure, and those environmental controlling variables, such as temperature, pressure, pH, redox potential, and composition of the solution. These challenges create great opportunities for interdisciplinary research where fundamental principles would be used to build predictive models to understand oxide dissolutions for various applications with focuses on different time and length scales.
In addition to those challenges that are common to all oxides, different applications add their specific complexities. For instance, for nuclear waste development, the waste elements to be immobilized span the whole periodic table and include alkali and alkaline earth elements, halogens, transition metals, rare earth elements, and actinides [Reference Frankel, Vienna, Lian, Scully, Gin, Ryan, Wang, Kim, Windl and Du1]. Great efforts have been made to incorporate as many waste elements as possible into one waste form for simplicity and cost-effectiveness using materials such as borosilicate glass, concrete and cement composites, titanate-based ceramics, and phosphate-based ceramics, to name a few [Reference Ewing and Wang2]. This leads to a unique challenge in understanding the dissolution of the resulting waste forms in the environment. Because each group of elements has unique and dramatically different chemistry, they react with water differently. Some elements are highly soluble in water, and others are insoluble, which leads to complex dissolution behavior for multiple metal oxides. In addition, because nuclear waste forms need to be isolated from the environment for hundreds of thousands of years, prediction of the long-term dissolution rate requires an understanding of the mechanisms of all critical rate-determining reactions. Thermodynamic equilibrium and kinetic theories of dissolution reactions can provide the foundation for predicting long-term chemical durability in the environment.
The purpose of this review is to selectively summarize some thermodynamic equilibrium and kinetics theories that are useful for a predictive understanding of the dissolution of oxides in aqueous environments. These theories have been developed and used in the past decades for understanding dissolution behavior and modeling experimental and field observations. Some applications of the theories are highlighted using examples from a number of fields with specific applications. In this review, the chemical durability of a material is characterized by a number of properties including its solubility, dissolution rate constant at far-from-equilibrium, how the dissolution rate changes with the saturation conditions, and the effects of pH and temperature. Examples and discussions are more weighted toward complex oxides with multiple metals having significant different chemical bondings such as metal oxide silicates. These complex materials are not only intriguing in terms of the dissolution mechanism but also have practical applications. Challenges and opportunities for a predictive understanding of dissolution kinetics are discussed within the current literature. There are a number of previous reviews in the literature that are valuable for understanding oxide dissolution [Reference Frankel, Vienna, Lian, Scully, Gin, Ryan, Wang, Kim, Windl and Du1, Reference Berner3, Reference Aagaard and Helgeson4, Reference W. and Wieland5, Reference Stumm and Wollast6, Reference White, Clark and Zoitos7, Reference Lasaga8, Reference Brantley9, Reference Schott, Pokrovsky and Oelkers10]. The present review is intended to be complementary to those previous ones and in a more compact style. A comprehensive review is not intended. Topics not covered in this review include dissolutions involving redox reactions, dissolutions under an external field, dissolutions in a confined space, and dissolutions promoted by organic ligands and bioactivities, which deserve their own separate reviews.
Effect of the composition of oxides on chemical durability
The chemical durability of oxides can be qualitatively understood from the properties of the constituent elements. Because elements belonging to the same group in the periodic table have similar chemical reactivities, the chemical durability and speciation in aqueous solutions can be understood from well-studied elements in the same group. For instance, halogen ions such as chloride and iodide occupy a large area in the Eh-pH diagram under conditions that commonly occur in natural environments. They do not react strongly with many common aqueous species and rocks in the environment. Therefore, they are highly soluble and mobile. Rare earth elements often form trivalent cations with a relatively strong covalent bonding character in oxides, which makes them relatively less soluble in aqueous solutions than alkali and alkaline earth oxides. The bonding character in oxides can be qualitatively estimated using the basic properties of the element, such as the electronegativity and formal charge. Elements that tend to form a strong covalent bond with oxygen often form oxyanions as a structural rigid unit in oxide or aqueous solutions. Oxyanions with a high nominal charge, such as [BO45−], [AlO45−], [SiO44−], and [PO43−], often participate in the structural network of oxides. Oxyanions with a low nominal charge, such as [ClO41−], [TcO41−], [IO31−], [SeO42−], [SO42−], and [CrO42−], are often not structurally compatible with the structural network of the highly charged oxyanions in oxides, and thus tend to form ionic units in the oxide and are highly soluble in aqueous solutions. For instance, in boroaluminosilicate glass, [BO45−], [AlO45−], and [SiO44−] oxyanions participate in the network structure of the glass with network-modifier cations to balance the charge. Oxyanions such as [SO42−] do not participate in the framework and have low solubility in the glass. For crystalline aluminosilicates such as zeolite, low charge oxyanions can only be incorporated into the cages of the structure, which are not part of the network structure.
For redox-sensitive elements, their properties, such as solubility in oxides and aqueous solution, are strongly affected by their oxidation state, which is controlled by the oxygen fugacity during the synthesis of the oxide and the redox potential in the aqueous solution respectively. For instance, the solubility of ferrous iron in solution is greatly reduced as a result of an increase in the oxidation state from Fe2+ to Fe3+. Oxides of Tc7+ are highly soluble in aqueous solutions, whereas oxides of Tc4+ are more durable with a much lower solubility. Oxidizing Cr3+ to Cr6+ changes its speciation in solution from Cr3+ or Cr(OH)30 to HCrO41− or CrO42−, which dramatically increases its solubility in oxidized aqueous solutions. Similarly, oxidizing U4+ to U6+ changes the speciation of U4+ or U(OH)40 to UO22+ or UO2(OH)20, which significantly increases the solubility of uranium in aqueous solutions. Oxidation of Se4+ to Se6+ has a similar effect on the solubility in aqueous solution. Because of the significant change of the solubility in aqueous solutions as a result of changes in the oxidation state, the redox potential becomes an important environmental variable that affects the dissolution rate of oxides with redox-sensitive elements. Dissolutions of these materials have been reviewed elsewhere [Reference Gorichev and Kipriyanov11, Reference Blesa12] and highlighted in a number of studies [Reference Suter, Banwart and Stumm13, Reference Stone14, Reference Zinder, Furrer and Stumm15, Reference Wang, Lee, Kapoor, Tebo and Giammar16, Reference White, Peterson and Hochella17]. Taking advantage of the solubility changes, chemical reducing agents and reduced geological formations have been used as remediation strategies to control the transport of some containments in the environment [Reference Richard and Bourg18, Reference Dhal, Thatoi, Das and Pandey19, Reference Kuppusamy, Palanisami, Megharaj, Venkateswarlu, Naidu and de Voogt20, Reference James21]. On the other hand, redox reaction–induced dissolution can cause contaminations such as arsenic in the environment [Reference Nickson, McArthur, Burgess, Ahmed, Ravenscroft and Rahmanñ22, Reference Oremland and Stolz23].
The ionic potential of an element, a property derived from the formal charge and ionic radius [Reference Shannon24], is defined as z/r, where z is the formal charge and r is the ionic radius. The ionic potential has been used to understand the reactivity of ions in oxides and aqueous solutions [Reference Cartledge25, Reference Cartledge26, Reference Goldschmidt27]. A higher ionic potential of an ion results in more covalent bonding to oxygen in the oxide; stronger interactions with water, aqueous species, and surfaces; and a lower oxide dissolution rate. Thus, the ionic potential of elements has been generally used to understand the reactivity of aqueous species, the solubility of oxides in aqueous solutions, and the dissolution rate for a range of oxides. For highly ionic systems, the ionic potential has been used to quantitatively understand the chemical reactivity of oxides and aqueous species such as the water-ligand exchange of metal solvation complexes [Reference Chorover, Brusseau, Brantley, Kubicki and White28]. For more covalent systems, the ionic potential has been used as a qualitative indicator because other factors such as molecular orbital interactions play a role as well. For instance, ferric iron (Fe3+) oxides have a much lower solubility than ferrous iron (Fe2+) at a given pH and redox potential as a result of the higher ionic potential of ferric iron. For apatite, experimental results show that the dissolution rate of natural apatite (Ca10(PO4)6F2) is approximately 3 orders of magnitude lower than that of synthetic iodoapatite (Pb10(VO4)6I2) with the same structure at a given temperature and pH. The activation energy for the dissolution of natural apatite is more than 2 times that of iodoapatite [Reference Zhang, Heath, Valsaraj, Ebert, Yao, Lian and Wang29, Reference Zhang, Gustin, Xie, Lian, Valsaraj and Wang30, Reference Zhang, Ebert, Yao, Lian, Valsaraj and Wang31]. The higher ionic potentials of the constituent elements in natural apatite lead to shorter bond distances and stronger chemical bonding with respect to iodoapatite, which result in a higher activation energy and lower dissolution rate for fluorapatite than iodoapatite [Reference Zhang, Ebert, Yao, Lian, Valsaraj and Wang31]. For borosilicate glass, the network structure is mainly composed of high nominal charge oxyanions such as [SiO44−], [BO33−], [BO45−], and [AlO45−]. Low ionic potential anions such as I− and Cl−, as well as low nominal charge oxyanion units such as [IO31−], [TcO41−], [ClO41−], [MoO42−], [CrO42−], and [SO42−], are incompatible with the network structure of borosilicate glass, leading to their low solubility in glass [Reference Gin, Jollivet, Tribet, Peuget and Schuller32].
Effect of the structure of oxides on chemical durability
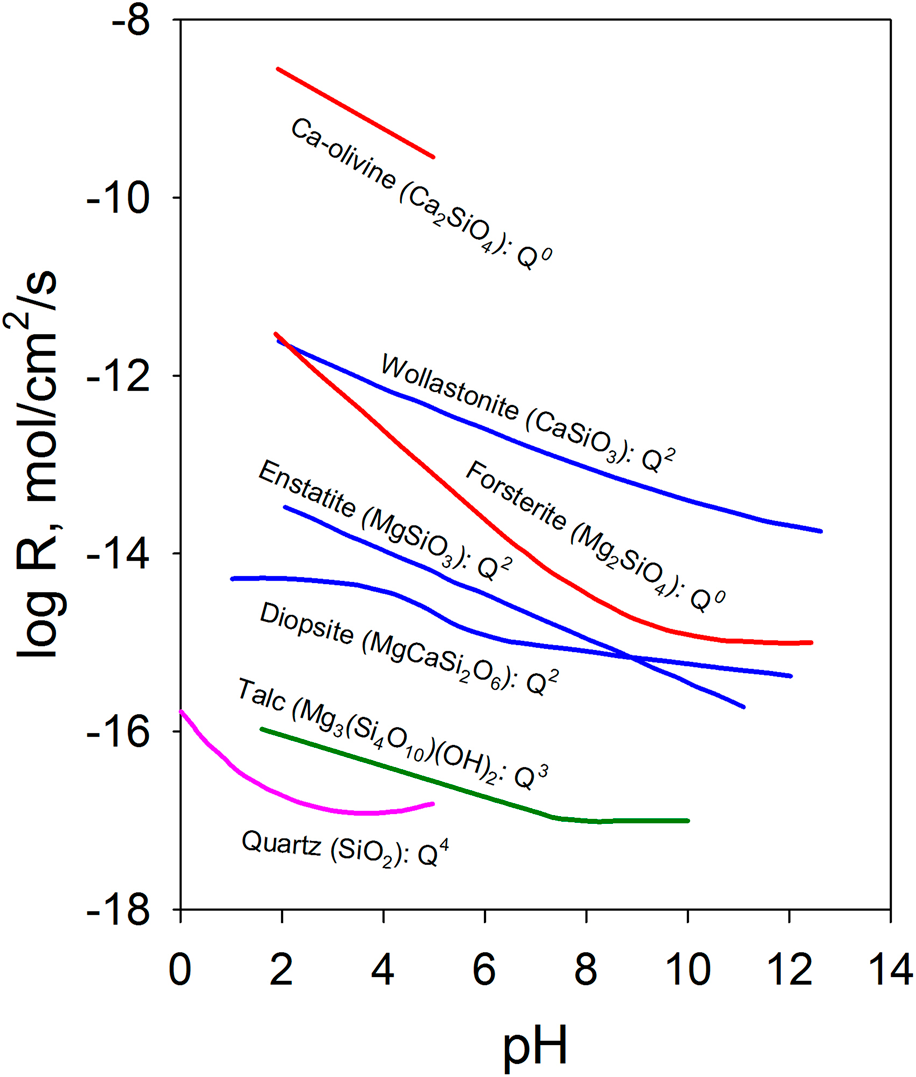
The chemical durability of oxides can also be qualitatively understood based on their structure. One of the important structural characteristics that affect durability is the connectivity of the covalently bonded units in multiple-metal oxides. In silicates, the extended structure of the [SiO4] tetrahedral network has an important effect on the chemical durability. The dissolution rate decreases as the connectedness of the [SiO4] tetrahedral units increases [Reference Brantley9, Reference Schott, Pokrovsky and Oelkers10]. As shown in Fig. 1, nesosilicates (orthosilicates) such as Ca-olivine (Ca2SiO4) with isolated silicate tetrahedrons [i.e., each (SiO4) tetrahedron has a central silicon atom surrounded by four oxygen atoms at the corners that do not share with any other (SiO4) tetrahedron] have the highest dissolution rate among different groups of silicate minerals. With the same crystal structure, the effect of the composition is highlighted by forsterite (Mg2SiO4), which has a dissolution rate over 3 orders of magnitude lower over a range of pH values than Ca-olivine. The ionic potential of Mg2+ is ∼26% higher than that of Ca2+ ions [Reference Brantley9, Reference Schott, Pokrovsky and Oelkers10]. Inosilicates such as wollastonite (CaSiO3), enstatite (MgSiO3), and diopside (MgCaSi2O6) are single chain silicates with interlocking chains of silicate tetrahedrons and have a much lower dissolution rate, for example, ∼3 orders of magnitude lower for CaSiO3 than Ca2SiO4. Minerals such as chrysotile (Mg3(Si2O5)(OH)4) and talc (Mg3(Si4O10)(OH)2) are phyllosilicates [i.e., sheet silicates in which (SiO4) tetrahedrons form two-dimensional sheets] with even lower dissolution rates. Tectosilicates [i.e., (SiO4) tetrahedrons in a three-dimensional framework structure], such as quartz and feldspar, are among the minerals with the lowest dissolution rates. The connectivity of [SiO4] tetrahedrons increases from nesosilicate, sorosilicate, inosilicate, and phyllosilicate to tectosilicate with the crystal structures characterized by Q0, Q1, Q2, Q3, and Q4 units, respectively [Reference Schott, Pokrovsky, Spalla, Devreux, Gloter and Mielczarski33]. The notation Qn (n = 0–4) refers to the connectivity of the [SiO4] unit in silicate, and n represents the number of SiO4 units connected to a given silicon atom through the shared oxygen (bridging oxygen). The increased connectivity limits the pathways for the [SiO4] units to detach from the network structure and decreases the dissolution rate.
Dissolution rate of Ca/Mg silicates at 25 °C as a function of pH (enstatite at 70 °C) and the connectivity of [SiO4] tetrahedrons. Data are from Ref. Reference Schott, Pokrovsky and Oelkers10 and the references therein. The rate is the forward rate.
For noncrystalline solids such as glass, following the same concept for silicate tetrahedral connectivity, a topological constraint theory was developed to understand the chemical durability and other properties of the materials [Reference Phillips34, Reference Thorpe35, Reference Mauro36, Reference Smedskjaer, Mauro, Youngman, Hogue, Potuzak and Yue37]. Used as a quantitative description of the structure (structural descriptor), the topological constraint per atom (n c) is defined as follows:
 $${n_{\rm{c}}} = {{\left\langle r \right\rangle } / 2} + \left( {2\left\langle r \right\rangle - 3} \right)\quad ,$$
where 〈r〉 is the average coordination number. The first term describes the rigid bond constraints, and the second term describes the angular constraints [Reference Mauro36]. Although the theory was developed to understand the rigidity of the structure and the physical properties of glasses, the theory has also been used to understand the dissolution kinetics of glasses. As n c increases, the activation energy of the dissolution reaction increases linearly for a number of silicate crystalline phases and glasses [Reference Pignatelli, Kumar, Bauchy and Sant38, Reference Mascaraque, Bauchy and Smedskjaer39]. The number of constraints describes the structural connectiveness and serves as an effective activation energy indicator, which arises from steric effects that prevent the network from reorganizing locally to form an activated surface complex that detaches during dissolution.
The metal–oxygen bond strength, a derived property from the composition, can be related to the bond dissociation in oxides. The parameter has been used to understand the surface reactions of oxides [Reference Armentrout, Halle and Beauchamp40, Reference Johnson and Pepper41, Reference Rethwisch and Dumesic42, Reference Wieland, Wehrli and Stumm43, Reference Velbel44, Reference Oelkers45]. As the bond strength increases, the solubility and dissolution rate decrease [Reference Velbel44]. Different from the concept of metal–oxygen bond strength and also less quantitative, the bond valence method (not to be mistaken for the valence bond theory in quantum chemistry) was developed, which is based on Pauling's coordination chemistry rules. The method was originally used in coordination chemistry for validating a proposed chemical structure and the oxidation states of atoms but can be used to understand the properties of a given structure. The bond valence rule stipulates that the valence V of an atom equals the sum of the individual bond valence v i surrounding the atom:  $V = \sum {{v_i}}$, and v i = exp((R o − R i)/b), where R i is the observed bond length, R o is the ideal bond length when the element i has an exact valence of 1, and b is an empirical constant, typically 0.37 Å [Reference Brown46]. A deviation of the bond valence sum from the atomic valence needs to be accounted for, and such a deviation is often associated with bond length and coordination distortion. Bond valence method has been applied for predicting the bonding geometry (e.g., bond length and coordination number) and oxidation state of atoms of crystals and the surfaces of oxides, which can be used to understand the surface reactivity and dissolution mechanism of oxides in aqueous solutions. As the bond valence sum deviates from the valence, the stability of the structure decreases, and the solubility and dissolution rate increase. The bond valence method is simple to use for constructing plausible structures, given only the composition. However, it is restricted to compounds with localized bonds. It does not, in general, apply to metals and compounds where the electrons are delocalized.
Quite often, bond strength and structural features are combined to formulate a structural descriptor to describe the structure and composition. For instance, fnet, which combines local structure characteristics and single bond strength, is defined as,
 $${F_{{\rm{net}}}} = {1 / N}\sum\limits_{\rm{X}}^{{\rm{cations}}} {{n_x}} \cdot {\rm{C}}{{\rm{N}}_{{\rm{XO}}}} \cdot {\rm{SB}}{{\rm{S}}_{{\rm{XO}}}} \cdot {m_{\rm{X}}}\quad ,$$
where N is the total number of atoms, n x is the number of atoms of the X species, CNXO is the average coordination number of X–O pairs, SBSXO is the single-bond strength or energy (kcal/mol) [Reference Sun47], and m X is a factor to account for the contribution of each cation to the overall network strength [Reference Lusvardi, Malavasi, Tarsitano, Menabue, Menziani and Pedone48]. Fnet can be used to quantitatively understand the structure–property relationships of glass materials, including the overall strength of the glass network and the dissolution of borosilicate glasses [Reference Lusvardi, Malavasi, Tarsitano, Menabue, Menziani and Pedone48, Reference Lu, Deng, Gin and Du49].
Defects in oxides are structural and compositional features and have a strong impact on their chemical durability. Structural and compositional defects in crystalline materials are well defined and have been studied extensively [Reference Bollmann50]. For glassy materials, because of the lack of long-range order [Reference Scholze51], the concept of defects for glasses cannot be simply defined in the same way as for crystalline materials. To apply the concept of point, linear, and planar defects of crystals, glassy materials present 3-dimensional long-range defects that extend throughout the material. Such a lack of long-range order may be quantified by the degree of disorder, but distinctions between what would be considered a regular structural character in glasses and a genuine defect in crystals may not exist. Nonetheless, at short and intermediate ranges, order does exist in glasses [Reference Greaves and Sen52, Reference Martin, Goettler, Fossé and Iton53]. Some defect types in glasses at the range where order does occur are expected to be similarly defined as in crystals, but it is challenging to quantify them. As a result, the effects of defects on the properties of oxides are mostly only applied to materials with long-range order in at least one dimension. Structural defects such as dislocations in crystalline materials are common defects that occur during formation or synthesis processes and can also arise from radiation damage or stress. Defects of any kind increase the enthalpy of formation of a material. The entropic contribution of defects to the total free energy is often relatively low for simple oxides at low temperatures. As a result, defects increase the free energy of formation, which in turn increases the solubility of the material. Compared with a material of the same composition without defects, the solubility of a material with defects increases by a factor of  ${e^{{{\Delta G_{\rm{f}}^{\rm{d}}} / {RT}}}}$, where $\Delta G_{\rm{f}}^{\rm{d}},\;R,\;{\rm{and}}\;T$ are the excess free energy (i.e., free-energy difference between the material with and without defects), gas constant, and temperature, respectively. The dissolution rate can also increase because of the reduced activation barrier for dissolution as a result of the increased number of defects in the materials, which has been demonstrated in a number of experiments [Reference Burt and Mitchell54, Reference Guo, Robinson and Herrera55, Reference Lasaga and Luttge56, Reference Schott, Brantley, Crerar, Guy, Borcsik and Willaime57, Reference MacInnis and Brantley58, Reference Blum, Yund and Lasaga59, Reference Clark, Ihli, Schenk, Kim, Kulak, Campbell, Nisbet, Meldrum and Robinson60, Reference He, Cao and Duan61, Reference Corkhill, Bailey, Tocino, Stennett, Miller, Provis, Travis and Hyatt62]. Defects induced by irradiation in materials have similar effects on the solubility and dissolution kinetics [Reference Popel, Wietsma, Engelhard, Lea, Qafoku, Grygiel, Monnet, Ilton, Bowden and Farnan63, Reference Begg, Hess, Weber, Devanathan, Icenhower, Thevuthasan and McGrail64, Reference Maeda, Fukami, Kondo, Kitada, Murase and Hinoki65, Reference Kondo, Mouri, Hyodo, Hinoki and Kano66]. However, initial enhancement in dissolution may diminish as the defects induced by irradiation are exhausted if the damage mostly occurs near the surface region [Reference Popel, Wietsma, Engelhard, Lea, Qafoku, Grygiel, Monnet, Ilton, Bowden and Farnan63]. When the dominant process in a dissolution is controlled by defects, unique dissolution mechanisms associated with the type of defect may develop, and the resulting dissolution kinetics can be significantly deviated from the dissolution kinetics of materials without defects. This is because the energetics of the dissolution reaction at the defect sites are modified by the defects. For instance, dislocation defects are common linear defects in crystals that induce a strain energy in crystals and often cause etch pit formation. Dissolution rates of materials with dislocation defects have been explained by a stepwave dissolution mechanism, and the rate becomes nonlinear as the dissolution condition approaches equilibrium conditions (more discussion in section “Dissolution rate as the solution approaches saturation”) [Reference Lasaga and Luttge56]. Grain and phase boundaries in ceramics and rocks are another source of defects and become important in dissolutions as the grain size decreases below the submicrometer scale. The excess free energy from the interfacial energy is expected to enhance the grain boundary dissolution as a number of experiments have suggested [Reference Beaunier67, Reference Liu, Shao, Cragnolino and Macdonald68, Reference Podor, Le Goff, Cordara, Odorico, Favrichon, Claparede, Szenknect and Dacheux69, Reference Klemm, Gomez-Florit, Carvalho, Wachendörfer, Gomes, Haugen and Tiainen70]. Dissolution at the boundaries may penetrate to a great depth assisted by the enhanced dissolution kinetics if the transport of reactive species within gain boundaries is not the rate-determining step. Because of the finite thickness of grain boundaries, dissolution at the boundaries may be time dependent as the reactive boundaries may be exhausted over time.
Linear free-energy relationships between different types of reactions
Chemical reactions of different kinds involving the same species are intimately connected by the intrinsic properties of the species. This is evident for many types of reactions, including solvation, substitution, ligand exchange, adsorption, and dissolution reactions. Linear free-energy relationships (LFERs) have been established with attempts to develop quantitative relationships between the structure and reactivity for different types of aqueous and mixed-solvent organic reactions. In addition, reaction rates and equilibrium constants are related for a group of closely related reactions [Reference Grunwald and Winstein71, Reference Hammett72, Reference Swain and Scott73]. One of these relationships is the Hammett equation, which was developed to predict the equilibrium constant or reaction rate constant of a substitution reaction in solution:
 $${\rm{log}}{K \over {{K_{\rm{o}}}}} = \sigma \cdot \rho \quad ,$$
where K o(or k o) and K(or k) are equilibrium constants (or reaction rate constant) for the reference and substituted reactions, respectively [Reference Hammett72]. The σ and ρ are characteristic constants related to the substitute and type of reaction, respectively. Similarly, the rate constant k 1 of one series of reactions (e.g., water exchange) is related to the rate constant k 2 of another similar series (e.g., adsorption or dissolution) by:
 $$\log {k_1} = a \cdot \log {k_2} + b\quad ,$$
where a and b are constants. Establishing free-energy relationships helps in understanding the reaction mechanism for a chemical reaction and allows for prediction of the reaction rates and equilibrium constants for less well-known and closely related reactions from well-studied reference reactions. This is especially valuable because complex reactions such as dissolutions involving interfacial reactions are challenging to investigate and probe directly, whereas some related simple reactions may already be well documented.
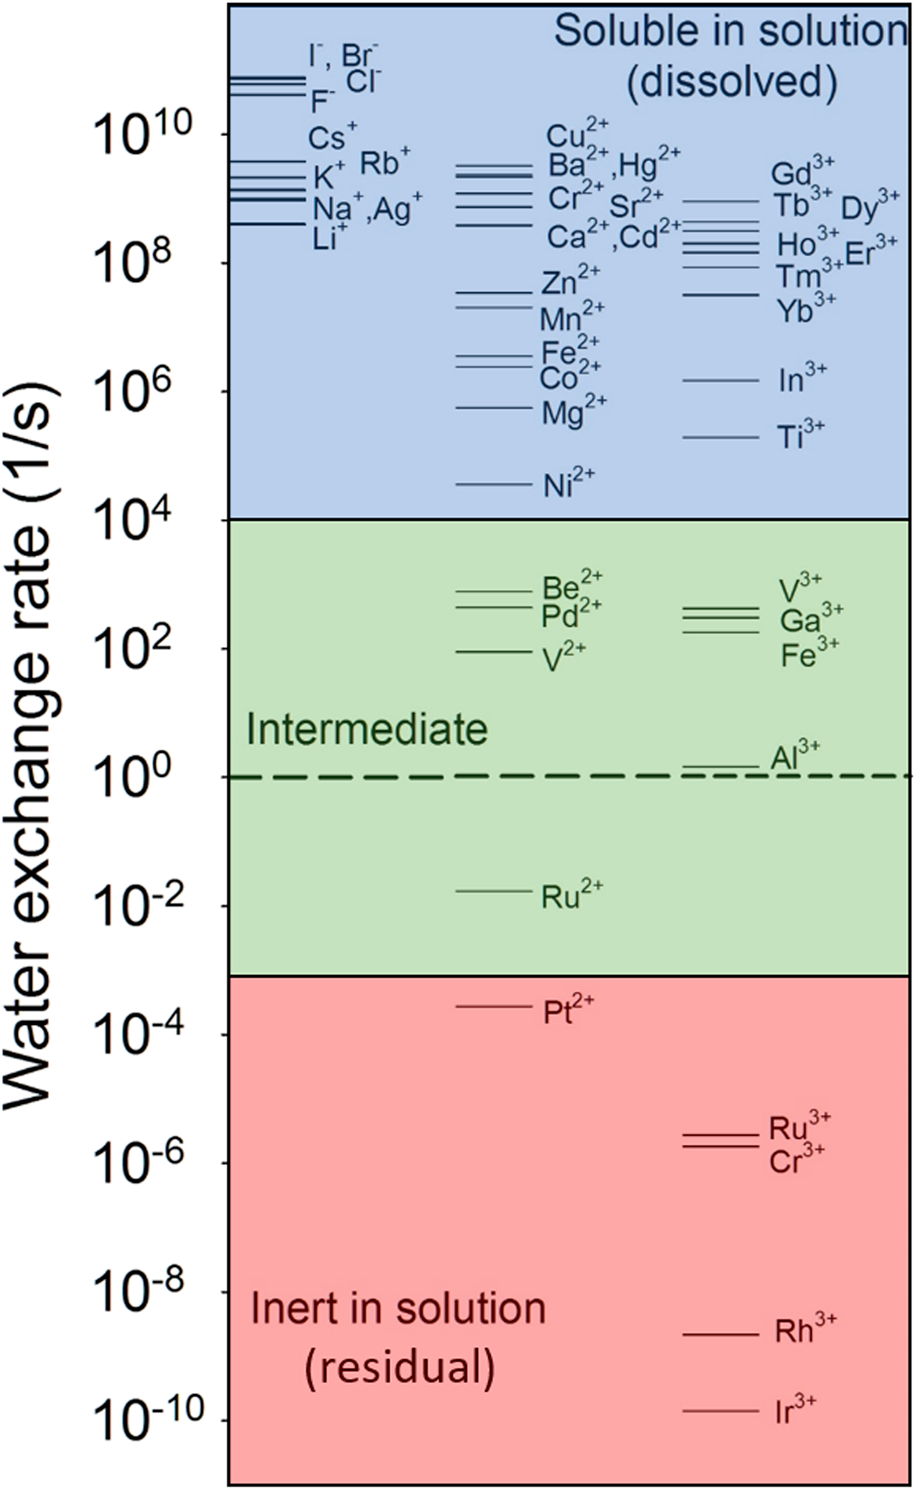
For instance, the water-exchange reaction, that is, the exchange of a water molecule bound to an ion with another water molecule in bulk solution, is a simple reaction involving ions in an aqueous solution. The reaction kinetics have been well documented for a variety of aqueous ions in the literature [Reference Rotzinger74, Reference Rotzinger75, Reference Richens76, Reference Helm and Merbach77, Reference Lincoln78]. As shown in Fig. 2, the water-exchange rate varies by over 20 orders of magnitude from very fast exchange (e.g., ∼ one exchange in 10 ps for I−) to very slow (e.g., ∼ one exchange in over 200 years for Ir3+). Based on the linear free-energy relationship, the rates of dissolution reactions of oxides and adsorption reactions should be linearly correlated to the rate of the closely related reactions—water-exchange reaction. Indeed, oxides consisting of ions with fast water-exchange rates, such as alkali and alkaline earth oxides, and some transition metal and rare earth oxides have higher dissolution rates than oxides with low water-exchange rates. Experimental observations have demonstrated a linear relationship between the metal cation adsorption reaction on a substrate and the water-exchange reaction [Fig. 3(a)] and between the dissolution reaction and the water-exchange reaction [Fig. 3(b)] [Reference Wehrli79, Reference Casey80, Reference Pokrovsky and Schott81, Reference Casey and Swaddle82]. By extending the relationship to all aqueous ions, they (Fig. 2) can be grouped into three categories: mobile ions with fast water exchange ( ${k_{{{\rm{H}}_{\rm{2}}}{\rm{O}}}}$ > 10+4 s−1), intermediate (10+4 s−1 ≥ ${k_{{{\rm{H}}_{\rm{2}}}{\rm{O}}}}$ > 10−3 s−1), and inert ions with slow water exchange ( ${k_{{{\rm{H}}_{\rm{2}}}{\rm{O}}}}$ ≤ 10−3 s−1). The corresponding oxides can then be regarded as soluble, intermediate, and insoluble (inert) in water. For multiple cation oxides, the insoluble components may become residuals after soluble components are dissolved in solution.
Water-exchange rate constant for a particular water molecule in the first coordination sphere of aqueous ion [M(H2O)n]m+. Data are from Ref. Reference Lincoln78. The dashed line refers to the exchange rate of 1 s−1.
Rate of metal cation adsorption on γ-Al2O3 (a), and the rate of dissolution at 25 °C and pH = 2 of metal oxide MO having a rock-salt structure (b) as a function of the rate constant of water exchange of the corresponding metal cation in solution. Data for (a) and (b) are from Refs. Reference Wehrli79 and Reference Casey80, respectively.

The water-exchange rate of an aqueous ion is mainly controlled by the strength of the interactions between the ion and water. A linear correlation was established between the water-exchange rate and the ionic potential for a number of aqueous ions [Reference Chorover, Brusseau, Brantley, Kubicki and White28]. If such a linear correlation can be extended to a broad range of aqueous ions, the ionic potential can then be used to predict the dissolution rates of the oxides of these ions. Figure 4 plots the water-exchange rate as a function of ionic potential for all the aqueous ions in Fig. 2. The data fall into two groups: the cations following a straight line with a slope similar to that previously proposed for a number of divalent and trivalent cations [Reference Chorover, Brusseau, Brantley, Kubicki and White28] and those cations following a steeper line. If the linear relationship for the first group remains, projections can be made for a broad range of cations, including hypothetical aqueous ions in the form of [M(H2O)n]z+ with high z values. As shown in Fig. 4, the water-exchange rates of Ti4+, Zr4+, and Si4+ aqueous ions with coordination numbers of IV and VI are predicted to be orders of magnitude lower than those of alkali, alkaline earth, and rare earth cations. The predicted result is consistent with the very low solubility and dissolution rates of Ti4+, Zr4+, and Si4+ oxides. The aqueous ions in the second group are open-shell transition metal cations. In addition to the ionic interaction between the ion and water, a strong ligand–field interaction is expected between the electron d orbitals and the water molecule [Reference Griffith and Orgel83, Reference Jørgensen84], which slows down the exchange reaction and leads to a different relationship with the ionic potential [Reference Rotzinger75].
Water-exchange rate constant of aqueous ions as a function of ionic potential. Circles are data from observations, and crossed circles are projected from the linear regression. The roman numbers in parentheses are the coordination number. Dashed thick lines are regression lines. The dashed horizontal line refers to the water exchange rate of 1/s.

Dissolution kinetics from thermodynamic equilibrium properties
Thermodynamic equilibrium properties, such as the solubility of oxides and the formation free energies of oxides and dissolved aqueous species, are well documented in the literature. If a direct relation between the dissolution kinetics and thermodynamic properties can be made, the kinetics can then be predicted based on the equilibrium properties. However, dissolution reactions are often a complex process involving a number of parallel and sequential elementary reactions overall. Based on the formulation that combines the transition state theory (TST) and surface complexation model (SCM) (more discussion in section “TST and SCM”), the surface reaction involving the activated complex is rate limiting. Because, under a given thermodynamic condition, the dissolution kinetics of an oxide are defined only by the structure and composition; thus, a link between the dissolution rate and the thermodynamic properties of oxides and their dissolved species is expected to exist.
For a group of materials with the same crystal structure, a linear free-energy relationship has been established, which relates the dissolution rate with the properties of bulk materials and the thermodynamic equilibrium properties of the dissolved aqueous ions [Reference Sverjensky and Molling85, Reference Sverjensky86]. For a crystalline phase with the chemical formula of M2X, M refers to the substitutive cation and X is fixed and represents the rest of the structure. The substitution at the crystallographic site M changes the thermodynamic properties of the phase. For instance, for M2SiO4 with an olivine structure, [SiO4] = X, M can be substituted by divalent cations such as Mg2+, Ca2+, and Ni2+. For such a system, a linear free-energy relationship was derived to correlate the free energy of the oxide formation and the properties of the dissolved species [Reference Sverjensky and Molling85]. The relationship has been applied to a number of other oxides [Reference Ragavan and Adams87, Reference Xu and Wang88, Reference Xu and Wang89, Reference Xu, Wang and Barton90]. Furthermore, the free energy of formation of the surface-activated complex  $\left( {\Delta G_{\rm{f}}^\# } \right)$ is related to the radius-corrected Gibbs free energy of formation $\left( {\Delta G_{{\rm{f'}},{{\rm{M}}^{2 + }}}^{\rm{o}}} \right)$ of an aqueous M2+ cation and the ionic radius $\left( {{r_{{{\rm{M}}^{2 + }}}}} \right)$ of the M2+ cation [Reference Sverjensky86]:
 $$\Delta G_{\rm{f}}^\# = {a^\# } \cdot \Delta G_{{\rm{f'}},{{\rm{M}}^{2 + }}}^{\rm{o}} + {b^\# } + {\beta ^\# } \cdot {r_{{{\rm{M}}^{2 + }}}}\quad ,$$
where  $\Delta G_{{\rm{f'}},{{\rm{M}}^{2 + }}}^{\rm{o}} = \Delta G_{{\rm{f}},{{\rm{M}}^{{\rm{2 + }}}}}^{\rm{o}} - \Delta G_{{\rm{s}},{{\rm{M}}^{2 + }}}^{\rm{o}}$, and a #, b #, and β# are constants, $\Delta G_{{\rm{f}},{{\rm{M}}^{2 + }}}^{\rm{o}}$ is the Gibbs free energy of formation of aqueous M2+, and $\Delta G_{{\rm{s}},{{\rm{M}}^{2 + }}}^{\rm{o}}$ is the free energy of solvation of aqueous M2+. By linking the free energy of formation of the surface-activated complex $\left( {\Delta G_{\rm{f}}^\# } \right)$ to the dissolution rate (r), $\Delta G_{\rm{f}}^\# = \Delta G_{\rm{r}}^\# + \Delta G_{\rm{f}}^{\rm{o}} + n\Delta G_{{\rm{f}},{{\rm{H}}^ + }}^{\rm{o}}$ and $\Delta G_{\rm{r}}^\# = - RT\;\ln \left( r \right)$, a linear free-energy relationship was derived:
 $$RT\;\ln \left( r \right) = a \cdot \Delta G_{{\rm{f'}},{{\rm{M}}^{2 + }}}^{\rm{o}} + b + \beta \cdot {r_{{{\rm{M}}^{2 + }}}}\quad ,$$
The is the empirical effective free energy of reaction forming a surface complex, is the free energy of the formation of M2X, is a constant, and is apparent free energy of formation of hydrogen ion. It is assumed that the formation of the surface complex involves only the addition of H+ ions to the surface of the solid. There, the dissolution rate is related to the ionic radius of the substitution cation and the free energy of formation, and solvation of the cation. As shown in Fig. 5, the linear free-energy relationship [Eq. (5)] is demonstrated for MO with a rock salt structure and M2SiO4 with an olivine structure, where M represents divalent cations [Reference Sverjensky86].
A graphic representation of Eq. (5) rearranged to  $\Delta G_{\rm{f}}^\# - {\beta ^\# } \cdot {r_{{{\rm{M}}^{2 + }}}} = {a^\# } \cdot \Delta G_{{\rm{f'}},{{\rm{M}}^{2 + }}}^{\rm{o}} + {b^\# }$. Effective free energy for the formation of surface complexes on metal oxides with rock salt structures (a) and orthosilicates with olivine structures (b). The symbols are calculated from experimental data. The dashed lines are regression lines. Adapted from Ref. Reference Sverjensky86.

The above examples demonstrate that the linear free-energy relationship is able to relate the dissolution reaction rate of an oxide to the thermodynamic equilibrium properties of the constituent cations in the crystal and solution. However, caution should be taken for the generalization of the relationship between the kinetics and thermodynamic equilibrium properties because of the lack of a sound thermodynamic basis. In general, the exact linearity between the logarithm of the rate and the equilibrium properties in many favorable cases can be considered “as the first-order approximation of a complicated function” [Reference Hammett91]. Such a function may involve details of the crystal structural features that control surface reactions and the surface-activated complex at the interface with the aqueous solution. One example of such attempts is a recent study of the pH dependence of the dissolution rate of feldspar on the stoichiometry of feldspar, which used the details of the feldspar crystal structure, such as the connection schemes of the tetrahedral framework and ordering of Al and Si at the tetrahedral sites [Reference Yang, Min, Lococo and Jun92, Reference Yang, Min and Jun93]. If such an approach is applied to different groups of minerals and ceramics, formulations will have to be customized to account for the details of the structure and composition of the individual phases.
TST and SCM
The current formulation of oxide dissolution kinetics in aqueous solutions is based on the TST and the SCM [Reference Schott, Pokrovsky and Oelkers10, Reference Zinder, Furrer and Stumm15, Reference Furrer and Stumm94, Reference Blum and Lasaga95]. The basic idea behind the TST is that, for elementary chemical reactions, there is a quasi-equilibrium between the reactants and the activated complexes, and the statistical kinetic theory can be used to calculate the conversion rate from the activated complexes (the transition state) to the products, which are at the saddle point of the potential energy surface. For a simple reaction in the gas phase, the reaction takes place when molecules collide with enough energy to traverse the energy barrier of the energy surface. For dissolution reactions at surfaces, the TST has been employed to describe the rate-limiting elementary reaction associated with the surface-activated complex (the transition state) [Reference Aagaard and Helgeson4, Reference Lasaga8]. The bulk material and dissolved species in the solution are not explicitly presented in the surface-activated complex. Instead, the SCM is used to describe the equilibrium between the surface speciation and solution chemistry [Reference Westall and Hohl96, Reference Sposito97]. By combining the TST and SCM, the TST–SCM formulation stipulates that there is equilibrium for surface reactions involving the adsorption of dissolved aqueous species from the solution and the ion exchange between the surface and solution, and these reactions lead to surface complexes. The rates of these reactions are relatively fast and are not the rate-determining steps of the overall dissolution reaction. The surface complexes serve as reactive surface precursors that may transform into the surface-activated complex, which is considered the transition state for the detachment of dissolving species. Such a formulation connects two elementary reactions, that is, surface adsorption and detachment, by the concept of a surface complex and reactive precursor. The reactive surface precursors are assumed to be stoichiometrically identical to and will proportionally transform into the surface-activated complex, a transition state in the rate-limiting reaction of the dissolution process [Reference Helgeson, Murphy and Aagaard98, Reference Murphy and Helgeson99]. Therefore, the overall dissolution reaction rate is proportional to the concentration of the surface precursors, which can be quantified using a SCM and solution chemistry. The dissolution rate can then be simplified by identifying the surface reaction that leads to the activated complex and by formulating a rate equation as a function of the activities of different aqueous species in the solution.
The dissolution of single-oxide minerals is the best example to illustrate the effectiveness of the TST–SCM formulation in describing the dissolution kinetics [Reference Zinder, Furrer and Stumm15, Reference Furrer and Stumm94]. The dissolution rate can be described from the sum of the parallel reactions occurring at metal centers with different surface species [Reference Schott, Pokrovsky and Oelkers10]:
 $${r_ + } = \sum\limits_{\rm{L}} {{k_{\rm{L}}}{{\left[ { > {\rm{ML}}} \right]}^{{n_{\rm{L}}}}}} + {k_{{{\rm{H}}_2}{\rm{O}}}}\quad ,$$
where > refers to the surface, [>ML] is the surface complex concentration, L = O, OH, OH2, or other species, and n L is the reaction order of the surface species-promoted dissolution, k L is the rate constant for the corresponding surface complex, and the second term  ${k_{{{\rm{H}}_{\rm{2}}}{\rm{O}}}}$ is the water-promoted dissolution, which becomes dominant when [>ML] is very low, for instance, at a pH near the surface isoelectric point. The reaction order term, n L, can be determined experimentally. The dissolution of brucite (Mg(OH)2) demonstrates the application of the equation Eq. (5) [Reference Pokrovsky and Schott100]. The bulk truncated surface of brucite is terminated by >Mg–OH0, and surface reactions lead to additional surface complexes, including >Mg–O− by deprotonation and >Mg–OH2+ by protonation. The rate-limiting step of the dissolution is the bond breaking of Mg–O, which is enhanced by forming a >MgOH2+ surface complex because the additional proton weakens the Mg–O bond. For parallel reactions, the fastest reaction controls the overall rate. Thus, the dissolution equation is then simplified to
 $${r_ + } = {k_{{\rm{MgOH}}_2^ + }}{\left[ {{\rm{ > MgOH}}_2^ + } \right]^2}\quad .$$
 The exponent originates from the fact that it requires two  ${\rm{ > MgOH}}_2^ +$ surface species to form the surface-activated complex to break an Mg–O bond [Reference Guy and Schott101, Reference Schott and Stumm102, Reference Ludwig and Casey103]. An inspection of brucite crystal structure suggests this interpretation of the reaction mechanism is reasonable. In bulk brucite structure, each Mg is coordinated to 6 OH groups in an octahedral coordination, these octahedrons share edges, and each OH group is bonded to 3 Mg. At the surfaces [Reference Wang, Kalinichev and Kirkpatrick104], if one OH is doubly protonated, a surface complex ${\rm{ > MgOH}}_2^ +$ will form, which weakens the 3 Mg–O bonds equally. Another doubly protonated OH group at a neighboring position would further weaken one of the 3 Mg–O bonds and break it. As shown in Fig. 6, the concentration of the surface complex >MgOH2+ decreases [Fig. 6(a)] with pH, as does the dissolution rate [Fig. 6(b)]. Other surface complexes, such as >Mg–O−, do not promote dissolution as effectively as the >MgOH2+ complex. Similar formulations have been used to explain the dissolution rates of simple oxides, such as quartz [Reference Wollast and Chou105, Reference Hiemstra and Van Riemsdijk106, Reference Berger, Gadore, Schott and Dove107], boehmite and gibbsite [Reference Furrer and Stumm94, Reference Carroll-Webb and Walther108, Reference Bénézeth, Palmer and Wesolowski109], BeO, δ-Al2O3, and ferric oxides [Reference Zinder, Furrer and Stumm15, Reference Furrer and Stumm94].
Brucite (Mg(OH)2 surface speciation (a) and dissolution rate at 20 °C (b) as a function of solution pH. The surface speciation is based on a constant capacitance model with a constant of 5 F/m2, 0.01 mol/L NaCl solution, and using a 2 pK SCM. Diamond symbols (red) in (b) are rates measured close to equilibrium. Adapted from Ref. Reference Pokrovsky and Schott100.

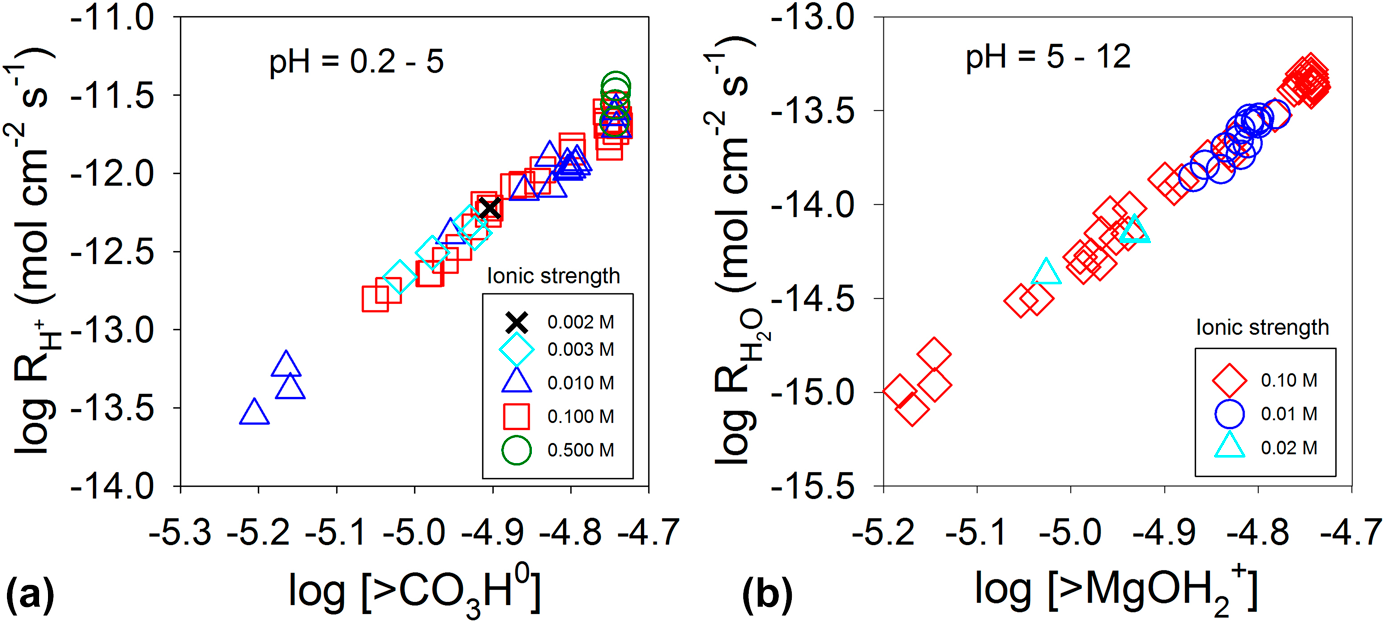
Equation (7) can also be used to explain the dissolution kinetics of carbonates (MCO3, M = divalent metal cation). The surfaces of carbonate minerals in solution are characterized by metal cations and carbonate units interacting with water. Adsorption of protons at carbonate units at acidic pH values and adsorption of water molecules at the metal cations at neutral to basic pH values weaken the M–CO3 bonds, form surface-activated complexes (i.e., >CO3H and >MOH2), and promote dissolution [Reference Wollast110, Reference Plummer, Wigley and Parkhurst111]. The rate equation for these two surface complexes is
 $${r_ + } = {k_{\rm{H}}}{\left[ {{\rm{ > C}}{{\rm{O}}_3}{\rm{H}}} \right]^{{n_{\rm{H}}}}} + {k_{{{\rm{H}}_{\rm{2}}}{\rm{O}}}}{\left[ {{\rm{ > MO}}{{\rm{H}}_2}} \right]^{{n_{{{\rm{H}}_{\rm{2}}}{\rm{O}}}}}}\quad ,$$
where k H and  ${k_{{{\rm{H}}_{\rm{2}}}{\rm{O}}}}$ are the rate constants, and n H and ${n_{{{\rm{H}}_{\rm{2}}}{\rm{O}}}}$ are the reaction order with respect to the protonated carbonate surface complex and water–metal cation complex, respectively. For magnesite (MgCO3), the orders of n H and ${n_{{{\rm{H}}_{\rm{2}}}{\rm{O}}}}$ are 4, as shown in Fig. 7 [Reference Pokrovsky and Schott112]. For calcite (CaCO3), the orders are 2 and 1 for n H and ${n_{{{\rm{H}}_{\rm{2}}}{\rm{O}}}}$, respectively [Reference Pokrovsky and Schott81]. For dolomite (CaMg(CO3)2), the orders of n H and ${n_{{{\rm{H}}_{\rm{2}}}{\rm{O}}}}$ are 2 [Reference Pokrovsky and Schott81, Reference Gautelier, Schott and Oelkers113]. The n H and ${n_{{{\rm{H}}_{\rm{2}}}{\rm{O}}}}$ values depend on the strength of the M–O bond, and a strong bond leads to a higher order [Reference Pokrovsky and Schott81]. The higher reaction orders suggest that breaking a bond between Ca2+ and CO32− requires more than one surface complex working in a concerted manner to promote dissolution.
Magnesite (MgCO3) dissolution rate at 25 °C as a function of >CO3H0 (a) and >MgOH2+ (b) concentrations at the surface. Adapted from Ref. Reference Pokrovsky and Schott112.
For mixed-cation oxides, the rate-limiting steps are often not simply protonation or deprotonation of surface metal cations because the reactivity of each of the multiple cation sites may differ significantly. Because the leaching of highly reactive cations such as alkali, alkaline earth or other cations by ion-exchange with protons leads to protonations of the still-connected [Si/AlO4] tetrahedral network in silicates, the formation of the surface dissolution precursor is controlled by the exchange reaction between metal cations and proton [Reference Schott, Pokrovsky and Oelkers10, Reference Oelkers45, Reference Oelkers, Golubev, Chairat, Pokrovsky and Schott114]:
 $$zn{{\rm{H}}^ + } + > {\rm{M}} – {\rm{O}} = {P^*} + n{{\rm{M}}^{z + }}\quad ,$$
where z is the metal cation charge and n is the number of cations to be removed to create P* (surface precursor complex). Using the law of mass action of the reaction and assuming the total surface site is S, the forward rate is derived as
 $${r_ + } = {k_{{{\rm{P}}^*}}}\left[ {{P^ * }} \right] = {k_{{P^*}}}S\left[ {{{K_{{\rm{eq}}}^{{P^*}}{{\left( {{{a_{{{\rm{H}}^ + }}^z} / {{a_{{{\rm{M}}^{z + }}}}}}} \right)}^n}} \over {1 + K_{{\rm{eq}}}^{{P^*}}{{\left( {{{a_{{{\rm{H}}^ + }}^z} / {{a_{{{\rm{M}}^{z + }}}}}}} \right)}^n}}}} \right]\quad ,$$
where k P* is the forward rate constant, [P∗] is the concentration of the precursor complex,  $K_{{\rm{eq}}}^{{P^*}}$ is the equilibrium constant of the surface complexation reaction, and ${a_{{{\rm{H}}^ + }}}\;{\rm{and}}\;{a_{{{\rm{M}}^{z + }}}}$ are the activities of the proton and metal cation in the solution. This equation leads to the dissolution rate that varies with the activities of the leached cations in the solution. If [>M–O] ≫ [P*], $K_{{\rm{eq}}}^{{P^*}}{\left( {{{a_{{{\rm{H}}^ + }}^z} / {{a_{{{\rm{M}}^{z + }}}}}}} \right)^n} \approx 0$, the rate is reduced to
 $${r_ + } = {k_ + }K_{{\rm{eq}}}^{{P^*}}\left( {{{a_{{{\rm{H}}^ + }}^z} / {{a_{{{\rm{M}}^{z + }}}} \right)^n}}}\quad .$$
 These formulations have adequately described a number of silicate dissolution kinetics, including albite (NaAlSi3O8) [Reference Schott, Pokrovsky and Oelkers10, Reference Brantley and Stillings115, Reference Oelkers, Schott and Devidal116, Reference Knauss and Wolery117, Reference Chou and Wollast118], K-feldspar (KAlSi3O8) [Reference Schott, Pokrovsky and Oelkers10, Reference Gautier, Oelkers and Schott119], kaolinite (Al2Si2O5(OH)4) [Reference Devidal, Schott and Dandurand120], labradorite ((Ca, Na)(Al, Si)4O8) [Reference Carroll and Knauss121], muscovite (KAl2(AlSi3O10)(OH)2) [Reference Oelkers, Schott, Gauthier and Herrero-Roncal122], basaltic, and other natural glasses [Reference Wolff-Boenisch, Gislason, Oelkers and Putnis123, Reference Oelkers and Gislason124]. For example, the dissolution rates of albite, K-feldspar, and kaolinite are accurately described by Eq. (12), where Mz+ = Al3+ and n = 0.33 for albite and K-feldspar [Fig. 8(a)] and n = 1.0 for kaolinite [Fig. 8(b)]. However, for nesosilicate silicates with individual [SiO4] tetrahedra unconnected after completely leaching cations such as Ca and Al (anorthite, CaAl2Si2O8) [Reference Oelkers45] and Mg (forsterite, Mg2SiO4) [Reference Oelkers125], the proton-promoted mechanism [Eq. (7)] still controls the dissolution, which is not affected by the concentration of cations leached into solution [Reference Brantley9, Reference Schott, Pokrovsky and Oelkers10]. The reaction orders, n L,  ${n_{{{\rm{H}}_{\rm{2}}}{\rm{O}}}}$, or n, described in Eqs. (7), (9), (11), and (12), are interpreted as the number of surface complexes needed to break a bond, or the number of removed cations to create a surface complex, which are related to the stoichiometry of the surface reactions. In practice, they are often empirically fitted using experimental data. As a result, fractional orders often occur.
Logarithm dissolution rate of K-feldspar at 150 °C and pH = 9 as a function of Al(OH)4− concentration (a), and kaolinite at 150 °C and pH = 2 as a function of Al3+ concentration (b). Symbols are experimental data. Dashed lines are regression lines. Adapted from Ref. Reference Schott, Pokrovsky and Oelkers10.

Dissolution rate as the solution approaches saturation
The dissolution rate discussed thus far only focuses on the forward rate of the dissolution reaction, and the reverse reaction rate is not considered. In reality, for a reversible reaction, which is the case for many dissolution reactions, the reverse reaction occurs as soon as the dissolved species are present in the solution. The net reaction rate decreases as the dissolved species accumulate and the rate approaches zero when the solution reaches the solubility limit of the solid. With the assumption of TST and the principle of detailed balance, the dissolution rate as a function of the solution saturation is described by [Reference Aagaard and Helgeson4, Reference Brantley9, Reference Schott, Pokrovsky and Oelkers10, Reference Lasaga126]:
 $$\scale 96%{r = {k_ + }\left( {1 - \left( {{Q / K}} \right)} \right) = {k_ + }\left( {1 - {e^{\left( {\Delta {{{G_{\rm{r}}}} / {RT}}} \right)}}} \right) = {k_ + }\left( {1 - {e^{\left( { - {A / {RT}}} \right)}}} \right)\quad ,$$
 $${k_ + } = {k_0} \cdot {\left[ {{{\rm{H}}^ + }} \right]^\eta } \cdot \prod\limits_i {{a_i}^{{v_i}}} \cdot {e^{ - {{{E_{\rm{a}}}} / {RT}}}}\quad ,$$
where k +, Q, K, ΔG r, R, T, and A are the forward rate, activity product, solubility product, Gibbs free energy of the dissolution reaction, gas constant, temperature, and chemical affinity of the reaction, respectively, and k 0, [H+], η, a i, v i, and E a are the forward rate constant, H+ activity, reaction order involving H+, activity of aqueous species i, reaction order involving species i, and activation energy, respectively. Based on the TST–SCM formulation, the surface reaction involving the activated complex is rate limiting. Therefore, the stoichiometry of the overall dissolution reaction may or may not reflect the stoichiometry of the rate-determining reaction that involves the surface-activated complex. The difference between the stoichiometries is factored in Eq. (15) as a constant σ (Temkin's average stoichiometric number) to adjust the Gibbs free-energy driving force for the overall reaction.
 $$r = {k_ + }\left( {1 - {e^{\left( {\Delta {{{G_{\rm{r}}}} / {\sigma RT}}} \right)}}} \right)\quad .$$
The constant σ refers to the relative proportion of destruction of the activated complex with respect to the overall dissolution reaction [Reference Oelkers45]. Although the underlying assumptions of the equation only consider elementary reversible reactions, the overall dissolution reaction is often limited by the elementary reaction involving the surface-activated complex. Therefore, the equation has been widely applied to a diverse range of dissolution reactions of oxide minerals [Reference Brantley9, Reference Schott, Pokrovsky and Oelkers10]. Similar principles and formulations have also been applied to glasses [Reference Oelkers45, Reference Oelkers and Gislason124, Reference Gislason and Oelkers127, Reference Frugier, Gin, Minet, Chave, Bonin, Godon, Lartigue, Jollivet, Ayral and De Windt128].
However, many mineral dissolution behaviors cannot be fit by Eqs. (13) or (15), which are linear in ΔG r. They have an exponential dependence on ΔG r that approaches equilibrium more slowly. Such a modified equation using an empirical approach was often considered useful to describe reactions affected by crystal defects [Reference Brantley9].
 $$r = {k_ + }{\left( {1 - {e^{\left( {\Delta {{{G_{\rm{r}}}} / {\sigma RT}}} \right)}}} \right)^m}\quad ,$$
where m is a constant. This equation has been used to describe the dissolution of kaolinite [Reference Nagy, Blum and Lasaga129], gibbsite (Al(OH)3) [Reference Nagy and Lasaga130], quartz [Reference Berger, Cadore, Schott and Dove131] and other oxide minerals [Reference Brantley9]. The physical meaning of the m value, however, is not well understood, and complex surface phenomena must be involved in dissolution kinetics when m deviates from unity [Reference Brantley9, Reference Dove and Han132]. Cases with m = 1 and m ≠ 1 have both been reported in the literature [Reference Brantley9], which are considered to be either consistent with (m = 1) or not consistent (m ≠ 1) with the TST. Nonetheless, the latter has been interpreted to be related to surface defects playing a role in dissolution.
Using a mechanistic approach, a dissolution stepwave model, a generalized model to account for the effect of surface dislocation defects, was developed to account for a deviation from the TST [Reference Lasaga and Luttge56]. The model emphasizes a critical free energy (ΔG crit) for opening up etch pits that lead to accelerated dissolution. The model is a modification of the existing rate equation [i.e., Eq. (13)] that includes a factor from the contribution of the defects to the dissolution [Reference Lasaga and Luttge56]:
 $$r = {k_ + }\left( {1 - {e^{\left( {{{\Delta {G_{\rm{r}}}} / {RT}}} \right)}}} \right)\tanh \left[ {{B / {f\left( {\Delta {G_{\rm{r}}}} \right)}}} \right]f\left( {\Delta {G_{\rm{r}}}} \right)\quad ,$$
 $$f\left( {\Delta {G_{\rm{r}}}} \right) = \left( {1 - {{1 - {e^{{{\Delta {G_{{\rm{crit}}}}} / {RT}}}}} \over {1 - {e^{{{\Delta {G_{\rm{r}}}} / {RT}}}}}}} \right)\quad ,$$
where B is a constant. The rate equation has been used to explain the dissolution behaviors of albite, gibbsite, labradorite, and smectite [Reference Lasaga and Luttge56], and, more recently, calcite [Reference Bouissonnié, Daval, Marinoni and Ackerer133]. For oxide glasses, due to the lack of long-range order [Reference Scholze51], similar defects may not exist. Although order does exist in glasses at short and intermediate ranges [Reference Greaves and Sen52, Reference Martin, Goettler, Fossé and Iton53], the formulations described above for the associated defects may not be applicable.
Implications of thermodynamic theories and challenges for understanding the chemical durability of oxides
Ionic potential as a guide for nuclear waste development
The development of nuclear waste forms requires the waste elements to be compatible with the host structure and the resulting waste forms to be chemically durable in the environment. These requirements ensure sufficient loading of the waste elements, durable long-term performance, and safety to the environment. Ionic potential (z/r) is a widely used elemental property [Reference Cartledge25, Reference Cartledge26, Reference Goldschmidt27, Reference Isupov134, Reference Railsback135] and can be used to understand the structural compatibility of waste elements with the host structure, such as borosilicate glass, and their chemical durability in aqueous solutions.
As shown in Fig. 9, elements are divided into three regions based on their ionic potential: <3 (I), 4–8 (II), and >10 (III) [Reference Goldschmidt27, Reference Li, Yang, Su, Li, Gao and Shang136], and there are also elements in between the regions. Ions in region (I) have the lowest ionic potential and polarizing ability and form highly ionic bonds with oxygen. This group includes alkali, alkaline earth, and other divalent and trivalent large cations. These elements are compatible with borosilicate glass and are network modifiers. Because of their low ionic potential, they are highly soluble in water. As a result, they can be leached by ion exchange under acidic conditions. Halogen ions are also included in Fig. 9 to show their relative reactivity based on their absolute ionic potential. Ions in region (II) have an intermediate polarizing ability. They often form insoluble oxides and hydroxides with a covalent bond to oxygen. When incorporated in borosilicate glass, they are intermediates in the silicate glass structure and cannot be easily leached into solution but often form residuals or precipitates after the soluble ions are dissolved in solution. This group includes a range of divalent, trivalent, tetravalent, and pentavalent cations. Rare earth elements (REEs) are located near the boundary of regions (I) and (II), suggesting their reactivity is similar to that of the elements in either region. Ions located in region (III) are highly polarizing ions with a high field strength. As a result, they often form an oxyanion rigid unit. Because each of these oxyanions has unique chemistry, they are not necessarily compactible with any host structure, such as borosilicate glass. For instance, the solubility of Cr6+, Mo6+, and S6+ is low in borosilicate glass. Because of their large size as a rigid oxyanion unit and low nominal charge, these oxyanions are soluble in water. Note that a change in the oxidation state of variable valence elements can move an element from one region to another, which can significantly change the solubility behavior in oxides and solution. For instance, Cr3+ and Mo4+ in region (II) are insoluble in aqueous solutions. If oxidized to Cr6+ and Mo6+, they form oxyanions and are in region (III), becoming incompatible with borosilicate glass and insoluble in the glass but soluble in aqueous solutions. The solubility of ferrous iron (region I) in aqueous solution is significantly reduced if oxidized to ferric iron (region II). Based on the ionic potential, nuclear waste elements can then be classified into different groups based on their solubility in the host material and in water. For those with a high solubility in both oxides and aqueous solution, understanding their dissolution behavior is critical for the prediction of their chemical durability in the environment. For those with a high solubility in oxides but with a low solubility in aqueous solution, a high concentration in nuclear waste forms can be achieved without much concern for them being rapidly released into the environment. Problematic waste elements are soluble in water but insoluble in a given waste host material, in which case, special waste forms to target these specific elements are necessary.
The charge is plotted as a function of ionic radius for a selection of ions. Ionic potential is used to divide the ions into different regions (dashed lines—ionic potential is next to the lines): soluble hydrated ions (I), insoluble oxides and hydroxides (II), and soluble oxyanions (III). Solid cyan lines are eye guides for the ions of the same row in the periodic table. Open crossed circles are redox sensitive ions, and arrows indicate the change property of the ion by oxidation. REEs are pink circles, and Halogen ions are dark red diamonds. Adapted and modified from Refs. Reference Goldschmidt27 and Reference Li, Yang, Su, Li, Gao and Shang136.

Prediction of the dissolution rate of glass and multiphase ceramics using the linear free-energy relationship
The dissolution rate of single-phase ceramic materials with a given structure can be predicted using a linear free-energy relationship as discussed in the previous section. For aperiodic systems such as glass, however, a direct use of the linear free-energy relationship for the rate prediction is problematic. Although glass is a single phase, the atomistic scale structure can change significantly with the composition, such as in borosilicate glass [Reference Dell, Bray and Xiao137]. These structural changes need to be considered for rate prediction.
The crystalline reference state (CRS) was proposed to represent the structure and composition of glass materials [Reference Conradt138, Reference Conradt139] and has been used for modeling the physical properties of borosilicate glass [Reference McGrail, Icenhower, Darab, Shuh, Baer, Shutthanandan, Thevuthasan, Engelhard, Steele and Rodriguez140, Reference Jantzen and Brown141]. The fundamental assumption is that the local structure of a glass in the short range is similar to the corresponding crystalline phase of an oxide with a similar composition [Reference Mavračić, Mocanu, Deringer, Csányi and Elliott142]. At the intermediate range, extensive research shows that the structure of a glass resembles fragments of the structures of the corresponding crystalline phases [Reference Dell, Bray and Xiao137, Reference Taylor and Brown143, Reference Taylor and Brown144, Reference Schlenz, Kirfel, Schulmeister, Wartner, Mader, Raberg, Wandelt, Oligschleger, Bender and Franke145]. The similarity in the dissolution mechanisms between silicate minerals and their glasses suggests that dissolution reactions occur at short and intermediate ranges where their structures are similar [Reference Hamilton, Pantano and Brantley146, Reference Hamilton, Brantley, Pantano, Criscenti and Kubicki147]. For instance, the activation energy for the dissolution of quartz and silica glass is approximately the same [Reference Icenhower and Dove148], suggesting a similar mechanism of breaking the Si–O bond in the dissolution of the two phases. Differences in their dissolution rate are related to differences in the distortions of local structure in the glass and different energetics [Reference Takada, Conradt and Richet149, Reference Conradt150], which are associated with broader bond lengths and angle distributions, larger molar volumes, and other structural features in glasses that are not present in crystals [Reference Perez, Daval, Fournier, Vital, Delaye and Gin151, Reference Bouyer, Geneste, Ispas, Kob and Ganster152]. Structural features in oxide glasses such as water-accessible free volume may lead to dissolution mechanisms that are different from those in crystals [Reference Perez, Daval, Fournier, Vital, Delaye and Gin151, Reference Bouyer, Geneste, Ispas, Kob and Ganster152]. In addition, the stepwave dissolution mechanism that well describes the dissolution kinetics of crystals with dislocation defects may not be applicable to glasses [Reference Lasaga and Luttge56]. If the overall dissolution of a glass is simply approximated by the summation of the dissolutions of all CRS phases with parallel dissolution reactions, the linear free-energy relationship could be employed for the prediction of glass dissolutions. The rate becomes a summation of the linear free-energy relationships of the dissolution [Eq. (6)] for each individual CRS phase and their cross terms.
 $$RT\;\ln \left( r \right) = \sum\limits_{i,j = 1,n} {{f_i}} \cdot {\alpha _{i,j}} \cdot \left( {{a_i} \cdot \Delta G_{{{\rm{f}}^'},{{\rm{M}}^z}}^{\rm{o}} + {b_i} + {\beta _i} \cdot {r_{i,{{\rm{M}}^z}}}} \right)\quad ,$$
where i, j is a CRS phase, n is the number of CRS phases, αi,j is the effect of phase j on the rate of phase i to account for the coupling effect from cross interactions between different CRS phases, f i is the faction of phase i, and z is the charge of the substitution ion. If i = j, the coupling constant αi,j = 1. If I ≠ j, αi,j ≠ 0 if the coupling is not ignored, or αi,j = 0 if the coupling is ignored.
The first step to applying Eq. (19) is to identify the CRS phases that represent the structure and composition of the glass using principles established in the literature [Reference Conradt138, Reference Conradt139, Reference McGrail, Icenhower, Darab, Shuh, Baer, Shutthanandan, Thevuthasan, Engelhard, Steele and Rodriguez140, Reference Jantzen and Brown141, Reference Jantzen and Brown153]. For each CRS phase, substitution sites need to be determined, and dissolution rate data need to be characterized for each of the end members. The free-energy relationship of dissolution for each CRS phase will then be established. After all the free-energy relationships for the CRS phases become available, the glass dissolution rate can then be modeled using Eq. (19).
For multiphase ceramic waste forms, the coupling between different phases is reduced to phase boundaries, which can be neglected (αi,j = 0, I ≠ j) if the phase boundary density is low.
 $$\ln \left( r \right) = {1 \over {RT}}\sum\limits_{i = 1} {{f_i}} \cdot \left( {{a_i} \cdot \Delta G_{{\rm{f'}},{{\rm{M}}^z}}^{\rm{o}} + {b_i} + {\beta _i} \cdot {r_{i,{{\rm{M}}^z}}}} \right)\quad .$$
If the grain size is well below the micrometer scale and the phase and grain boundary densities are high, the boundaries cannot be neglected. Both phase and grain boundaries are two-dimensional objects with a thickness in the nanometer range and may have a different composition than the corresponding phases. Because they often have higher energies and are more reactive in solution with higher dissolution rates, they should be treated separately from bulk phases.
Incongruent dissolution and surface alteration layer of multiple-metal oxides
The dissolution rate formulations described so far assume that the surfaces are free of surface alteration layers or secondary phases. However, observations of many multiple-metal oxides such as aluminosilicate minerals and borosilicate glasses suggest that alteration layers often occur with thicknesses varying from nanometers to micrometers [Reference Frankel, Vienna, Lian, Scully, Gin, Ryan, Wang, Kim, Windl and Du1]. Such surface layers complicate dissolution kinetics by controlling the transport of reactive species within the layers and influencing the chemistry of the solution. The alteration layer formation originates because each of the elements in multiple-metal oxides has a different chemical bonding character and solubility in solution. The relative rate of breaking the metal–oxygen bonds decreases dramatically from monovalent, divalent, and trivalent to tetravalent ions [Reference Frankel, Vienna, Lian, Scully, Gin, Ryan, Wang, Kim, Windl and Du1, Reference Schott, Pokrovsky and Oelkers10, Reference Oelkers45]. This difference leads to incongruent dissolution and the resulting alteration layers at the surface depleted in soluble cations and enriched in insoluble cations. How the alteration layer is formed is currently an area of active research. There are two dominant theories: ion exchange followed by structural reorganization versus stoichiometric dissolution followed by in situ reprecipitation [Reference Hellmann, Wirth, Daval, Barnes, Penisson, Tisserand, Epicier, Florin and Hervig154, Reference Gin, Jollivet, Fournier, Angeli, Frugier and Charpentier155, Reference Geisler, Dohmen, Lenting and Fritzsche156]. Both theories have ample experimental and theoretical support [Reference Frankel, Vienna, Lian, Scully, Gin, Ryan, Wang, Kim, Windl and Du1, Reference Hellmann, Wirth, Daval, Barnes, Penisson, Tisserand, Epicier, Florin and Hervig154, Reference Gin, Jollivet, Fournier, Angeli, Frugier and Charpentier155, Reference Geisler, Dohmen, Lenting and Fritzsche156, Reference Ruiz-Agudo, Putnis and Putnis157, Reference Geisler, Nagel, Kilburn, Janssen, Icenhower, Fonseca, Grange and Nemchin158, Reference Hellmann, Cotte, Cadel, Malladi, Karlsson, Lozano-Perez, Cabié and Seyeux159, Reference Gin, Collin, Jollivet, Fournier, Minet, Dupuy, Mahadevan, Kerisit and Du160]. A major consequence of the different formation mechanisms is that the resulting alteration layers may have different properties and can be amorphous or crystalline, dense or porous [Reference Daval, Bernard, Rémusat, Wild, Guyot, Micha, Rieutord, Magnin and Fernandez-Martinez161], and passivating or not. The passivating nature of the alteration layer is caused by slowing down the transport of reacting species through the layer. Therefore, the passivation layer is critical for the applications of nuclear glass and alloys and an important factor in understanding the chemical weathering of minerals in the environment [Reference Frankel, Vienna, Lian, Scully, Gin, Ryan, Wang, Kim, Windl and Du1, Reference Stumm and Wollast6, Reference Brantley9, Reference Schott, Pokrovsky and Oelkers10].
Dissolution reactions are complex reactions consisting of parallel and sequential elementary reactions involving surface solvation, surface adsorption, ion exchange, hydrolysis, and detachment of surface-activated complexes. These elementary reactions often occur on very different timescales. For instance, surface adsorption reactions are orders of magnitude faster than dissolution reactions (Fig. 3). The relative kinetics of these reactions determine the mechanism of the overall dissolution reaction. If the ion exchange of protons in solution for cations in the oxide solid occurs and the resulting proton-exchanged layer at the surface is stable, the proton-exchanged layer may grow into the material beyond the surface. As the thickness of the hydrated layer increases, instability may develop. For instance, partially proton-exchanged clays and zeolites are stable [Reference Slade, Barker, Hirst, Halstead and Reid162, Reference Beyerlein, McVicker, Yacullo and Ziemiak163, Reference Stephenson, Attfield, Holmes and Dryfe164], but fully proton-exchanged phases are not. Once the stability thickness is surpassed, the hydrated layer will transform into a more stable phase, such as an amorphous layer. In this scenario, the ion exchange followed by the reorganization scheme characterizes the dissolution process well. Because the proton-exchanged layer is two-dimensional, metastable, and temporal, its transformation into an amorphous alteration layer could occur in a layer-by-layer fashion. On the other hand, if the ion exchange causes high instability within the first surface layer and hydrolysis reactions occur immediately, a proton-exchanged layer may be restricted at the very surface and not develop further into the material. In such cases, the alteration layer may become amorphous such as silica gel in silicate dissolutions [Reference Ruiz-Agudo, Putnis and Putnis157]. In this latter case, dissolution coupled re-precipitation characterizes the process well.
It is most likely that each of the two scenarios highlights one aspect of the spectrum of the dissolution process. It may be constructive to not exclude one theory over the other. Which mechanism dominates the alteration layer formation may largely depend on a number of factors including the composition of the oxide and the solution conditions. However, the alteration layers formed with different mechanisms can have very different properties. The reorganization of the proton-exchanged layer may allow some underlying structure of the material to be inherited, while the alteration layer from re-precipitation may only be affected by the local solution chemistry. Thus, stress parallel to the surface may develop in the alteration layer if there is a surface restraint exerted by the underlying structure. Note that not all amorphous alteration layers are passivating, and the passivating properties depend on the formation mechanism, the structure and composition of the material, and the environmental conditions. The exact factors that determine a passivating alteration layer are still elusive. In any case, the altered phase is metastable, either amorphous (e.g., silica gel-SiO2nH2O) or crystalline (e.g., Anatase-TiO2), and it may undergo continuous structural change or phase transition.
Implications from nature: partition coefficient of element between the ocean and the Earth's crust
Understanding oxide dissolutions is mostly based on experimental observations under conditions likely present in applications of interest and on timescales that can be managed experimentally. These conditions and timescales may not be sufficient for the intended applications, especially for timescales much longer than experimentally manageable. Nature provides a hint for understanding the long-term chemical durability of oxides in natural environments that cannot be replicated in a laboratory. In the Earth's natural environment, almost all elements undergo global cycling enabled by various geochemical processes. During these processes in an environment that involves the atmosphere, hydrosphere, biosphere, and lithosphere, some elements are dissolved in the ocean, and others precipitate out and are sequenced in the Earth's crust. This results in a partition of elements between Earth's crust and ocean. The dynamic cycling processes have occurred on Earth over the geological history since at least 3 billion years ago when the oceans were formed. Early Earth had a salinity of approximately 1.5–2 times the modern value [Reference Knauth165], which was reduced to more or less today's values approximately 1 billion years ago and has remained remarkably stable since then [Reference Knauth and Noffke166]. Since the Great Oxidation Event ∼2.4 billion years ago, the Earth's atmosphere and the ocean have been oxidized, with the oxygen concentration at least in the present level since ∼0.5 billion years ago. Since the last great glacial maximum approximately 22,000 years ago, the salinity has remained within a few percent of today's value [Reference Blättler, Higgins and Swart167]. Given the active processes on the Earth over a long period of time, the inputs to and outputs from the oceans may be considered in a quasi-steady state. If this assumption is valid, the elemental partition between the ocean and Earth's crust indicates the durability of an element in the environment.
The partition coefficient between the ocean and Earth's crust is defined as the logarithmic ratio of the average concentration of the element in the ocean (Caocean) [Reference Haynes168, Reference Earnshaw and Greenwood169] and the average concentration in the Earth's crust (Cacrust) [Reference Turekian170]. For Ca, log(Caocean/Cacrust) = ∼2.0, resulting in a partition of 100:1. In fact, calcium can be considered as a reference element because calcium carbonate (calcite or aragonite) is nearly in equilibrium with deep ocean water [Reference Povinec, Livingston, Shima, Aoyama, Gastaud, Goroncy, Hirose, Huynh-Ngoc, Ikeuchi and Ito171]. As shown in Fig. 10(a), the partition coefficient of all the elements with respect to Ca are plotted. The elements that are more partitioned in the ocean have positive values, suggesting they are less durable than calcium, and these elements include noble gasses, halogens, and most alkali and alkaline earth elements. Exceptions are observed for Be and Cs, which are expected to be soluble in aqueous solutions, but they are efficiently sequestered in the crust. These are probably due to high ioinic potential of Be2+ and adsorption of Cs+ in silicate rockes. Because they have very negative values, they are chemically durable and depleted in the ocean, similar to many transition metal elements (TMs) and REEs. Re and Mo are less durable than most other transition metals. In terms of nuclear waste elements, soluble elements such as Cl, I, and Sr, and those with durability similar to that of Ca, such as U and Mo, become problematic radionuclides.
(a) The partition coefficient between the ocean and Earth's crust is plotted for all natural elements with respect to Ca. (b) Logarithm residence time is plotted as a function of the partition coefficient between the ocean and Earth's crust. The dashed line is the linear regression line. The thick gray lines divide the elements into three regions: durable, moderate, and soluble. Major elements in Earth's crust are blue crossed-circles.

The residence time of an element in the ocean, the amount of the element in the ocean divided by the input or output rate, is a measure of how long, on average, the element remains in the ocean. If the residence time of an element is high, then the element is highly partitioned to the ocean. This leads to a positive correlation between the residence time and partition coefficient, as shown in Fig. 10(b). The top 15 major elements in the crust (cross-circles) and many trace elements are on the same trend. A linear fitting of the data (R 2 = 0.82) results in the residence time (τ):
 $$\tau = {10^7} \cdot {\left( {{{{C_{{\rm{ocean}}}}} / {{C_{{\rm{crust}}}}}}} \right)^{0.6}}\quad .$$
Although silicon is the most abundant element in the Earth's crust and most rock-forming minerals are silicates, silica is undersaturated with respect to opal (amorphous silica) in sea water with log(C ocean/C crust) ∼ −5 [Reference Povinec, Livingston, Shima, Aoyama, Gastaud, Goroncy, Hirose, Huynh-Ngoc, Ikeuchi and Ito171, Reference Treguer, Nelson, Van Bennekom, DeMaster, Leynaert and Queguiner172, Reference Tréguer and De La Rocha173], suggesting that Si is a durable element, which is consistent with observations. Using Ca and Si as two references for durability, all elements can be divided into three groups based on their residence time and partition coefficient, as shown in Fig. 10(b). Elements with a low partition coefficient (log(C ocean/C crust) < −5) and short residence time (log(τ) < 4.3 or τ < 20,000 years) are elements sequestered in the ocean with high efficiency and high rate and are considered to be durable in the Earth's surface environment. Elements with high partition coefficients (log(C ocean/C crust) > −2) and long residence times (log(τ) > 6 or τ > 1,000,000 years) are not durable, cannot be cycled by the Earth's crust, and remain mostly in ocean water. Those in between have intermediate durability. It is not surprising that corrosion-resistant elements such as Cr, Al, and Ti are located in the durable region [Fig. 10(b)]. REEs and many TMs are also located in the durable region. The elements Cl, I, and Sr in the soluble region and Cs and U near the soluble region are problematic in nuclear waste management, and their behaviors in the environment are of great interest. As these data show, the Earth's natural processes have the ability to selectively sequester some elements in the crust, which provides a unique perspective in understanding the durability of oxides.
The residence time and partition coefficient have important implications for nuclear waste disposal. The idea of ocean disposal of radioactive waste was dismissed long time ago but resurfaces from time to time in the news. The mechanism for ocean dumping is based on the ocean's dilution ability to mitigate the hazardous effects to marine life [Reference Calmet174]. There are many good reasons that dumping was banned. However, the ocean's ability to sequester elements has not been considered. For instance, the ocean can effectively recycle Th, Be, Pd, and REEs in a time frame of thousands of years, while Cl, I, and Sr can remain in the ocean for many millions of years. Therefore, the effects of dumping nuclear waste in the ocean need further study to understand the effect of dumping on the natural cycling of elements in the ocean. Such understanding could lead to a full appreciation of the intriguing coupling of anthropogenic activities and natural processes.
For ceramic nuclear waste forms, natural mineral analogues have been used for waste form development, such as the development of synroc [Reference Ringwood, Kesson, Ware, Hibberson and Major175]. These natural analogues demonstrate their durability in natural processes in geological time. One characteristic of these minerals is their flexibility in composition, which results from their crystal structure with multiple crystallographic sites that can be substituted with different elements of similar size and valance. Because chemical durability varies significantly from element to element, exploration of the compositional space of these natural analogues can be a fruitful area for research and development to optimize the composition of a given nuclear waste.
Challenges and opportunities for predictive understanding of the dissolution kinetics of oxides
(i) The dissolution rate is not an intrinsic property of a material but a response to the environmental conditions. Thus, the rate measured under arbitrary conditions cannot be used to quantify the chemical durability of the material. The chemical durability should be characterized by a collection of intrinsic properties that account for the response to environmental variables. A reliable prediction of the chemical durability of a material requires accurate estimations of these intrinsic properties. These properties include the forward rate constant, solubility constant, activation energy of temperature dependence, and reaction order pH dependence. Each of these intrinsic properties can be estimated from a series of experiments that are systematically designed for that environmental variable. However, it is desirable that these intrinsic properties are predicted from the composition and structure of the material. Although substantial experimental effort in the past decades has been dedicated to estimating some of these properties, only a few examples have been reported to predict some of these properties, such as the forward rate [Reference Sverjensky86] and the reaction order pH dependence [Reference Crundwell176]. Systematic studies for predictive understanding of the variations in these intrinsic parameters within a group of materials and across different groups are essential for a quantitative prediction of the dissolution kinetics of materials from their structure and composition.
(ii) The forward rate constant or the far-from-equilibrium rate constant [i.e., k 0 in Eq. (14)] is an intrinsic property of a material and is often used as a parameter to quantify its chemical durability. However, in practice, at a given condition (e.g., T, pH, and solution composition), the forward rate [i.e., k + in Eqs. (13) and (14)] is replaced with the initial rate, which is ill-defined and often not the same rate under the far-from-equilibrium condition. The problems of using the initial rate as the forward rate arise from the surface artifacts as a result of the sample preparation, grain boundaries, and how dissolution data points are selected to calculate the initial rate. In addition, in a static batch experiment, as soon as dissolved species are presented in the solution, the reverse reaction occurs. The effect of the reverse reaction on the dissolution rate highly depends on the properties of the material and the solution conditions. The contribution of the reverse reaction to the measured rate has not been rigorously treated in most experiments for the estimation of the initial rate. These issues cause inconsistencies in the forward rate estimations. Therefore, there is a need to develop a consistent method to exclude surface artifacts and solution feedback in estimating the initial rate. In addition, short-term screening tests such as static product consistency tests, which are often used for screening the durability of materials, cannot be used to quantify the chemical durability of a material because the resulting value is not an intrinsic property of the material. Research on how to relate these short-term test results to chemical durability is important to provide reliable guidance for the development of durable materials.
(iii) One of the challenges of the current TST–SCM formulation is high or partial orders of the dependence of the rate on the concentrations of the surface complexes or solution species in the rate equations [Reference Pokrovsky and Schott81, Reference Pokrovsky and Schott100, Reference Pokrovsky and Schott112, Reference Gautelier, Schott and Oelkers113, Reference Oelkers, Schott and Devidal116, Reference Gautier, Oelkers and Schott119]. To derive rate equations, dissolution experiments are performed, and surface dissolution reactions are written based on reactive surface precursors informed by SCM, and then the reaction orders are determined by fitting the rate equations to the experimental observations. Justifications of the orders are often based on assumptions of the surface-activated complex involved in the dissolution reactions. Although such a practice is useful in the modeling of experimental results, the fundamental mechanisms of the molecular-scale reaction pathways that lead to the reaction orders are left with speculations. Multiple dissolution mechanisms could be derived to fit the dissolutions data equally well with statistically indistinguishable numerical errors [Reference Bickmore, Wheeler, Bates, Nagy and Eggett177]. The problem may be compounded by the parameter dependence among the fitting variables, especially for small fractional reaction orders. To account for the partial orders, rate equations have been derived for a number of systems based on the coupling of detaching oppositely charged surface species through the electrostatic potential at the surfaces [Reference Crundwell176, Reference Crundwell178, Reference Crundwell179]. In many of these efforts to derive rate equations, a common challenge is the identity and stoichiometry of the surface complexes that lead to the dissolution reaction. Experimental techniques that are capable of detecting these surface species could provide direct support for the derivation of the rate equations. Computational methods such as free-energy methods based on electronic structure calculations and molecular dynamics simulations can not only compute the speciation and energetics of surface reactions but also provide a test of the proposed dissolution mechanisms.
One of the limitations of the current TST–SCM formulation is the effect of an external potential on the dissolution rate. Indeed, SCM has already accounted for the effect of the surface potential induced by charged surface species. However, if an external potential is applied, the concentrations of the surface complexes will change. For instance, the  $\left[ {{\rm{ > MgOH}}_2^ + } \right]$ surface complex concentration will increase by an applied external negative potential, which can lead to increased dissolution because the doubly protonated surface complex controls brucite dissolution [Fig. 6(a)]. Such an enhanced dissolution was reported in a recent experiment, which showed that the dissolution rates of silica and alumina were increased by up to 2 orders of magnitude over the dissolution rates of isolated compositionally similar surfaces under otherwise identical conditions when the surface electrochemical properties were changed either by an applied potential or close to a dissimilar surface [Reference Dobbs, Degen, Berkson, Kristiansen, Schrader, Oey, Sant, Chmelka and Israelachvili180]. In addition, similar experimental results were also reported at interfaces between oxides and a metal [Reference Guo, Gin, Lei, Yao, Liu, Schreiber, Ngo, Viswanathan, Li, Kim, Vienna, Ryan, Du, Lian and Frankel181]. The accelerated corrosion was attributed to the interfacial interactions between the dissimilar materials (stainless steel and a nuclear waste glass and a ceramic waste form). These results provide new insights on the dissolution processes that occur in confined spaces or under an applied field. Electrostatic potential as an additional environmental parameter provides opportunities to explore the dissolution phenomena of various materials under various scenarios for diverse applications.
(iv) Predictions of the dissolution rate of oxides on short timescales can be directly verified with additional experimental observations. Great challenges remain in reliably predicting the long-term durability that is more relevant for many applications. In practice, long-term prediction of the dissolution rate relies on determining all the critical reaction kinetics that are rate determining in dissolution. In reality, however, such an approach cannot guarantee that all rate-determining reactions are inclusively identified and characterized. For instance, the secondary phase formation in the dissolution of many silicates greatly complicates the understanding of the long-term dissolution kinetics. This complication arises from the complex nature of nucleation and growth of the secondary phases and their phase transformation over time. In some cases, the transformation is continuous, such as the amorphous gel-like alteration layer on many silicates, which may experience gradual coordination changes in a short timescale and eventually transform to the thermodynamic more stable phases, such as zeolite and clays. There is a need to predict the types of the secondary phases, the formation rate of the secondary phases, and the effect on the dissolution kinetics of the material. In addition, it might be worth exploring the degradation of ancient objects (e.g., man-made and natural materials) and minerals of sediments in geological records for benchmarking the prediction of the long-term dissolution rate as long as their age and the environmental conditions they experienced can be quantified.
(v) Surface alteration layers have a great effect on the dissolution kinetics of many multiple-metal oxides including silicates. However, experimental observations have shown that not all alteration layers at surfaces are passivating [Reference Schott, Pokrovsky, Spalla, Devreux, Gloter and Mielczarski33]. The properties that prevent the materials from further dissolution mainly rest on the microstructure of the layer. Currently, there is a lack of a theory on what properties of a material and what environmental conditions determine the passivating properties. Both experimental and molecular modeling have been employed to understand the microstructure and the transport of aqueous species in the alteration layer [Reference Schott, Pokrovsky, Spalla, Devreux, Gloter and Mielczarski33, Reference Gin, Jollivet, Fournier, Angeli, Frugier and Charpentier155, Reference Gin, Collin, Jollivet, Fournier, Minet, Dupuy, Mahadevan, Kerisit and Du160]. Additional research is needed to understand how the underlying solid structure and environmental conditions control the microstructure and the transport properties of the reacting aqueous species in the surface alteration layers. For a given crystalline material, the passivation of different crystal faces is expected to be different because of different surface structures. Investigations into how the underlying crystal structure constrains the formation of different microstructures in the alteration layer could lead to a better understanding of the alteration layer formation.
(vi) Dissolution experiments have been reported for a large number of materials without quantifying defects as a controlling property that affects dissolution. Although experimental observations have shown defects have a significant effect on the dissolution rates of oxides, how different types of defects affect the dissolution rate has not been systematically investigated and their effect on dissolution kinetics has not been rigorously formulated. One exception is that the effect of dislocation, which is quantified by a critical free energy (ΔG crit) for opening up etch pits that accelerate the dissolution using a dissolution stepwave model [Reference Lasaga and Luttge56]. There are many other different types of defects, such as vacancies, interstitials, Frenkel pairs (point defects), edge and screw dislocations (linear defects), grain boundaries, stacking faults, antiphase boundaries, twin boundaries (planar defects), pores, voids, and impurity clusters such as precipitates (bulk defects). Defects can also be introduced by radioactive elements. The β-emitting elements in oxides can change the chemical composition over time as a result of β decay, which could have a significant effect on the chemical durability. The α-emitting actinides in oxides can induce radiation damage, which also affect the chemical durability. Research on both of these areas will provide a fundamental understanding of how nuclear waste forms degrade over long timescales. There is also a need to quantify defects in amorphous oxides such as glasses. In these materials, defects do exist. For instance, if short-range order is considered for ideal amorphous SiO2, then each Si is coordinated to 4 O and each O is coordinated to two Si. A single coordinated O and 3 or 5 coordinated Si can be considered as defects in silica. Such a consideration is very similar in defining defects in crystals and the properties of these defects in silica are expected to be similar to vacancies and interstitials in crystals.
(vii) Cold sintering is a technique to synthesize dense monolith ceramics by adding a small volume of liquid (e.g., water) to the starting powder to provide a medium for mass transport (dissolution, precipitation, and growth) that is assisted by applying pressure and heat at temperatures below 400 °C. The technique has been successfully demonstrated for a number of ceramic systems to produce high theoretical density dense monoliths with low cost and high efficiency. The main processes of sintering include the mechanical compaction of the powder, cementation between particles, and reduction of voids enabled by a combination of homogeneous and heterogeneous precipitation events on existing and newly formed grains. During the process, hydrated phases may form, and surfaces and grain boundaries may be hydroxylated and remain in the ceramics. The increased concentration of these hydrous species (hydroxyl, water, and hydrogen) may change the properties of the ceramics with respect to the anhydrous ceramics. The chemical durability may be increased. In fact, many hydrous minerals have much lower dissolution rates than the anhydrous ones, in part because of the increased chemical potentials of the water species in hydrous phases. The changes in properties as a result of cold sintering ceramics, such as the chemical durability, need to be studied in the future.
Acknowledgment
This work was supported as part of the Center for Performance and Design of Nuclear Waste Forms and Containers, an Energy Frontier Research Center funded by the U.S. Department of Energy, Office of Science, Basic Energy Sciences, under Award DE-SC0016584.


 Open access