


A healthy diet provides nutrients and energy necessary for children’s physical and cognitive development and has been shown to improve physical and mental health, support cognitive processes essential for learning and academic performance, and reduce the risk of chronic diseases later in life(Reference Hollis, Collins and DeClerck1,Reference Melanson2) . However, Canadian children are missing out on these benefits as their diets contain too much sugar and salt(Reference Hack, Jessri and L’Abbé3), only one in four children consume vegetables and fruit five or more times a day(4), and nearly 50 % of their total daily energy intake comes from ultra-processed foods(5). Population-level strategies are urgently needed to improve the diets of Canadian children, ensuring they have access to healthier food and beverage options.
International studies have shown that school food programmes (SFP) are an effective strategy to improve children’s diets(Reference Mansfield and Savaiano6–Reference Guio9). Until recently, Canada was the only G7 and Organisation for Economic Co-operation and Development country without a national SFP(10). Important steps have been taken since 2024 to set Canada on a path toward establishing a national SFP. Specifically, the National School Food Policy was released by the Government of Canada in June 2024, with the vision for ‘all children and youth in Canada [to] have access to nutritious food at school’(11). The Government of Canada has now allocated permanent funding for a national SFP and signed agreements with all provinces and territories, which have begun receiving federal funding and initiating SFP(12).
To reach this vision, the National School Food Policy emphasises that SFP should be accessible (i.e., stigma- and barrier-free), health-promoting (i.e., food served adheres to Canada’s Food Guide recommendations), inclusive (i.e., culturally appropriate and relevant), flexible (i.e., locally sourced where possible), sustainable (i.e., environmentally sustainable) and accountable (i.e., continuously monitored and evaluated). Indeed, recognising that every school is unique, Canada’s National School Food Policy provides flexibility to governments and school authorities to decide what SFP should look like in their schools(13), generating significant variability across jurisdictions in the types of meals provided as part of SFP (i.e., breakfast, snack and lunch), foods included in these meals and costs for students/families to participate in SFP.
Understanding the potential of SFP to improve the diets of Canadian children is essential to inform the development of a national SFP. Existing research on the diet quality of meals and snacks provided by schools among Canadian children is scant and limited to lunches only(Reference Tugault-Lafleur and Black14–Reference Everitt, Engler-Stringer and Martin16). Two studies based on the Canadian Community Health Survey data showed that children consumed approximately one-third of their daily calories during school hours, coming predominantly from foods and beverages with lower than recommended densities of important micro- and macro-nutrients (e.g., vitamins A and D, calcium, magnesium, protein)(Reference Tugault-Lafleur, Black and Barr17,Reference Tugault-Lafleur, Barr and Black18) . In this study, we examined the dietary intake and diet quality of Canadian elementary schoolchildren accessing meals (i.e., breakfast and lunch) and snacks (i.e., morning and afternoon) provided by schools.
Methods
Setting and study sample
APPLE Schools (A Project Promoting healthy Living for Everyone in schools) is an innovative school-based health promotion initiative, launched in 2008 and implemented in over 100 schools located in socioeconomically disadvantaged communities, benefiting over 35 000 kids annually(19). APPLE Schools follows a Health Promoting Schools approach(20) and aims to shift the schools’ social and physical environment to enable healthy options and choices(Reference Fung, Kuhle and Lu21). Specifically, APPLE Schools delivers a variety of health promotion activities targeting healthy eating (e.g., encouraging schools to adopt nutrition policies, engaging students in healthy eating campaigns and building school gardens), physical activity (e.g., organising health promotion challenges to encourage students to be active) and mental well-being (e.g., school-wide campaigns to increase the sense of belonging among students and staff). In Spring 2023 and 2024, we gathered school-based survey data in 32 elementary schools that introduced the APPLE Schools initiative in their schools in the last five years. Schools were located in urban centres in two Canadian provinces (Alberta and Ontario). All students in grades 4 to 8 were invited to participate, and 2457 students (out of 3135 invited) completed a questionnaire and a 24-hour diet recall during class time. This study was conducted according to the guidelines laid down in the Declaration of Helsinki, and all procedures involving human subjects were approved by the Research Ethics Boards of the Unity Health Toronto (#22-118, #23-201), the University of Toronto (#46 183), University of Alberta (Pro00119951) and participating school boards. In schools that required written parental consent, parents/guardians were first provided with study information and asked to give written consent for their child(ren) to be invited to participate; students then provided assent on the day of the survey. In schools without this requirement, parents/guardians were informed about the study through an active-information passive-permission consent process, and students provided assent on the day of the survey.
Measures
Exposures
Students reported foods and beverages they consumed in the past 24 h using an interactive web-based diet recall tool, previously validated in elementary school students in Canada(Reference Hanning, Royall and Toews22). The tool comprises a comprehensive database of 669 food and beverage items, with each item depicted by an image and accompanied by corresponding descriptive text. It follows a multiple-pass approach and prompts children to select all foods and beverages, and their portion sizes (0·5, 1, 1·5, 2, 2·5 or 3 servings) consumed for six meals: breakfast, morning snack, lunch, afternoon snack, dinner, and evening snack. This study is limited to meals and snacks consumed during school hours, with school in Canada typically starting around 8:30 and ending around 15:30. Thus, morning snack, lunch and afternoon snack are generally consumed at school, whereas breakfast may be consumed either at home, at school or both. For each meal consumed during school hours (i.e., breakfast, morning snack, lunch, afternoon snack), students were prompted to indicate the source of each food and/or beverage using the following categories: school (provided by school breakfast, lunch or snack programme; purchased at school cafeteria), home (brought from home; eaten at home) and other (purchased from a restaurant or take-out; traded with another student or received as a gift). Students were categorised according to whether they consumed at least one meal or snack provided by school or purchased at school during school hours (yes/no) and further according to the type of meal received from school (i.e., breakfast, morning snack, lunch and afternoon snack).
Outcomes
To assess dietary intake, we considered the number of daily servings of vegetables and fruit, grains and grain products, milk and alternatives, and meat and alternatives (e.g., eggs and plant-based protein foods such as nuts, beans and tofu), according to Canada’s Food Guide 2007(23) recommendations (which are still in effect in Alberta). Specifically, Canada’s Food Guide 2007 recommends that children aged 9–13 years consume daily 6 servings of vegetables and fruit, 6 servings of grains and grain products, 3–4 servings of milk and alternatives and 1–2 servings of meat and alternatives(23). Daily intakes of free sugars (grams and percentage of total energy intake) and sodium (milligrams and milligrams per 100 kcal) were also considered. The estimate of free sugar intake was based on the sum of grams of free sugars in reported foods and beverages, determined using a previously published estimation method based on the Canadian Nutrient File(Reference Rana, Mallet and Gonzalez24). To assess diet quality, we calculated the Diet Quality Index–International (DQI-I) score, ranging from 0 to 100, with higher scores indicating higher diet quality(Reference Kim, Haines and Siega-Riz25). We also calculated four DQI-I dietary components: adequacy (based on attainment of the recommended daily intakes of vegetables, fruit, grains, fibre, protein, iron, calcium and vitamin C; 0–40 points), variety (based on the number of servings of five food groups [meat, poultry, fish, dairy, beans, and eggs] consumed each day; 0–20 points), balance (based on the ratios of macro-nutrients and polyunsaturated, monounsaturated and saturated fatty acids; 0–10 points) and moderation (based on daily energy intake from total fat, saturated fat and empty-calorie foods, as well as daily intakes [mg/day] of cholesterol and sodium; 0–30 points). Detailed information about DQI-I calculation and scoring criteria for each component is available elsewhere(Reference Kim, Haines and Siega-Riz25).
Covariates
Students reported their grade (4, 5, 6, 7, 8), gender (girl, boy, other/prefer not to answer), language they most often speak at home (English, other) and family affluence. Family affluence was based on the previously validated Family Affluence Scale III, derived from a cumulative score of the following items: have a bedroom of their own, number of computers and bathrooms the family has, family has a dishwasher and a vehicle, and number of times family travelled to another province or country for a holiday or vacation in the past year(Reference Hobza, Hamrik and Bucksch26). The Family Affluence Scale III score ranges from 0 to 13, with higher scores corresponding to higher family affluence(Reference Hobza, Hamrik and Bucksch26). Students were categorised into low (0–7), middle (8–11) or high (12–13) family affluence categories based on established cut-off values(Reference Corell, Chen and Friberg27). Additionally, schools were classified according to geographic region, using Statistics Canada’s population centre (PC) and rural area classification(28), as those located in rural areas with a population of <1000, small PC – 1000–29 999, medium PC – 30 000–99 999 and large PC – ≥100 000 population. School postal codes were used to derive material and social deprivation indices based on Canada Census 2016, with higher quintiles indicating greater deprivation (detailed information is available elsewhere(29)).
Statistical analysis
To compare characteristics of students according to SFP, Mann–Whitney U test and χ 2 test for continuous and categorical variables, respectively, were used. Despite the nested data structure (students nested within schools), the intraclass correlation coefficients for all outcomes were negligible (about 0–3 %)(Reference Clark and Linzer30). Therefore, we used ordinary multivariable linear regression models to evaluate the association of SFP with dietary intake and diet quality outcomes. Models were adjusted for student characteristics (i.e., grade, gender, family affluence) and school characteristics (i.e., geographic region, material and social deprivation). We additionally adjusted for total energy intake, using a restricted cubic spline with 4 knots placed at the 5th, 35th, 65th and 95th percentiles, to account for potential non-linear relationships of this covariate with dietary outcomes(Reference Harrell31). A p-value of 0·05 was considered statistically significant. Students with an unrealistic daily energy intake of >5000 kcal (n 74) and missing covariate data (n 17) were excluded from analyses, with the final sample of 2366 students available for analysis. All analyses were performed using SAS Enterprise Guide Version 7.15 (SAS Institute, Cary, NC, USA).
Results
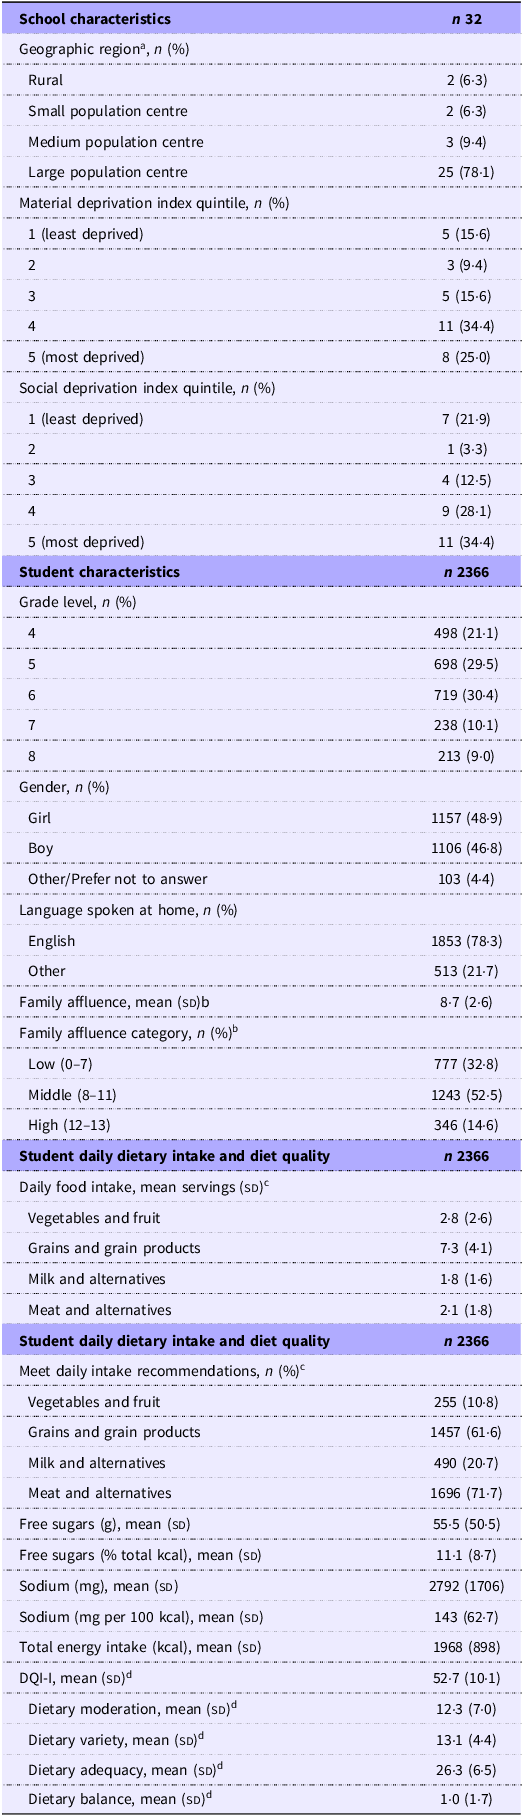
School and student characteristics are presented in Table 1. Three-quarters (75 %) of schools were located in neighbourhoods of high social and material deprivation (quintiles 3–5) and in large PC (78·1 %). About half (48·9 %) of participants were girls, and less than 5 % of students reported another gender identity or preferred not to answer. The average family affluence score was 8·7, with about one-third of students (32·8 %) living in households of low affluence, about half (52·5 %) of middle family affluence and the remainder (14·6 %) of high family affluence.
Characteristics of schools and students participating in the APPLE Schools initiative in Alberta and Ontario, 2023–2024

Table 1 Long description
The table presents characteristics of schools and students participating in the APPLE Schools initiative in Alberta and Ontario, 2023-2024. It has 32 rows and 4 columns. The columns are labeled School characteristics, n 32, Student characteristics, and n 2366. The table is divided into sections: School characteristics, Student characteristics, and Student daily dietary intake and diet quality. School characteristics include geographic region, material deprivation index quintile, and social deprivation index quintile. Student characteristics include grade level, gender, language spoken at home, family affluence, and family affluence category. Student daily dietary intake and diet quality include daily food intake, mean servings, and whether students meet daily intake recommendations. The table lists specific values for each category and characteristic.
Abbreviations: DQI-I, Diet Quality Index – International.
a Based on Statistics Canada classification as rural (<1000 population), small population centre (PC) (1000–29 999 population), medium PC (30 000–99 999 population) and large PC (≥100 000 population)(28).
b Based on the Family Affluence Scale (FAS) III, derived from a cumulative score of the following items: have a bedroom of their own, number of computers and bathrooms a family has, family has a dishwasher and a vehicle, and number of times family travelled to another province or country for a holiday or vacation in the past year. The FAS III ranges from 0 to 13, with higher scores corresponding to higher family affluence(Reference Hobza, Hamrik and Bucksch26).
c Daily food group serving recommendations based on the 2007 Canadian Food Guide for children aged 9–13 years (6 from vegetables and fruit, 6 from grains and grain products, 3 from milk and alternatives, 1–2 from meat and alternatives)(23).
d DQI-I overall score and component scores were adjusted for total energy intake.
Overall, students reported consuming 2·8 servings of vegetables and fruit daily, 7·3 servings of grains and grain products, 1·8 servings of milk and alternatives, and 2·1 servings of meat and alternatives. Majority of students did not meet the daily recommended intake of vegetables and fruit (89·2 %) and milk and alternatives (79·3 %), while most students met dietary recommendations for meat and alternatives (71·7 %) and grains and grain products (61·6 %). Daily intake of sodium was, on average, 2792 milligrams, whereas daily free sugar intake was 55·5 grams, which constituted 11·1 % of students’ total energy intake (on average, students consumed 1968 kcal daily). The average DQI-I score was 52·7 out of 100, with balance being particularly low (1·0 out of 10).
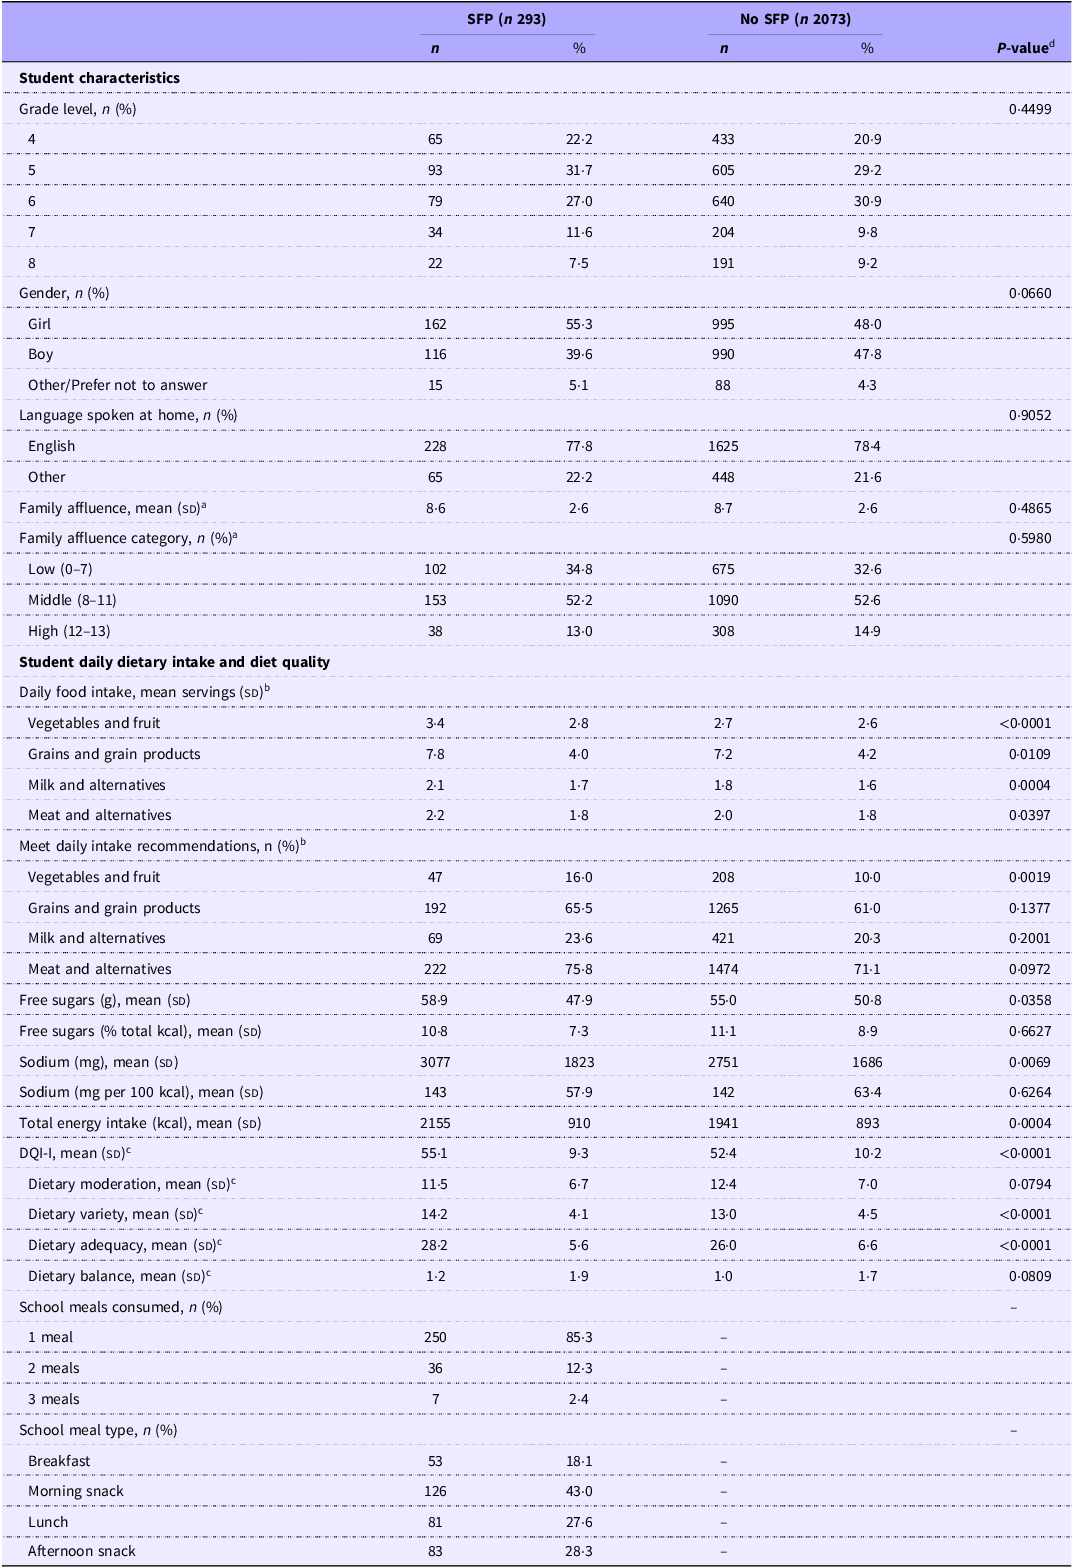
Table 2 shows student characteristics according to SFP. Among 2366 students, only 293 (12·4 %) consumed at least one meal or snack provided by schools. Most of these students consumed one meal provided by school (85·3 %), while 12·3 % and 2·4 % consumed two and three school meals, respectively. The most common meal provided by schools was morning snack (43·0 %), followed by afternoon snack (28·3 %), lunch (27·6 %) and breakfast (18·1 %). On average, students who accessed SFP consumed more daily servings of vegetables and fruit than their peers who did not access SFP (3·4 v. 2·7) and were more likely to meet the recommended number of daily servings of vegetables and fruit (16·0 % v. 10·0 %). The daily servings of grains and grain products, milk and alternatives, and meat and alternatives were consistently higher among students who accessed SFP, and students who accessed SFP were more likely to meet the recommended number of daily servings for each of these food groups than their peers who did not access SFP (albeit not significant). Overall, diet quality was higher among students who accessed SFP than those who did not (55·1 v. 52·4), with higher variety and adequacy (14·2 v. 13·0 and 28·2 v. 26·0, respectively).
Student characteristics and average daily dietary intake and diet quality according to school food programme (SFP) access

Table 2 Long description
The table compares student characteristics and daily dietary intake and diet quality between students who accessed the school food program (SFP) and those who did not (No SFP). It includes data on grade level, gender, language spoken at home, family affluence, daily food intake, and diet quality. The table has 25 rows and 10 columns. Column headers include SFP (n 293) with sub-columns n and percent, No SFP (n 2073) with sub-columns n and percent, and P-value. Row labels include student characteristics such as grade level, gender, language spoken at home, family affluence, and various dietary intake and quality metrics. Notable trends include higher daily servings of vegetables and fruit among SFP students compared to No SFP students, and higher overall diet quality among SFP students.
Abbreviations: DQI-I, Diet Quality Index – International; SFP, school food programme.
a Based on the Family Affluence Scale (FAS) III, derived from a cumulative score of the following items: have a bedroom of their own, number of computers and bathrooms the family has, family has a dishwasher and a vehicle, and number of times family travelled to another province or country for a holiday or vacation in the past year. The FAS III ranges from 0 to 13, with higher scores corresponding to higher family affluence(Reference Hobza, Hamrik and Bucksch26).
b Daily food group serving recommendations based on the 2007 Canadian Food Guide for children aged 9–13 years (6 from vegetables and fruit, 6 from grains and grain products, 3 from milk and alternatives, 1–2 from meat and alternatives)(23).
c DQI-I overall score and component scores were adjusted for total energy intake.
d Based on χ 2 test for categorical variables and the Mann–Whitney U test for continuous variables.
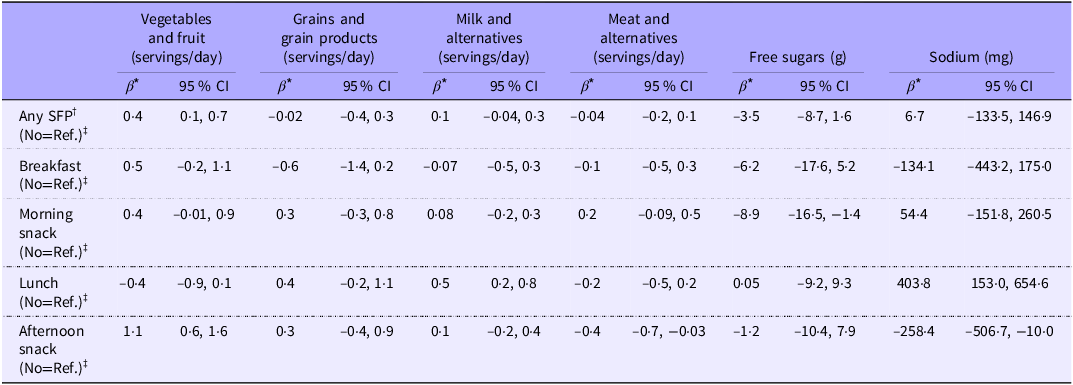
Table 3 shows the associations of SFP with daily intakes of vegetables and fruit, grains and grain products, milk and alternatives, meat and alternatives, free sugars and sodium. Compared with their peers who did not access SFP, students who accessed SFP (breakfast, lunch, morning or afternoon snack programmes) consumed more servings of vegetables and fruit per day (β = 0·4, 95 % CI = 0·1 to 0·7), particularly when accessing school afternoon snack programmes (β = 1·1, 95 % CI = 0·6 to 1·6). Compared with students who did not access SFP, those who accessed school lunch programmes consumed more servings of milk and alternatives per day (β = 0·5. 95 % CI = 0·2 to 0·8), those who accessed school morning snack programmes had lower daily intake of free sugars (β = –8·9, 95 % CI = –16·5 to −1·4) and those who accessed school afternoon snack programmes had lower daily sodium intake (β = –258·4, −506·7 to −10·0). However, accessing school lunch programmes was associated with higher daily intake of sodium (β = 403·8, 95 % CI = 153·0 to 654·6).
Association between accessing school food programmes (SFP) and student dietary intake of vegetables and fruit, grains and grain products, milk and alternatives, meat and alternatives, free sugars and sodium

Table 3 Long description
The table presents the associations of school food programs (SFP) with daily intakes of vegetables and fruit, grains and grain products, milk and alternatives, meat and alternatives, free sugars, and sodium. It includes data for students accessing different SFP programs: breakfast, lunch, morning snack, and afternoon snack. The table has six columns: Vegetables and fruit (servings/day), Grains and grain products (servings/day), Milk and alternatives (servings/day), Meat and alternatives (servings/day), Free sugars (grams), and Sodium (milligrams). Each column includes beta coefficients and 95 percent confidence intervals. Row 1: Any SFP, Beta: 0.4, 95% CI: 0.1 to 0.7, Beta: -0.02, 95% CI: -0.4 to 0.3, Beta: 0.1, 95% CI: -0.04 to 0.3, Beta: -0.04, 95% CI: -0.2 to 0.1, Beta: -3.5, 95% CI: -8.7 to 1.6, Beta: 6.7, 95% CI: -133.5 to 146.9. Row 2: Breakfast, Beta: 0.5, 95% CI: -0.2 to 1.1, Beta: -0.6, 95% CI: -1.4 to 0.2, Beta: -0.07, 95% CI: -0.5 to 0.3, Beta: -0.1, 95% CI: -0.5 to 0.3, Beta: -6.2, 95% CI: -17.6 to 5.2, Beta: -134.1, 95% CI: -443.2 to 175.0. Row 3: Morning snack, Beta: 0.4, 95% CI: -0.01 to 0.9, Beta: 0.3, 95% CI: -0.3 to 0.8, Beta: 0.08, 95% CI: -0.2 to 0.3, Beta: 0.2, 95% CI: -0.09 to 0.5, Beta: -8.9, 95% CI: -16.5 to -1.4, Beta: 54.4, 95% CI: -151.8 to 260.5. Row 4: Lunch, Beta: -0.4, 95% CI: -0.9 to 0.1, Beta: 0.4, 95% CI: -0.2 to 1.1, Beta: 0.5, 95% CI: 0.2 to 0.8, Beta: -0.2, 95% CI: -0.5 to 0.2, Beta: 0.05, 95% CI: -9.2 to 9.3, Beta: 403.8, 95% CI: 153.0 to 654.6. Row 5: Afternoon snack, Beta: 1.1, 95% CI: 0.6 to 1.6, Beta: 0.3, 95% CI: -0.4 to 0.9, Beta: 0.1, 95% CI: -0.2 to 0.4, Beta: -0.4, 95% CI: -0.7 to -0.03, Beta: -1.2, 95% CI: -10.4 to 7.9, Beta: -258.4, 95% CI: -506.7 to -10.0.
Abbreviations: SFP, school food programme.
* From multivariable models that are adjusted for gender, grade, family affluence, region, social deprivation index, material deprivation index and total energy intake.
† Any SFP group includes students who consumed at least one meal or snack provided by or purchased at school during school hours. The reference category includes students who did not consume any meals or snacks provided by or purchased at school during school hours.
‡ The reference category includes students who did not consume that specific meal or snack provided by or purchased at school during school hours.
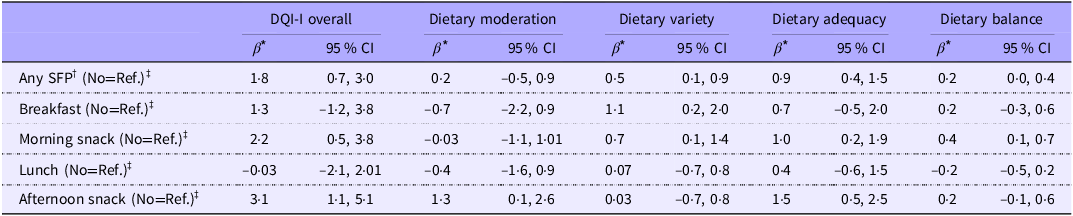
Table 4 shows the association of SFP with diet quality (DQI-I overall score and its components). Overall DQI-I was higher among students who accessed SFP compared with their peers who did not (β = 1·8, 95 % CI = 0·7 to 3·0), and this difference was particularly noticeable in students who accessed school morning or afternoon snack programmes (β = 2·2, 95 % CI = 0·5 to 3·8 and β = 3·1, 95 % CI = 1·1 to 5·1, respectively). Students who accessed SFP had higher DQI-I component scores for moderation, variety, adequacy and balance compared with their peers who did not access SFP.
Association between accessing SFP and student diet quality

Table 4 Long description
The table presents data on the association between accessing school food programs (SFP) and diet quality among students. It includes overall Diet Quality Index International (DQI-I) scores and its components: dietary moderation, dietary variety, dietary adequacy, and dietary balance. The table has 5 rows and 11 columns. Column headers are DQI-I overall, Dietary moderation, Dietary variety, Dietary adequacy, and Dietary balance, each with beta (β*) and 95 percent confidence interval (CI) values. Row labels are Any SFP, Breakfast, Morning snack, Lunch, and Afternoon snack. Row 1: Any SFP, β* 1.8, 95 percent CI 0.7 to 3.0, β* 0.2, 95 percent CI -0.5 to 0.9, β* 0.5, 95 percent CI 0.1 to 0.9, β* 0.9, 95 percent CI -0.4 to 1.5, β* 0.2, 95 percent CI 0.0 to 0.4. Row 2: Breakfast, β* 1.3, 95 percent CI -1.2 to 3.8, β* -0.7, 95 percent CI -2.2 to 0.9, β* 1.1, 95 percent CI 0.2 to 2.0, β* 0.7, 95 percent CI -0.5 to 2.0, β* 0.2, 95 percent CI -0.3 to 0.6. Row 3: Morning snack, β* 2.2, 95 percent CI 0.5 to 3.8, β* -0.03, 95 percent CI -1.1 to 1.01, β* 0.7, 95 percent CI 0.1 to 1.4, β* 1.0, 95 percent CI 0.2 to 1.9, β* 0.4, 95 percent CI 0.1 to 0.7. Row 4: Lunch, β* -0.03, 95 percent CI -2.1 to 2.01, β* -0.4, 95 percent CI -1.6 to 0.9, β* 0.07, 95 percent CI -0.7 to 0.8, β* 0.4, 95 percent CI -0.6 to 1.5, β* -0.2, 95 percent CI -0.5 to 0.2. Row 5: Afternoon snack, β* 3.1, 95 percent CI 1.1 to 5.1, β* 1.3, 95 percent CI 0.1 to 2.6, β* 0.03, 95 percent CI -0.7 to 0.8, β* 1.5, 95 percent CI 0.5 to 2.5, β* 0.2, 95 percent CI -0.1 to 0.6.
Abbreviations: DQI-I, Diet Quality Index–International; SFP, school food programme.
* From multivariable models that are adjusted for gender, grade, family affluence, region, social deprivation index, material deprivation index and total energy intake.
† Any SFP group includes students who consumed at least one meal or snack provided by or purchased at school during school hours. The reference category includes students who did not consume any meals or snacks provided by or purchased at school during school hours.
‡ The reference category includes students who did not consume that specific meal or snack provided by or purchased at school during school hours.
Discussion
In this study, we assessed the contribution of meals and snacks provided by schools to daily dietary intake and diet quality of elementary schoolchildren from two Canadian provinces. Three key findings emerge from this study. First, student diets were sub-optimal, with the majority of students not meeting the recommendations for vegetables and fruit, milk and alternatives,(23) consuming high amounts of sodium and free sugars, with the latter constituting more than 10 % of total daily energy intake. The diet quality was poor overall, and dietary balance was particularly low. Second, the availability of SFP was low, with only one in eight students having consumed meals/snacks provided by schools. Finally, students who accessed meals/snacks provided by schools consumed more vegetables and fruit, milk and alternatives, less free sugars and sodium, had free sugars and sodium and had better diet quality.
Our results are aligned with the previously reported findings that most Canadian children fail to meet the recommended intakes for vegetables and fruit(4), and a significant portion of their energy intake comes from high-fat, sugary foods(Reference Hack, Jessri and L’Abbé3). In the absence of a national SFP, the small proportion of students reporting having consumed meals/snacks provided by schools is not surprising and reflects the current SFP context in Canada. To date, the availability of existing SFP has been contingent on funding from a variety of sources (e.g., municipal, provincial/territorial governments, not-for-profit organisations and private donors), resulting in a considerable variation in the availability of meals and snacks provided by schools(Reference Riglea, Kalubi and Sylvestre32,Reference Kalubi, Riglea and Wellman33) . The SFP access in our study is similar to that reported in a national survey of 10 565 Canadian youth aged 10–17 years, whereby 12 % and 6 % of Canadian students with the highest level of food insecurity participated in school breakfast and lunch programmes, respectively, but is significantly lower than the prevalence of breakfast and lunch programmes in the USA (43 % and 56 %, respectively)(Reference Hock, Barquera and Corvalan34). With the release of the National School Food Policy in 2024 and significant steps toward developing a national SFP, it is important to monitor improvements in SFP access across Canada.
While the lack of sustained government funding may contribute to considerable variation in the availability and the quality of meals and snacks provided by schools, our findings demonstrate the SFPs’ promise: students who accessed SFP reported higher intakes of vegetables and fruit, milk and alternatives, lower sodium and free sugar intakes, as well as better diet quality. These findings are particularly encouraging, since schools that participated in this research are located in socioeconomically disadvantaged areas and serve students who are more likely to benefit from the implementation of the national SFP. While these schools generally receive more funding (in absolute terms), their needs are often more diverse and therefore outweigh the allocated funding(Reference Ruetz, Tasala and McKenna35).
Our results align with existing evidence (albeit most prior studies focus on one meal – lunch), which shows that foods brought from home are of lower diet quality and tend to have significantly more calories coming from less nutritious foods. For example, Everitt et al.(Reference Everitt, Engler-Stringer and Martin16) reported that less than half of all lunches that students brought from home contained the minimum number of servings of grain products and meat and alternatives, with only about 30 % of lunches containing a sufficient number of servings of vegetables and fruit, and less than 15 % containing the minimum number of servings of milk and alternatives. Moreover, the overall diet quality of lunches provided by schools was considerably higher than in schools without a school lunch programme, with the Healthy Eating Index of 62·01 [sd = 10·73] v. 47·68 [sd = 13·13], respectively. Tugault-Lafleur et al.(Reference Tugault-Lafleur and Black14) also demonstrated higher intakes of vegetables and fruit, fibre, vitamin C and magnesium, as well as fewer calories from sugar-sweetened beverages among students who ate school lunches. Similar findings were reported by Taylor et al.(Reference Taylor, Hernandez and Caiger15) in a sample of 1980 grade 5–6 students in Prince Edward Island, who showed that school lunches had higher nutrient densities of calcium, magnesium, potassium, zinc, vitamins A, B2, B3, B6, B12 and D and provided sufficient protein(Reference Taylor, Hernandez and Caiger15).
Our finding that accessing school lunch programmes was associated with higher consumption of milk and alternatives is not surprising and reinforces the importance of school lunch programmes in supporting optimal nutrition among students. In the absence of sustained government funding and a national SFP, schools need to balance the scale and scope of their SFP offerings, with milk often being a staple in existing SFP and snack programmes in particular, due to its high nutritional value (i.e., high protein, calcium and vitamin D content) and relatively low cost(Reference Ruetz and McKenna36). However, school lunch programmes were also associated with higher sodium intake, likely due to common lunch items such as soup or pizza being high in sodium(37), suggesting that the quality of school lunches could be improved.
Our results also highlight the importance of school snacks, with morning and afternoon snacks demonstrating the greatest potential for improving student dietary intake and diet quality. SFP – particularly school morning snack programmes – were associated with lower free sugar intake. Free sugars are well-recognised as the major contributor to diet-related diseases(Reference Zaltz, Ahmed and Vergeer38), and our findings underscore the potential of SFP to reduce student consumption of sugary snacks and beverages that are commonly included in home-packed meals and snacks. Additionally, students who accessed afternoon snacks provided by schools consumed, on average, more than one additional serving of vegetables and fruit per day, and their daily sodium intake was lower compared with those who did not access these programmes.
To our knowledge, this study is the first to collect comprehensive dietary data from more than 2300 grade 4–8 students attending elementary schools in Alberta and Ontario. Importantly, these schools are located in socioeconomically disadvantaged areas and are most likely to benefit from the implementation of a national SFP. Thus, results underscore the potential promise of implementing SFP in schools in similarly disadvantaged areas. Finally, gathering information on all meals and snacks consumed during the 24-hour period allowed us to contextualise the contribution of all meals and snacks consumed during school hours to the total daily intake, whereas studies to date have focused on a specific meal (e.g., lunch or breakfast).
Several limitations warrant consideration. Given that only 12·4 % of students reported consuming SFP, we defined SFP as having consumed at least one meal/snack either ‘provided by school’ or ‘purchased at school’. While only 24·2 % of students purchased foods and beverages at school, it encompasses purchasing foods/beverages from vending machines or other school food outlets, which often include processed and ultra-processed foods. The dietary intake and diet quality may therefore be underestimated. Moreover, it is recommended to collect at least two non-consecutive 24-hour diet recalls to obtain a more reliable estimate of usual intake, as a single recall provides only a snapshot of intake on a specific day. However, administering multiple 24-hour diet recalls in school-based research may lead to low participation rates among schools as it places additional burden on students and school administrators, who have to dedicate instructional time to research activities. Finally, study findings may not be generalisable to other jurisdictions due to differences in SFP infrastructure and population characteristics.
Despite only one in eight children having consumed SFP, we found that elementary schoolchildren who consumed meals or snacks provided by schools had higher daily intakes of vegetables and fruit, milk and alternatives, lower consumption of sodium and free sugars, and better diet quality, compared with their peers who did not access SFP. These findings highlight the potential of SFP in improving diets of Canadian schoolchildren and support further investments in the development of a national SFP(Reference Ruetz, Michnik and Engler-Stringer39), given its far-reaching benefits that go beyond providing healthful meals to students and promoting nutrition literacy and healthy eating habits(Reference Zhong, Yin and O’Sullivan40), to include improving academic performance(Reference Cohen, Hecht and McLoughlin7), increasing school attendance, promoting health equity, creating new jobs, driving economic growth and transforming food systems(Reference Ruetz, Michnik and Engler-Stringer39).
Acknowledgments
The authors thank the students, parents/guardians and school principals for their participation in the research. They further thank teachers, school health facilitators and champions, project assistants and the APPLE School staff for facilitating the research.
The Public Health Agency of Canada (grant #1516-HQ-000071), along with other partners, funded the APPLE Schools programming in APPLE Schools. The present study was supported by operating funds from the Canadian Institutes of Health Research to KM and PJV (#172 685). Analyses presented in this manuscript were funded by the Feeding Kids, Nourishing Minds, funded by a $2 million investment from President’s Choice Children’s Charity, and by the Joannah & Brian Lawson Centre for Child Nutrition at the University of Toronto. The funding sponsors had no role in the design, analysis or writing of this article. KM holds the Murphy Family Foundation Chair in Early Life Interventions.
JD: Conceptualisation, Data curation, Investigation, Methodology, Project administration, Resources, Supervision, Writing – original draft, Writing – review & editing. NG: Conceptualisation, Data curation, Investigation, Methodology, Writing – review & editing. KM: Conceptualisation, Funding acquisition, Investigation, Methodology, Project administration, Resources, Supervision, Writing – original draft, Writing – review & editing. PJV: Conceptualisation, Funding acquisition, Investigation, Methodology, Project administration, Resources, Supervision, Writing – review & editing
The authors declare none.

 Open access