


1. Introduction
Understanding how users interact with the interfaces we design for them is critical to building effective, safe and usable products. In high-value manufacturing, machine interfaces and medical equipment, this is particularly important due to the high-consequence nature of successful product interactions (ISO 2015, 2016). Across all of human-centred design, many guidelines exist to aid this investigation of users interacting with devices (ISO 2019), well utilised by specialist human factors engineers.
Typically, the design process of human factor engineers explores human interaction with prototypes through qualitative workflows, gathering user feedback from focus groups, interviews and surveys to capture data in a holistic manner (University of Cambridge 2024). These processes, while thorough, create bottlenecks in the design process due to difficulties in coalescing these insights into tangible design changes that directly improve performance and experience. While quantitative measurements of ergonomics exist, these harsh rules of thumb from anthropometrics are dated and do not take into account the dynamic interaction of users with systems. Instead, they focus on norms and averages of users, making it difficult to tangibly understand individuality in product interaction, and hence even harder to design towards it.
This is especially true when studying dexterous products and interactions. Current understanding of the link between proprioception, dexterity and cognitive ability is still developing and individual-specific, due to the large over-constrained nature of hand movements and our musculoskeletal structure (Scano et al. Reference Scano, Chiavenna, Molinari Tosatti, Müller and Atzori2018; Fan et al. Reference Fan, Taheri, Tzionas, Kocabas, Kaufmann, Black and Hilliges2023). Due to this, the importance of dexterity within current human factors investigation is under-investigated, let alone ways of measuring this in ways that create actionable information for designers.
Until recently, there has been a lack of methods that may enable this investigation. This has been limited to validation activities that act as tick-box exercises for functional interface interaction (Hunter et al. Reference Hunter, Johansen-Berg, Ward, Kennedy, Chandler, Weir, Rothwell, Wing, Grey, Barton and Leavey2018; Light, Chappell, and Kyberd Reference Light, Chappell and Kyberd2002). With the emergence of real-time data capture tools and the sensorisation of our environments, prototypes and users, we could look to quantify dexterous interaction within these interactions, providing objective insights into the products we design and the users we design for (Wang et al. Reference Wang, Zheng, Li and Chen2022). The success of utilising similar techniques in individualisation in elite athletics and clinical medicine (Le et al. Reference Le, Okereke, Nguyen, Dao, Soe, Zlatov and Le2011; Eikevåg et al. Reference Eikevåg, Auernhammer, Elverum, Dybvik and Steinert2024) suggests a significant, yet largely untapped, opportunity to apply similar data-driven analyses to a broader product design context. However, the transition from these specialised fields to everyday physical products requires a fundamental shift in how we quantify manual performance. This leaves the need to therefore (a) investigate and establish the importance of individuality in dexterous interaction and (b) establish methods by which this can even be achieved.
This paper investigates the significance of individual dexterous techniques through two experimental studies that treat dexterity as a key, measurable variable in product interaction. This investigation leverages robust hand-tracking techniques, configured to ensure the most accurate detection of dexterous and complex product interaction. Using classification tasks to recognise dexterous actions and supervised clustering to analyse variability between user techniques, we evaluate the capacity of data-driven systems to identify users’ dexterous techniques. Furthermore, we investigate whether these systems can reliably detect deviations in technique when influenced by external factors, highlighting critical considerations for real-world implementation. By comparing high-dimensional hand-tracking data with coarse performance metrics, we demonstrate how dynamic measures could provide objective insights into user performance. We propose that individual dexterous technique dominates in both constrained and unconstrained tasks, and that measurement of dexterous technique can provide real-time insights critical for the future of data-driven design and personalisation. We discuss the implications of these findings for personalised equipment design and provide recommendations for practical implementation. We look to answer the following research questions:
-
• RQ1: To what extent are user-product dexterous interactions observed to be individual to users?
-
• RQ2: How effectively can data-driven techniques recognise individual dexterous techniques during such interactions?
RQ1 investigates the manifestation of individuality through two distinct lenses: unconstrained tasks, where individual dexterous technique is expected to dominate, and constrained tasks, where the physical affordances of a tool or product limit the modes of interaction. RQ2 evaluates the fundamental capability of data-driven methods to interpret these high-dimensional manual behaviours. It challenges the efficacy of current generalised models and investigates the correlation between data-driven measurements and established external metrics to determine the potential for objective insight extraction. Furthermore, this question explores the interplay between user-state and system performance, identifying whether these techniques can reliably distinguish between product-driven and user-driven changes in performance. By doing so, we highlight the practical considerations and technical requirements for implementing such personalisation pipelines in a real-world product development workflow.
2. Related work
In order to investigate the importance of individual dexterous technique within physical product interaction and how this investigation could enhance human-centred design, this review synthesises research across four interdependent domains. First, we discuss the importance of personalisation within product design, then look at current human-centred design practice and data-driven design to identify the transition from static anthropometric models to dynamic, personalised systems. To identify how this may be achieved, we evaluate state-of-the-art technologies that could help us investigate dexterity within a product interaction context, and how these accessible systems could be leveraged to understand individuals within a physical product design context. Finally, we review how dexterity and behavioural data are currently quantified and mapped, providing a basis for interpreting high-dimensional interaction data. This will help to understand how to draw insight from collected data and its potential implications for the design of physical products.
2.1. Individuality in product design
The importance of individuality and personalisation within design is becoming increasingly recognised (Tseng, Jiao, and Wang Reference Tseng, Jiao and Wang2010). We see this primarily in high-performance and high-risk areas of design, where performance-based outcomes are critical (ISO 2015). Historically, this was addressed through static anthropometric adjustments, altering equipment to better suit the physical dimensions of an individual (Shan Reference Shan2023). In the medical field, this evolved through the use of body scanning and moulding to create bespoke implants and prostheses tailored to a patient’s unique anatomy (Le et al. Reference Le, Okereke, Nguyen, Dao, Soe, Zlatov and Le2011). In more recent years, the role of biomechanics and dynamic movement within this personalisation has become more prevalent. By recording multitudes of sensor data, impact forces and joint kinematics can be measured, allowing designers to create interventions that are ergonomically fitted, enhance performance and prevent injury (Tai, Zhang, and Zhao Reference Tai, Zhang and Zhao2023). While the importance of individual full-body movement has been well understood and captured, the role of individual dexterity in product interaction remains significantly under-researched.
It is well established that individuals possess distinct dexterous abilities (Yancosek and Howell Reference Yancosek and Howell2009a). Despite this, there is currently a lack of understanding and methods required to quantify how dexterous performance varies across user groups or to map high-dimensional manual techniques into actionable design parameters. An unaddressed opportunity exists to identify which facets of dexterous technique are critical for performance, and to determine how this understanding can be leveraged to enhance the functional outcomes of everyday physical products.
2.2. Current design practice and data-driven design
Historically, human-centred design has leaned away from sensor-integrated approaches for quantifying user experience in everyday product interaction (Kanis Reference Kanis1998). This gap has led to human-centred design methods that rely on limited quantitative data (ISO 2015) with a preference for holistic qualitative interpretations. Quantitative methods that are commonly adopted, such as anthropometry or static postural loading calculations, are often highly simplified and lack the contextual nuance required for complex and dynamic product interactions (Whitefield, Wilson, and Dowell Reference Whitefield, Wilson and Dowell1991). However, the practicalities of capturing interaction data within the physical domain have limited the extent to which data are used to guide physical product development until recent years (Bertoni Reference Bertoni2020; Briard et al. Reference Briard, Jean, Aoussat and Véron2023). Typically, this requires bespoke hardware and a large investment at an early stage of development. Even still, the development of on-body sensing techniques (Dong et al. Reference Dong, Ugalde, Figueroa and Saddik2014), smaller form factors for sensors and fewer barriers to machine learning implementation mean that utilising data to inform physical product design is becoming more accessible. This leaves unaddressed the opportunity to explore how quickly evolving sensor technologies and machine learning approaches can be integrated and utilised within human-centred design.
Leveraging these newer quantitative techniques boasts a number of advantages to the design process, and has become an emerging area of interest within both Design and HCI communities (Gorkovenko et al. Reference Gorkovenko, Burnett, Thorp, Richards and Murray-Rust2020; Gomez Ortega et al. Reference Gomez Ortega, Van Kollenburg, Shen, Murray-Rust, Nedić, Jimenez, Meijer, Chaudhary and Bourgeois2022; Lovei, Noortman, and Funk Reference Lovei, Noortman and Funk2022). First, there is an increased robustness methodologically by incorporating quantitative and qualitative methods alongside one another through triangulation (Greene, Caracelli, and Graham Reference Greene, Caracelli and Graham1989). In (Ormerod et al. Reference Ormerod, Shortt, Fraser and Snider2025), this is explored for contrasting ergonomic setups, demonstrating that data can be utilised to steer and direct conversation for particular facets of interaction. Second, in scenarios where outcomes rely on highly personalised design, the usage of data to supplement an already well-known interaction can lead to large performance gains. In (Silseth et al. Reference Silseth, Sletten, Grøndahl, Eikevåg and Steinert2021; Sletten et al. Reference Sletten, Eikevåg, Silseth, Grøndahl and Steinert2021; Eikevåg et al. Reference Eikevåg, Grøndahl, Sletten, Silseth and Steinert2022), body tracking systems and sensorised prototypes are utilised to conclude athletic performance and altering the equipment to suit specific athlete needs. Here, the fast design iterations allowed by rapid prototyping and the addition of quantitative data alongside qualitative insight allowed for more iterations and therefore better products (Knott Reference Knott2001). In these instances, the translation of data into design remains heavily dependent on the subjective interpretation of domain experts. Bridging the divide between high-dimensional measured data and actionable design changes is often prohibitive, as physical design necessitates specialised analytical approaches to decode the complexities of user variation and technique. Consequently, there is a need for more systematic, data-driven methods that can objectively interpret these nuances to inform the design process without relying solely on expert intuition.
Lessons for this approach can be drawn from software design and interface personalisation. In the field of user interface (UI) personalisation, real-time performance measurements are leveraged to construct behavioural user profiles, which subsequently inform recommendations for enhanced user experience and efficiency. For instance, (Conati et al. Reference Conati, Carenini, Toker and Lallé2015) demonstrated that integrating user-specific behavioural data, such as eye-tracking, with coarse performance metrics and user preferences was essential for developing adaptive interfaces that facilitate task learning. Similarly, (Hussain et al. Reference Hussain, Ul Hassan, Muhammad Bilal, Ali, Afzal, Hussain, Bang, Banos and Lee2018) highlighted the potential of multimodal data to drive adaptive visualisations, while (Khamaj and Ali Reference Khamaj and Ali2024) utilised reinforcement learning to dynamically update interface features based on real-time user engagement. Despite these advancements in the digital realm, a significant knowledge gap persists regarding the translation of these principles to the physical domain. Unlike software interfaces, which benefit from established metrics of engagement, physical product design lacks methods of investigation that reliably detect and quantify product interaction performance in a way that is actionable for personalisation. Before automated adaptation can be realised in physical products, it is first necessary to establish whether data-driven systems can consistently detect subtle shifts in user technique and, to what extent these variations are significant in the context of ergonomic and functional outcomes.
2.3. Technologies for data-driven dexterity capture
Hand-tracking provides a robust starting point for identifying granular shifts in user behaviour, supported by a wealth of high-fidelity sensing methods. Innovation in this space has been accelerated by extensive open-source datasets (Bambach et al. Reference Bambach, Lee, Crandall and Yu2015; Zimmermann et al. Reference Zimmermann, Ceylan, Yang, Russell, Argus and Brox2019; Taheri et al. Reference Taheri, Ghorbani, Black and Tzionas2020; Liu et al. Reference Liu, Liu, Jiang, Lyu, Wan, Shen, Liang, Fu, Wang and Yi2022) and recent hand-only tracking systems (Moon et al. Reference Moon, Yu, Wen, Shiratori and Lee2020; Han et al. Reference Han, Wu, Zhang, Liu, Zhang, Wang, Si, Zhang, Cai, Hodan and Cabezas2022; Google AI Edge 2024) that eliminate the need for bespoke skeletal models and labelling. However, current optical models frequently underperform in product interaction scenarios due to severe object occlusion. While non-optical alternatives such as acoustic, infrared or EMG-based sensing (Mcintosh Reference Mcintosh2016; McIntosh et al. Reference McIntosh, McNeill, Fraser, Kerber, Löchtefeld and Krüger2016; McIntosh, Marzo, and Fraser Reference McIntosh, Marzo and Fraser2017; Lee et al. Reference Lee, Zhang, Agarwal, Yu, Gunda, Lopez, Kim, Yin, Dong, Li and Sakashita2024) offer occlusion resistance, they require bespoke hardware that lacks the scalability required for a practical product design workflow. Consequently, there is a need to configure existing, accessible tracking techniques to maintain reliability during complex object manipulation without relying on high-cost or specialised sensors.
Beyond technical capture, there is a distinct lack of tools and methodologies suited for analysing interaction within a physical product design context. Most existing hand–object interaction datasets and taxonomies focus on activities of daily living (ADLs) and rely on pre-existing object databases or markers (Bullock, Feix, and Dollar Reference Bullock, Feix and Dollar2015; Zimmermann et al. Reference Zimmermann, Ceylan, Yang, Russell, Argus and Brox2019; L. Zhang et al. Reference Zhang, Zhou, Stent and Shi2022; Fan et al. Reference Fan, Taheri, Tzionas, Kocabas, Kaufmann, Black and Hilliges2023; Banerjee et al. Reference Banerjee, Shkodrani, Moulon, Hampali, Zhang, Fountain, Miller, Basol, Newcombe, Wang and Engel2024), making them poorly suited for the evaluation of developing physical prototypes. Object masking techniques, such as those created in (Haleem et al. Reference Haleem, Javaid, Singh, Rab, Suman, Kumar and Khan2022; Wyrley-Birch et al. Reference Wyrley-Birch, Kukreja, Gopsill, Cox and Snider2024), could be used to create scans of new objects; reliable usage for six degrees of freedom tracking is still under development. Gesture and action recognition systems can be easily implemented with the techniques mentioned, such as those in (G. Moon et al. Reference Moon, Yu, Wen, Shiratori and Lee2020; Han et al. Reference Han, Wu, Zhang, Liu, Zhang, Wang, Si, Zhang, Cai, Hodan and Cabezas2022; Google AI Edge 2024); however, current systems are optimised to generalise across populations rather than investigate unique dexterous techniques that define how an individual interacts with a product. There is no clear extant research demonstrating a viable, flexible method for deconstructing these interactions in a way that captures both the specific actions performed and the inherent variability of the individual user.
2.4. Evaluating dexterity and product interaction
Defining and measuring individual dexterity remains a significant challenge, due to the multifaceted nature of human motor control. Traditional evaluative tools, such as the Purdue Pegboard (Tiffin and Asher Reference Tiffin and Asher1948) or Minnesota Manual Dexterity tests (Desrosiers et al. Reference Desrosiers, Rochette, Hebert and Bravo1997), isolate mechanical manipulation by stripping away the cognitive and sequential complexities inherent in real-world product interaction (Yancosek and Howell Reference Yancosek and Howell2009b). Modern dexterity is increasingly understood as a complex interplay of proprioception, motor control and cognitive task awareness (Bullock, Ma, and Dollar Reference Bullock, Ma and Dollar2013), making it difficult to quantify via traditional ergonomic goals like musculoskeletal stress reduction. Furthermore, the highly variable, over-constrained nature of muscle synergies leads to little overlap in strategy between individuals (Scano et al. Reference Scano, Chiavenna, Molinari Tosatti, Müller and Atzori2018; Jarque-Bou et al. Reference Jarque-Bou, Scano, Atzori and Müller2019). In addition to this, poor dexterity may manifest heterogeneously as high tremor (Bhatia et al. Reference Bhatia, Bain, Bajaj, Elble, Hallett, Louis, Raethjen, Stamelou, Testa and Deuschl2018), reduced range of motion, general coordination (Térémetz et al. Reference Térémetz, Carment, Brénugat-Herne, Croca, Bleton, Krebs, Maier, Amado and Lindberg2017; Bieber et al. Reference Bieber, Smits‐Engelsman, Sgandurra, Martini, Basu, Guzzetta, Cioni, Feys and Klingels2026), grasp stability and security (Cutkosky Reference Cutkosky1989) or excessive muscle activation. Interpreting this from high-dimensional hand-tracking data is no simple task, and thus there is a need for a more granular, behavioural approach that moves beyond simplistic industrial metrics to capture the individual techniques of users.
Parallel to the difficulty of defining dexterity is the challenge of objectively quantifying product performance. Current assessment frameworks rely on a disparate mix of heuristic scores, such as the Rapid Upper Limb Assessment (RULA) (Trent et al. Reference Trent, Intintoli, Prigge, Bollinger, Walters, Conyers, Miguelez and Ryan2020), and coarse functional measures like the Southampton Hand Assessment Procedure (SHAP) (Light et al. Reference Light, Chappell and Kyberd2002), which are often insufficient for detecting the subtle nuances of everyday products and handheld devices. Some work, such as the development of specific grasp taxonomies or dynamic grasp quality measures, could prove useful (Sharma, Roo, and Steimle Reference Sharma, Roo and Steimle2019; Zhao et al. Reference Zhao, Wu, Xu, He, Serrano and Roudaut2024), but ultimately the flexibility of these methods makes them highly context dependent and difficult to generalise across tasks and domains. A critical gap exists in understanding whether dynamic, high-dimensional behavioural data can be turned into tangible design insights. To establish a necessary foundation, an investigation is required into how individual dexterity materialises within interaction data and how these patterns correlate with product performance metrics.
2.5. Summary
The related research showcases that there is an opportunity to better understand how individual dexterity materialises in product interaction. Although distinct dexterous abilities are well-documented, there is a lack of methods within human factors that would let us quantify how individual dexterous techniques vary across user groups. Lessons from software and interface personalisation demonstrate the utility of real-time behavioural user profiles. However, a significant gap exists in translating these principles to physical interaction, and in established metrics of usability and performance that could facilitate automated adaptation in tangible products. While high-fidelity hand-tracking systems exist, they are often optimised for population-wide generalisation rather than the identification of unique, individual techniques. Traditional ergonomic evaluative tools are insufficient for capturing complex dexterous interaction. There remains a critical need for granular, behavioural approaches that can objectively interpret high-dimensional data to draw tangible insights regarding product performance and user technique. By addressing these challenges, this research looks to bridge the divide between raw behavioural data towards evidence based, personalised physical products. This investigation follows a data-driven approach to determine whether subtle shifts in user technique can be consistently detected and utilised to enhance functional outcomes.
3. Method
This study employed a two-scenario experimental design to investigate the nuances of dexterous hand–object interaction. Scenario 1 targeted unconstrained interaction, whereby users are instructed to complete rearrangement tasks with simple objects. The objects provide minimal indication of how they should be interacted with, allowing this scenario to investigate user-led individual technique where both the object and task minimally constrain their interaction. Scenario 2 provided constraints in two ways. First, it employs an object with a clear function and behaviour, thereby constraining via familiarity. Second, it investigates variance in interface, thereby constraining the way in which a user is able to grasp the object. By being activity-focused, Scenario 2 also allows the application of external measures (namely fatigue and task performance) to investigate correlation against data-driven outputs. In both cases, we derive potential ergonomic measurements based on current ergonomic practice, relating these to coarse task performance measurements to understand how high-dimensional data interpretation reflects current theory. By performing this series of studies, this work considers both free interaction and task-focused interactions and the impact of objects on users, and hence, a comprehensive investigation of individual dexterity. This also provides several cases against which to investigate the capability of data-driven methods.
3.1. Participants
Twenty-five participants were recruited for this study (9 female, 16 male, 7 left-handed (LH), 18 right-handed (RH); ages 20–48). This sample size was deemed comparable to studies that utilise similar strategies, analysing inter-individual variation (McIntosh et al. Reference McIntosh, McNeill, Fraser, Kerber, Löchtefeld and Krüger2016). Inclusion criteria were:
-
• No upper limb deficiency or conditions that affect dexterity
-
• Normal or corrected-to-normal vision
-
• Proficient in written and spoken English
-
• Age range 18–65
All participants understood spoken and written English. Recruitment was voluntary via an online noticeboard, and participants received a gift certificate upon completion of the study as an incentive. All participants participated in both scenarios. Any artefacts that could induce occlusion (e.g. rings, jewellery or watches) were removed prior to experiment commencement. While participant performance metrics were recorded, a detailed analysis of participant characteristics and prior tool experience was omitted from the current scope. Although such data are illustrative of the types of deeper demographic analysis the pipeline can support, it was not required to address the primary research questions of this study.
3.2. Apparatus and materials
As discussed in the Related Work, the majority of high-fidelity 3D hand-pose estimators utilise triangulation from multiple camera sources (Cao et al. Reference Cao, Hidalgo, Simon, Wei and Sheikh2019; Jiang et al. Reference Jiang, Lu, Zhang, Ma, Han, Lyu, Li and Chen2023) to achieve 3D positioning. While this is essential for visualisation and reconstruction, in the context of task classification and investigating task variation, this additional triangulation step only adds further abstraction between the tasks that were performed and what was fed into the classification tasks. In addition to this, the large amounts of occlusion that occur due to the different objects and tools that were held meant that this investigation still benefited from a multi-camera approach.
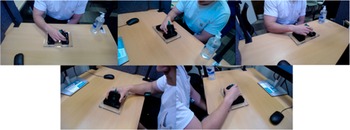
We therefore assembled a high-fidelity hand-tracking platform that was capable of delivering sufficiently continuous, precise and comparable data. The hand-tracking setup pictured in Figures 1(a) and 2 consisted of five C922 PRO HD Stream Webcams, recording footage at 1080p at 30 FPS. The video footage was synchronised and recorded through OBS Studio. Participants were also equipped with wireless EMG sensors placed over the anterior forearm to verify that participants were sufficiently fatigued (J. Wang et al. Reference Wang, Pang, Yu, Tang, Xiang and Ju2021; Biometrics 2024; Okwumabua, Sinkler, and Bordoni Reference Okwumabua, Sinkler and Bordoni2024). Alongside the recorded videos of both scenarios, participants’ ages and dominant hands were also recorded. Throughout the study, participants remained seated for consistency (Figure 2).
(a) Hand-tracking camera and monitor setup. (b) MediaPipe hand-tracking marker locations.

Multiple camera views of the participant.

3.3. Data acquisition and processing
Each participant’s video footage was separated by camera view and per task, with each stream then input into the Mediapipe 2D hand-tracking model, with multiple streams limiting the effects of occlusion and reducing error (Google AI Edge 2024). MediaPipe has been shown to exhibit a root-mean-squared-error of 0.28 +/−0.064 normalised px (Wagh, Scott, and Kraeutner Reference Wagh, Scott and Kraeutner2023), achieving 95.7% with palm detection. While 2D data were fed into the later analytical tools, 3D pose estimation was conducted using RTMPose (Jiang et al. Reference Jiang, Lu, Zhang, Ma, Han, Lyu, Li and Chen2023), calibrating camera views using the Pose2Sim pipeline (Pagnon, Domalain, and Reveret Reference Pagnon, Domalain and Reveret2022), to aid visualisation of tasks in this paper. The output of this hand tracking, therefore, resulted in 21 x and y coordinates key points for each hand (see Figure 1(b). Coordinates were normalised relative to the wrist, which was set as the origin, with the remaining 20 x,y coordinates then recorded for each frame. This helped to account for anthropometric changes between participants. Each camera recorded at this fidelity, totalling 400 dimensions of data per participant per frame (5 cameras × 40 data points (x,y) × 2 hands). These were separated accordingly in the analysis into LH and RH participants, then separated by hand again.
3.4. Experimental design and procedure
To limit the effect of users’ prior domain-specific expertise or varying levels of task familiarity, application-agnostic tasks were designed. This neutral design allows for a fundamental assessment of dexterous technique and individual variability without the bias of professional training. Despite their abstracted nature, these tasks were designed to simulate the high-precision motor requirements found in microsurgical skills, PCB component assembly and the operation of specialised medical devices. These sectors are characterised by highly dexterous techniques, where repetitive strain or minor deviations in technique can significantly impact performance and long-term musculoskeletal health (Buckle and Devereux Reference Buckle and Devereux2002).
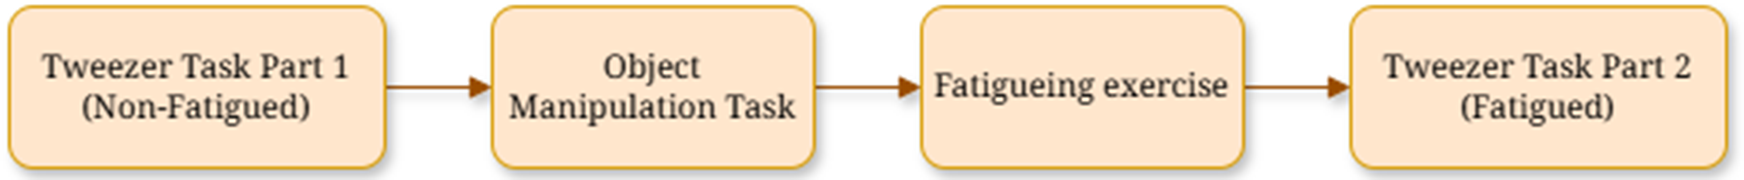
The two tasks were not performed sequentially. Since Scenario 2 explored fatigue, this was split into two, performing the first half of Scenario 2 prior to Scenario 1, to ensure no fatigue was present. The second half of Scenario 2 was completed after Scenario 1, to introduce an additional fatigue component, as shown in Figure 3. Scenario 1 involved two tasks in total, and Scenario 2 involved eight tasks. The tasks for each scenario are described in detail below.
Study and scenario flow chart.

3.4.1. Scenario 1: Inter-user differences – object manipulation task
Scenario 1 investigated the dexterous differences between participants. Here, several dexterous tasks were devised with differing levels of scale and manipulation complexity, promoting participants to complete tasks with fine dexterous adjustments that are likely difficult to repeat exactly from user to user. A dexterity test board was adapted from (Elangovan et al. Reference Elangovan, Chang, Gao and Liarokapis2022), focusing on object reorientation and fine manipulation tasks. The objects were labelled from 1–9, starting from the top left corner of the board.
Participants were asked to flip objects in a random order, repeating this until every object on the board had been flipped twice (eight repetitions for nine objects, completed for both the dominant and non-dominant hands) as shown in Figures 4 and 5. Unsuccessful task completions were removed, such as participants dropping objects in an uncontrolled manner. In this specific task, only one-handed operations were considered. Half the participants started the task with their dominant hand, repeating with their non-dominant and half started with their non-dominant hand.
(a) Dexterity Test Board with 4 of each object (b) Example action for object 9.

Example 3D movement visualisation for Scenario 1: Participant 5.

3.4.2. Scenario 2: Intra-user differences – tweezer task
Scenario 2 aimed to investigate the ways in which dexterous differences materialised for specific individuals, regarding ergonomic changes in equipment and their fatigue level. These factors were chosen for their direct relevance to real-world applications. For instance, detecting subtle performance shifts when equipment is altered is essential for evaluating prototypes in product development. In parallel, identifying changes in dexterous technique due to fatigue could enable interventions to reduce its impact on performance.
To isolate effects precisely, a repetitive task designed to limit dexterous adjustments needed to perform the task was used. The use of tweezers in dexterity tests has been used to assess dexterity and hand–eye coordination skills within the surgical field, tying their usage in this task closely to potential applications of this work in high-precision tasks (Brandy Reference Brandy1995; Levanon et al. Reference Levanon, Lugassy, Pilo, Nassar, Mhana, Maria, Willy and Brosh2023). Participants were asked to repeat tasks (here, tweezing actions), this time altering the ease of use in two ways. First, the ergonomics of the tweezers were altered, increasing the finger span required to operate them. Second, we induced muscle fatigue in the latter half of the experiment, aiming to alter participants’ dexterous technique (Enoka and Duchateau Reference Enoka and Duchateau2008).
Four task iterations were performed. For the first iteration, participants were asked to use tweezers to move as many M2 nuts (Diameter = 4 mm) from one container to another within a 1-minute period, as shown in Figures 6(a) and 7. For the second task iteration, this was repeated using the Large Tweezers, which were the same length as the Small Tweezers, but included an additional 3D printed attachment to increase the grip width from 12 mm to 112 mm. This will be referred to as a change in equipment condition. After these initial two task iterations, participants completed a fatiguing exercise and were instructed to squeeze a grip trainer, as shown in Figure 6(b), as tightly as possible for 2 minutes, instigating a change in fatigue condition. The third and fourth permutations were then completed by repeating the tasks with the small and large tweezers again while fatigued. Fatigue was verified using the EMG sensors. Participants were allowed to proceed when the root mean square (RMS) of the EMG signal dropped to 70% of the original signal amplitude, measured at the start of the fatiguing exercise (J. Wang et al. Reference Wang, Pang, Yu, Tang, Xiang and Ju2021). This task was completed for the participant’s dominant hand only.
(a) Test equipment used in Scenario 2, Large tweezers (Left) and small tweezers (Right). (b) The grip trainer participants used in the fatiguing exercise.

Example 3D movement visualisation for Scenario 2: Big tweezers.

3.5. Analysis approach
To answer our research questions, a two-pronged analytical approach was employed. First, to validate the measurement system and test its ability to generalise to new users, a classification model was trained on hand-tracking data. Second, to directly investigate the primary source of variation in the data, either the user or the task, a supervised clustering technique to quantify the separability of the movement patterns was utilised. Each approach is detailed below. In both cases, data from all participants were aggregated into a dataset, with labelled task completions and other criteria important for classification (handedness, fatigue state, task, user ID). Data were separated for LH and RH participants and treated separately due to their differing dexterous abilities (Hodges and Adams Reference Hodges and Adams2007).
3.5.1. Data-driven method validation
In order to validate the designed setup’s ability to interpret dexterous technique, the hand-tracking data gathered was then fed into a classification algorithm, aiming to classify between different tasks performed. To highlight where individual differences contribute to this result and to consider real-world applications, three different classification training splits were used. First, within-participant classification was performed, representing system performance if individual calibration was performed. Next, all participants’ data were utilised in training to increase the amount of training data available and explore what effect this has on classification performance. Finally, to explore system generalisability to new users, a leave-one-group-out approach (LOGO) was explored as implemented in (McIntosh et al. Reference McIntosh, McNeill, Fraser, Kerber, Löchtefeld and Krüger2016).
While hand tracking typically requires complex architectures to interpret gestures and skeletal points from videos, the usage of MediaPipe to pre-process skeletal position simplifies the classification needed to interpret hand–object interactions. While MediaPipe offers its own customisable gesture recognition model (Google AI Edge 2024), this does not offer support or interpretation of multi-camera systems – meaning a new classification approach had to be taken. In (Shen et al. Reference Shen, Dudley, Mo and Kristensson2022) and (Devineau et al. Reference Devineau, Moutarde, Xi and Yang2018), both CNN and LSTM components are utilised to interpret spatial and temporal features of skeletal data, stating that the LSTM components were useful in interpreting the temporal information of hand movements. However, in this multi-camera setup, the reliance on temporal features is more convoluted, as the successful generation of a skeletal model is task- and object interaction-specific. It was found that these components yielded minimal gain in classification accuracy, and instead, a simplistic learning approach was taken.
To allow for a fair comparison of classification performance, the same RandomForests network ( $ {n}_{estimators} $
= 100, Stratified 5-fold split) was used, using a scikit-learn implementation (Pedregosa et al. Reference Pedregosa, Varoquaux, Gramfort, Michel, Thirion, Grisel, Blondel, Prettenhofer, Weiss, Dubourg and Vanderplas2011). This method allowed for reasonably quick training from the collected dataset, representative of the suggested use case of such a pipeline. Ensemble methods display robustness to noisy and redundant data, such as camera angles that may be occluded, and their ability to deal with high-dimensional data (Hastie, Tibshirani, and Friedman Reference Hastie, Tibshirani, Friedman, Hastie, Tibshirani and Friedman2009). For LOGO classification, the user pool was separated randomly (90:10 split), training and then testing on the 10% of unseen participants, repeating this five times. The dexterous events that are discussed in the studies below were labelled using BORIS (Behavioural Observation Research Interactive Study) (Friard Reference Friard2024). The labelling excluded any unsuccessful task completions. Only labelled events were utilised, discarding transitions between different objects and further smaller adjustments participants made to equipment.
$ {n}_{estimators} $
= 100, Stratified 5-fold split) was used, using a scikit-learn implementation (Pedregosa et al. Reference Pedregosa, Varoquaux, Gramfort, Michel, Thirion, Grisel, Blondel, Prettenhofer, Weiss, Dubourg and Vanderplas2011). This method allowed for reasonably quick training from the collected dataset, representative of the suggested use case of such a pipeline. Ensemble methods display robustness to noisy and redundant data, such as camera angles that may be occluded, and their ability to deal with high-dimensional data (Hastie, Tibshirani, and Friedman Reference Hastie, Tibshirani, Friedman, Hastie, Tibshirani and Friedman2009). For LOGO classification, the user pool was separated randomly (90:10 split), training and then testing on the 10% of unseen participants, repeating this five times. The dexterous events that are discussed in the studies below were labelled using BORIS (Behavioural Observation Research Interactive Study) (Friard Reference Friard2024). The labelling excluded any unsuccessful task completions. Only labelled events were utilised, discarding transitions between different objects and further smaller adjustments participants made to equipment.
3.5.2. Analysing individuality
To explore how individuality materialised across the two studies, various approaches from software interface personalisation were drawn upon, utilising clustering as a tool to explore participant variance. Since the data collected in this experiment are of high dimensionality, supervised sub-space clustering is utilised (Oyewole and Thopil Reference Oyewole and Thopil2023), using LDA (n = 2) (Hastie et al. Reference Hastie, Tibshirani, Friedman, Hastie, Tibshirani and Friedman2009) to maximise the separability of the data. This supervised technique was chosen to compensate for the noisy and high-dimensional data collected while providing distinction between users or tasks that would not be apparent in unsupervised methods. Here, the high-dimensional data are projected into a lower-dimensional space, while maximising the separability between predefined classes, such as individuals or tasks. This revealed distinctions in participant behaviour or task patterns, enabling an evaluation of whether interaction modalities are more user-dependent or task-specific in the context of this study. In both scenarios, participant data are split by participant to express the separability between individuals, evaluating if there are user-dependent modalities of interaction present. Participant data were also split by task, evaluating the separability of the different tasks. This separability is then described by analysing the dimensionality-reduced data. To compare each scenario with a differing number of clusters, the silhouette score of the clusters produced was recorded (Rousseeuw Reference Rousseeuw1987).
3.5.3. Participant performance
Measures of participant performance were collected and analysed alongside different features of hand-tracking data in order to investigate how these correlated with one another, and showcase how meaning could be drawn from high-dimensional hand-tracking data. Coarse metrics on user performance (e.g. time taken, number of completed actions) were collected and analysed for each scenario to validate the differences that each condition made to users. After each task was completed, participants also completed a NASA-TLX survey, measuring the subjective mental workload of the task (Hart and Staveland Reference Hart and Staveland1988). For both scenarios, different measures were taken from the hand-tracking data. A comparison between the different setups is taken in each scenario, and the significant differences in the coarse metrics, NASA-TLX and derived participant performance measures are compared against one another. A diagram of the full pre-processing pipeline is provided in Figure 8.
-
• Scenario 1 – High movement variability and non-linear kinematic paths are established indicators of reduced dexterous ability (Stergiou and Decker Reference Stergiou and Decker2011). In the unconstrained environment of Scenario 1, this metric provides an objective estimation of participant performance and motor control stability. This is compared against the time of completion for the fixed number of tasks presented and compared between the LH and RH iterations.
-
• Scenario 2 – Postural Deviation: Consistent with ergonomic assessment frameworks such as RULA (Trent et al. Reference Trent, Intintoli, Prigge, Bollinger, Walters, Conyers, Miguelez and Ryan2020), deviation from a neutral hand position increases the risk of musculoskeletal disorders and accelerates the onset of fatigue. Given the lack of formal scoring models for finger abduction in traditional ergonomics, a holistic measure of finger spread was implemented. This was quantified by measuring the angle between the forefinger and thumb metacarpophalangeal (MCP) joints using top-down camera data to assess the ergonomic toll interactions. The other angles of the carpometacarpal (CMC) and interphalangeal (IP) joints of the thumb, alongside the proximal interphalangeal (PIP) and distal interphalangeal (DIP) joints for the remaining fingers, were also recorded. This is compared against the number of complete and successful task completions, and compared between the small and large tweezers, as well as the non-fatigued and fatigued states.
Pre-processing Diagram. After filtering, the video streams were labelled using BORIS. Three separate analysis streams were undertaken: Classification, linear discriminant analysis and participant performance analysis.

4. Results
4.1. Scenario 1: Results
For each participant, each flipping task was repeated eight times for each hand (8 actions × 25 participants × 2 hands × 9 objects = 3600 actions). The dataset was separated to capture movements from participants’ dominant and non-dominant hands and across LH and RH interactions.
4.1.1. Data-driven method validation: Classification
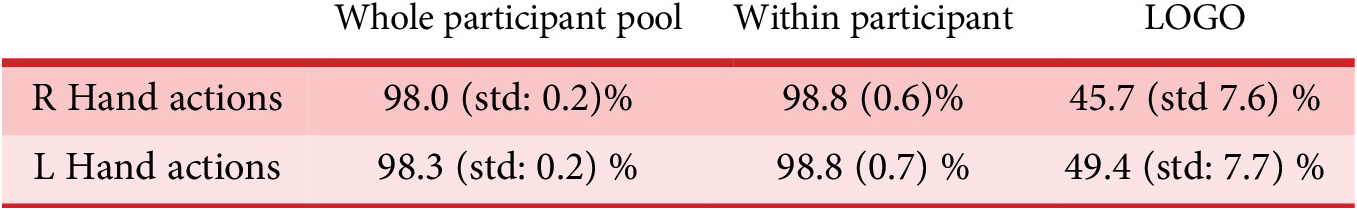
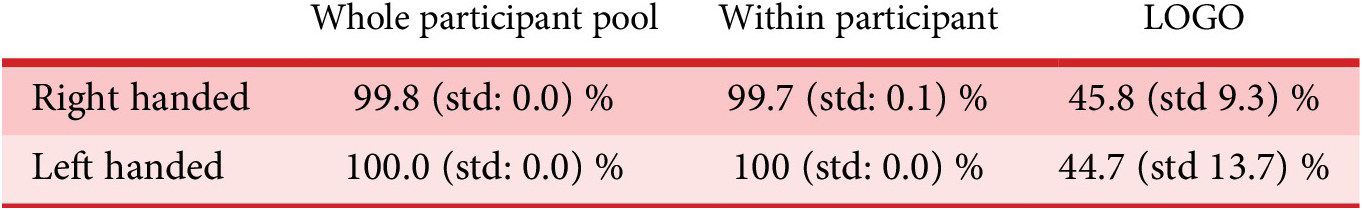
The dataset was separated into LH and RH movements for the classification stage. The results of all participants, within-user and LOGO training splits, are stated in Table 1, showing the classification between the different tasks performed. Here, higher classification success denotes a higher ability for the classification approach to determine the action from the hand-tracking data.
Classification rates for Scenario 1

Both the whole participant pool and within participant classification yield high classification with low standard deviation between cross-validation splits. LOGO accuracy is considerably lower, with an elevated standard deviation. This lower LOGO accuracy indicates a high amount of variability in how individuals completed this task, implying a dominance of individual dexterous technique in unconstrained tasks.
4.1.2. Analysing individuality: Linear discriminant analysis
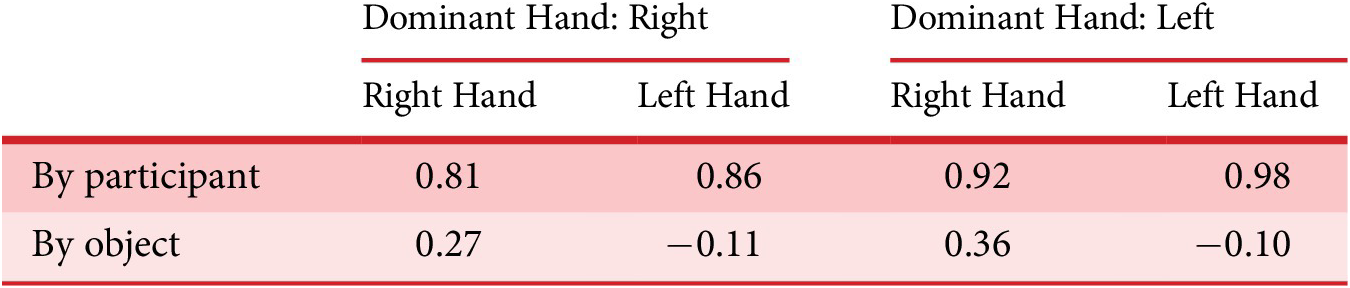
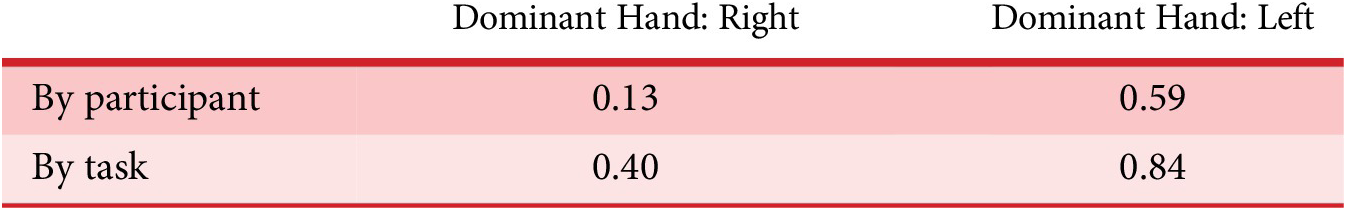
Linear discriminant analysis (LDA) was used, using participant number (by participant) and object number to express separability among the participant pool. Depending on the method of classification, this supervised learning technique helps determine how unique and distinguishable one person’s movement data are from another, and equally how unique and distinguishable tasks are from one another. A low silhouette score would indicate low separability and, therefore, high similarity. All calculated silhouette scores are shown in Table 2, with examples of the LDA splits shown for RH participants in Figures 9 and 10.
Silhouette scores for Scenario 1

Linear discriminant analysis by participant for Scenario 1, shown for RH participants.

Linear discriminant analysis by object for Scenario 1, shown for RH participants.

The silhouette scores calculated on the LDA by participants, as demonstrated in Figure 9, show a high separability between participants, with this being more apparent when individuals use their non-dominant hands to complete hand–object interactions. For LDA by object, as shown in Figure 10, the silhouette score calculated is considerably lower in all cases, indicating a lower separability among tasks. Again, this is lower still for non-dominant hand interactions.
4.1.3. Participant performance
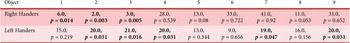
For Scenario 1, a comparison of dominant and non-dominant handed task performance was made, using task completion time as a metric of performance. The completion time of tasks was recorded, and the average time of completion was recorded for each object and for each hand (9 objects × 2 hands = 18 measures). A Wilcoxon Signed-Rank Test was applied to understand whether performance varied significantly when participants performed tasks with their dominant or non-dominant hands; the results are displayed in Table 3. For RH users, there was a significant increase in time completion for objects 1,2,3 (p $ < $
0.02). For LH users, a significant increase in task completion time was witnessed for objects 2,3,4,7,9 (p
$ < $
0.02). For LH users, a significant increase in task completion time was witnessed for objects 2,3,4,7,9 (p $ < $
0.05). The p-values and significance values of the NASA-TLX survey are shown below in Table 4.
$ < $
0.05). The p-values and significance values of the NASA-TLX survey are shown below in Table 4.
Statistical values and significance values between dominant and non-dominant handed object interactions in Scenario 1

NASA-TLX Significance Values for Scenario 1 between dominant and non-dominant hands

Overall, the only significant change across dominant and non-dominant hands was for the perceived success of the task, with participants perceiving they were less successful using their non-dominant hands. To see how this materialised in hand tracking features, the variance of the hand-tracking positional data was analysed, serving as a proxy for hand control and coordination. Levene’s test was used, showing variance in non-dominant hands was significantly higher for all shapes across all participants (p $ < $
0.05).
$ < $
0.05).
4.1.4. Analysis
The results in Scenario 1 show that there is a high level of individuality present within the described object interactions and that dexterous technique varies greatly across the participant pool. The classification task also indicates an accurate system, capable of detecting complex and dexterous object interactions and validating our hand-tracking technique. The metrics on participant performance exemplify that real-time hand-tracking features reflect the changes in performance as observed by coarse performance metrics, showing these could be used to measure real-time performance.
The high silhouette scores calculated for LDA by participants indicate there is a large separability between participants. However, this is not the case for LDA by object, finding that there is less separability between objects, particularly for non-dominant hand interactions. Both of these findings, along with a low LOGO accuracy, indicate that individual dexterous technique is the driving factor behind the classification for dexterous tasks. As discussed later, this showcases that there may be significant value in designing for specific users’ individual dexterous abilities, particularly for critical and high-consequence interactions (i.e. surgical interventions and safety-critical interfaces), and assistive technologies. In addition to this, there is a high standard deviation between different LOGO folds, potentially indicating that some participants may observe more or less similarity to one another as observed by the differing Euclidean distances between users. However, simplifying the high number of features into a low-dimensional visualisation means interpreting what encourages these close distances is a non-trivial task.
The classification task demonstrates the development of a system that can accurately interpret hand–object interaction for fine-dexterous interactions with a variety of manipulation complexities. However, it struggles to generalise to new user information as demonstrated by the low LOGO accuracy. The confusion matrix shown in Figure 11 shows a typical confusion matrix for a LOGO fold, with high confusion between shapes of similar scales, as well as some confusion between shapes of similar orientation complexity. This suggests the system struggles to interpret fine fingertip movement and the differences in orientation complexity. While low accuracy could be attributed to an insufficient amount of training data, the high within-participant classification rate demonstrates that this is not the case, and rather the variability between user techniques and variation is the cause for low classification. This demonstrates that individual technique dominates even in these simplistic interactions. This is likely due to the highly over-actuated muscle systems that control our dexterity, resulting in a high amount of individuality in the way we perform dexterous interaction (Bernstein Reference Bernstein1967). Hence, a one-size-fits-all approach for recognising actions in this context would create solutions that conflict with rather than accommodate the ingrained dexterous strategies of individual users.
Example confusion matrix results for the LOGO analysis split.

Participant performance was quantified using average time-completion as a metric, finding that performance was significantly impacted by the dominant and non-dominant hands in some cases. This was reflected in the variance of the hand-tracking positional data, finding there was a significant difference across all shapes for LH and RH participants. Both coarse and hand-tracking features show that a difference in performance occurred; this only materialised as a perceived decrease in task success in the NASA-TLX survey. In a more applied scenario, task learning effects, equipment familiarity, affordance and time of usage would play a big role in participants’ subjective workload. The effect of how this then materialises within hand-tracking features, where coarse metrics of performance are more difficult to obtain, could prove fruitful. Here, only variance is looked at, but within gesture classification, there are many features that prove useful for learning that could be investigated in this context (Devineau et al. Reference Devineau, Moutarde, Xi and Yang2018).
4.2. Scenario 2: Results
Each of the 25 participants recorded 1 minute of footage for each of four tasks, totalling 104 minutes of footage. Each time an M2 nut was picked up, an event was recorded, totalling 3076 events across the whole participant pool. Two RH participants’ data had to be discarded within this scenario due to technical difficulties (n = 23, RH = 16, LH = 7).
4.2.1. Data-driven method validation: Classification
We conducted a LOGO analysis to determine the iteration a participant was completing throughout the experiment. Classification was completed using hand-tracking data, as displayed in Table 5, separated into LH and RH participants.
Classification rates for Scenario 2

Similarly to Scenario 1, a high whole participant pool and within participant classification accuracy is achieved. However, LOGO analysis is significantly lower, with a high standard deviation observed, indicating that it is difficult to determine through classification the specific iteration of the task being undertaken by a given participant, using data from other participants, highlighting the importance of individual technique.
4.2.2. Analysing individuality: Linear discriminant analysis
The participant pool was mapped in a similar manner to Scenario 1, as shown in Figures 12 and 13. The Silhouette scores are shown in Table 6.
Linear discriminant analysis by participant for left and right-handed participants.

Linear discriminant analysis by task for left and right-handed participants.

Silhouette scores for Scenario 2

Here, the LDA by participant contains partially overlapping clustering for RH and LH participants, with the silhouette score of 0.224 for RH participants and a slightly higher spread witnessed for LH participants, with a silhouette score of 0.585. The LDA by task for RH participants shows a large overlap in clusters for the fatigued tasks, which is not present for LH participants.
4.2.3. Participant performance
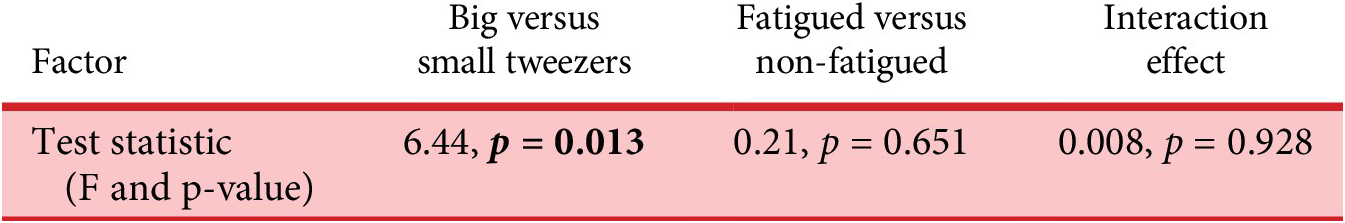
Both the fatigue and equipment change conditions were evaluated using the number of completed tasks as a metric of performance in an ANOVA analysis, exploring whether these and the interaction of these factors had a significant impact on task performance. The results are displayed in Table 7.
Statistical test and significance values for coarse performance metrics in Scenario 2

It was found that the equipment change had a significant impact on performance, while the state of fatigue did not. There was no indication of interaction effects between these two variables. The NASA-TLX results across various task permutations are shown below in Table 8.
NASA-TLX test statistics and significance values for task permutations presented in Scenario 2

Significant results are found between the physical workload, between the big and small tweezer conditions, and the performance workload metric between fatigued and non-fatigued conditions, with no interaction effects between these two variables in any case. This indicates that participants found using the big tweezers more physically exerting, and felt they performed less well when in the fatigued condition. Looking back at Table 7, a drop in performance was not witnessed. We then investigated how this materialised within the hand-tracking data collected, looking at how the hand angle spread changed for each condition. Global spacing of the angle between finger tips relative to the wrist has also been added and displayed in Table 9.
Two-way ANOVA significance values for all hand joint angles (tweezer size versus fatigue)

Here, we see some intuitive findings: the global spread of the thumb-index fingers is significantly different between big and small tweezer configurations. Several other joints are highlighted as being significantly different, such as every PIP joint. These were all found to be significantly lower values for the big tweezers configuration, indicating that these fingers were significantly more bent when using the big tweezers. There are no significant values between the fatigued and non-fatigued conditions, and there are no interaction effects found. This is consistent with the findings displayed in Table 7.
4.2.4. Analysis
The results in Scenario 2 reiterate the importance of utilising user-specific data within object interaction, even in simple constrained tasks. The classification tasks demonstrate that the system is able to classify constrained and similar object interactions on a per-participant basis, but again struggled to generalise to new users for hand-tracking data. The confusion matrix (Figure 14) shows that the model could successfully distinguish which piece of equipment was being used, but it consistently confused the fatigued and non-fatigued states. This indicates that while the system can generalise to detect ergonomic changes, it cannot reliably classify a new user as fatigued based on hand movements alone. The task was chosen due to its relevance to real-world scenarios, which are likely to be sub-maximal in nature. These tasks in general induce a greater variability and unpredictability of fatigue among the population, thus explaining the low LOGO classification rate (Forman et al. Reference Forman, Sonne, Kociolek, Gabriel and Holmes2022).
An example confusion matrix is shown for the LOGO analysis split.

The mapping shown in Figure 12 suggests a converse scenario to Scenario 1, with a lower observed spread of participants in both LH and RH participants. The low silhouette scores of participants indicate less individual dexterous technique for the task, reflecting that participants are naturally more constrained due to the use of the tweezers. This perhaps demonstrates preponderance for increased similarity in dexterous interaction driven by the object’s affordance (McGrenere and Ho Reference McGrenere and Ho2000). By acknowledging the differences in users’ technique regarding equipment, variability in technique can be assessed, aiding user training and understanding of task safety.
The LDA analysis shows there is still an observable difference between the fatigued and non-fatigued states across the participant pool in the majority of cases. This difference is less present for RH users utilising small tweezers, potentially due to users being less fatigued in the fatigued case. This finding reinforces the importance of a user-specific context. The ability to detect these changes in user state offers a direct pathway for designers to quantify the physical toll of a product’s usage, iteratively tailoring a design to minimise these fatiguing effects and maximise sustained task performance.
The NASA-TLX survey results presented a similar situation. The equipment condition has a significant impact on the perceived physical workload. Perceived performance was worst for the fatigued condition, even though this was not apparent in the coarse performance metrics or the hand-tracking data. These findings could suggest that while kinematic hand tracking successfully materialises certain ergonomic stressors, it does not fully reflect the less tangible cognitive and physiological dimensions of performance. There is potential for the utilisation of other multimodal data streams to understand these other facets of performance. Integrating eye tracking to quantify concentration levels and dynamic EMG to measure localised physical exertion are potential measures that could be utilised in this instance (Sims and Conati Reference Sims and Conati2020; Sultana, Ahmed, and Shafiul Alam Reference Sultana, Ahmed and Shafiul Alam2023). While the complexity of such integrated setups currently presents practical implementation challenges in early-stage design, they represent a necessary trajectory for the development of sensitive, real-time personalisation pipelines.
5. Discussion
The primary finding of this work is the profound influence of individual technique in dexterous object interaction. In the unconstrained tasks of Scenario 1, participant-specific behaviour was so distinguishable that it became the main driver for classification, far more so than the task itself. This explains why the system, despite performing well for known users, failed to generalise to new ones. Even in the constrained tweezer task of Scenario 2, individual action was still a critical factor, particularly when attempting to classify subtle changes in user state, such as fatigue. This confirms that even for simple, repetitive tasks, personal dexterity has strong, ingrained characteristics for which human factors teams and designers must account.
The results from Scenario 2 show that while changes in tool ergonomics can be detected, other, more user-centric factors might be harder to detect. Here, participants utilised a tool, limiting the variability in which participants performed the tasks. The system could reliably identify changes in tool ergonomics (i.e. different prototypes), even when generalising to new users, because this physical change imposed a consistent effect on everyone’s movements. In stark contrast, the system could not reliably identify changes caused by fatigue for new users. The subtle performance change from fatigue did not manifest consistently, meaning a general model for this internal state change was not feasible. To detect these state changes, multimodal data could be utilised to build a more complete picture of interaction (Lin et al. Reference Lin, Chen, Ali, Nugent, Cleland, Li, Ding and Ning2024).
The results of the participant performance analysis underline the capability of the data-driven approach. These showed that, while specific scenario performance could be reflected in coarse data-driven metrics, performing feature extraction of user-specific data sources could give more insight into more subtle measures of performance. While exemplified in a simple scenario, there are many feature extraction techniques that have been shown to provide extra insight into gesture recognition that could be applicable (Devineau et al. Reference Devineau, Moutarde, Xi and Yang2018). These metrics could become increasingly relevant where task performance is harder to quantify, and these temporal measures could be utilised to supplement post hoc qualitative insights.
Taken together, the results from both scenarios illustrate a fundamental trade-off between task constraint and the expression of individual dexterous technique. Scenario 1 demonstrates that in unconstrained tasks, the user-specific technique is the dominant source of variation, overshadowing the differences in hand movements required by the objects themselves and preventing the development of a general model that works for new users. Conversely, Scenario 2 shows that introducing a tool constrains this natural behaviour, reducing the variation between participants and allowing for the successful detection of performance changes caused by different equipment. However, both scenarios confirm through low LOGO accuracies that even when constrained, subtle changes in user state, such as fatigue, are expressed in highly individual ways. This suggests that while data-driven methods are sensitive tools for design insight, reliably interpreting performance requires accounting for user-specific behaviour, especially in tasks that allow for a high degree of dexterous freedom. The implications of these findings are discussed, highlighting future research directions, followed by limitations of our work.
5.1. Implications for data-driven and personalised product design
In both scenarios, results indicate that user-specific classification techniques need to be implemented to fully understand individual behaviours within product interaction. In Scenario 1, distinct dexterous techniques are witnessed in tasks with explicit variability. This example illustrates that this setup could analyse high-precision workflows, such as surgical interventions, textile production or manual electronics assembly. Here, specific process steps where user variability or dexterous issues could be detected. By addressing these areas, designers could target ergonomic interventions that benefit a broad user base while respecting individual procedural differences. Additionally, Scenario 2 tells us that even for standard use, equipment exhibits a large amount of variability in the way that users perform tasks. Investigating how variability emerges across tasks with standardised equipment and instructions tells us a lot about the implicit variability of tasks. This lens could tell us more about the users partaking in each activity, such as those with limited dexterity, tremors or those who are prone to fatigue.
These concepts were explored within a realistic, industry-scale data-collection scenario to highlight the practical challenges and considerations of implementation. We have demonstrated how traditional, coarse performance metrics, such as efficiency or ergonomic risk, materialise through specific dexterous techniques and high-dimensional hand-tracking data. There are more complex approaches that could be utilised to understand goals and performance, such as the usage of action anticipation or action intent models, and scoring users’ actions against some sort of set standard of usage (Heo, Moon, and Jung Reference Heo, Moon and Jung2026). Alternatively, similar clustering techniques combined with rules-based association mining could allow for interpretability of what variables lead to changes in performance (Geng et al. Reference Geng, Chen, Ma and Song2024).
With these speculative approaches in mind, there are two potential workflows that could be implemented to realise automated product personalisation. First, we could understand how adaptations and interventions for new users could be recognised. Collected interaction data through user studies could be compared against existing databases of users’ movements to map their performance against known users. Additional data sources to investigate cross effects, such as cognitive load and fatigue, could also be part of this analysis. Utilisation of interactive PCA tools (such as iPCA (Jeong et al. Reference Jeong, Ziemkiewicz, Fisher, Ribarsky and Chang2009) could enable designers to recognise whether variations in performance were due to the need for further training, or specific equipment parameters and dimensions that affect user performance during specific steps, states or across all scenarios, and to what degree equipment changes would induce positive change.
Alternatively, the techniques discussed could be utilised to audit existing designs or evaluate new prototypes. Natural variation among users could be mapped, identifying to what degree state-specific information interplays with this. Through parametrised experimentation, changing specific dimensions or instruction of use for specific steps, a similar result could be achieved with an understanding of which parameters (user state, dimensions of importance, instructional steps) are important for a user group or specific users. This work has already been demonstrated for optimisation for products with static dimensions, such as dental implants (Kosec et al. Reference Kosec, Huic, Martinec and Škec2025). However, understanding how dynamic behavioural data could be utilised for personalisation may require a more involved approach to optimisation and performance mapping, as discussed.
Unlocking these approaches and understanding what data could be utilised to facilitate personalisation in product design is a significant and expansive area for future investigation (Ormerod et al. Reference Ormerod, Dybvik, Fraser and Snider2024). There are many technologies, motivations and avenues that product personalisation and data-driven design could adopt. We recognise the need for a higher-level framework, encompassing all of these available technologies interlinked with product interaction and product performance, with an appreciation of how these could be utilised across all stages of the design cycle. By proving that data-driven insights can be generated at the individual product level, we provide the empirical foundation for digitally mapping user behaviours, facilitating personalisation across physical product interaction domains.
5.2. Limitations and future works
Although we have demonstrated that individuality can be interpreted using current hand-tracking methods, there are still many scenarios relevant to product development that need further investigation. Here, the participant data are collected within a controlled environment. This was to increase experimental robustness, such as ensuring consistent lighting and reducing participant distraction. While there are many controlled environments where fixed-mounting hand tracking would be viable, for example, factory workstations or surgical theatres, hand-tracking robustness would decrease due to increased occlusion. Not only this, but task understanding and user stress would be much more prevalent issues that would have a large impact on product interaction. Investigation in context-specific scenarios, alongside interpreting qualitative observations in this scenario, is vital to understanding appropriate use cases and the most prevalent opportunities.
While this work has focused on simple one-handed tasks, future understanding and applicability of bi-manual and multi-step tasks are an important next step. This would likely introduce far more variability into the collected dataset, potentially producing a richer exploration of technique and user preferences. Significant user mistakes were excluded from the labelling process; however, including slips and mistakes at an early stage of physical product design is vital when enhancing usability. Within this, there are several different types of errors that can occur when using physical interfaces, and are tied to task understanding, physical slips, motivation, etc. (Reason Reference Reason1990). Inclusion of appropriate other physical monitoring tools would help establish trends of which types of error are most likely to contribute to poor performance.
While the usage of webcams allowed for a flexible and low-cost multi-camera hand-tracking setup, future investigation into the benefits of higher frame rate setups should be conducted. This would require higher bandwidths and would not be supported by common video synchronisation tools utilised in this experiment, but fast, dexterous techniques and the inclusion of slips and mistakes could be more accurately captured in these circumstances.
Classification performance across the participant pool and within participants remained high in Scenario 2, suggesting that there is a high amount of individual user behaviour driving classification in this scenario. However, there could be other external factors driving this. For further robustness, completing further task repeats at a later time would account for changeability in technique due to natural variation between sessions. In addition to this, there are several environmental variables that are known to affect dexterity, along with certain user characteristics such as temperature, grip strength, age, hand size, etc. (Prasetyo Reference Prasetyo2020) that could be collected alongside dynamic data to monitor their effects.
The collected data and training strategy are exemplary of a suggested use case of the pipeline, within early-stage design testing with new or personalised products, where collecting a large and extensive dataset would be taxing to participants and would require a large amount of data labelling and time to complete. The suggested machine learning algorithm is one that provides fast training from the dataset while providing high accuracy. If more data were to be collected, then the parallel development of a more bespoke algorithm is suggested, but the success of this approach remains unknown.
Further collection of participant metadata, particularly features that may be able to be measured temporally, could add to understanding about what promotes groupings and differences from user to user in dimensionality reduction mapping. Utilising explainable AI tools could further aid this investigation. Collection of further participant background, such as implicit characteristics that likely contribute to individuals’ dexterous technique, such as profession, hobbies or prior experience with the tasks presented, that would be important to understand within a domain-based application. How this experience correlates with performance would help pre-empt which users may need substantial intervention and support for particular tasks.
6. Conclusion
This study establishes individual dexterous technique as a primary, measurable variable in product interaction, demonstrating that unique motor strategies dominate performance across both constrained and unconstrained tasks. By validating a high-dimensional, data-driven approach to capture these nuances, the research provides a foundation for three core contributions to Design Science. First, it confirms that user-specific strategies overshadow task-based commonalities, proving that models optimised for population-wide generalisation are fundamentally limited in recognising nuanced manual behaviours. Second, the results demonstrate that while task constraint facilitates the detection of ergonomic shifts, individual variability remains the critical barrier to identifying internal state changes, including fatigue. Consequently, individual calibration is a requirement for reliable performance monitoring in high-precision interfaces. Finally, it was demonstrated that high-dimensional tracking data captures subtle performance shifts that are reflected in traditional performance measures. The speculative workflows discussed offer future research directions, from raw behavioural data towards tangible dynamic performance insights, enabling evidence-based personalisation for hand-held physical products.
Acknowledgements
This work was supported by the Engineering and Physical Sciences Research Council (EPSRC) through the FARSCOPE Centre for Doctoral Training in Robotics and Autonomous Systems (Grant Number: EP/S021795/1).


 Open access